Core to successful cyber operations is the ability to maintain the integrity and availability of computer systems and networks. The first step in this process is knowing what is occurring on defended systems and networks. Both Windows and Linux feature tools that provide information about running processes, system users, and network connections. Network traffic between systems can be captured and analyzed with tools including tcpdump and Wireshark. In this chapter, the reader will learn what live information is available to a system administrator facing a potentially compromised system or network and will find different indicators of the attacks.
Using already-present tools to analyze the behavior of a running system provides advantages in speed and flexibility. However, it comes with limitations; if an adversary has sufficient privileges on the system, they can manipulate, modify, or even control the output from these tools and mislead the defender.
Linux Tools
One of the first things an administrator wants to know are the users logged on to the system.
Determining Users Logged On to the System
Two similar commands are available to determine the users currently logged into a Linux system.
Who
One Linux command that shows the logged-on users is who; running the command on a CentOS 7.1 system as root with one user (cgauss) logged in at the console, and second user (sgermain) connecting via SSH from spica.stars.example yields the following.
When run with the switches -a and -H, it prints column headers, the system boot time, the run level at system boot, the logged-in users, their logon time, and if they logged in remotely through SSH, the IP address, or hostname of the source.
The list of recent logins can be found with the last command.
[root@girtab ~]# last
sgermain pts/1 spica.stars.exam Sat Feb 18 20:08 still logged in
sgermain pts/1 spica.stars.exam Sat Feb 18 17:34 - 17:34 (00:00)
cgauss pts/0 :0 Sat Feb 18 17:34 still logged in
cgauss :0 :0 Sat Feb 18 17:34 still logged in
(unknown :0 :0 Sat Feb 18 17:34 - 17:34 (00:00)
... Output Deleted ...
The data for w and who is stored in the file /var/run/utmp while the historical data for last comes from /var/log/wtmp. Many attackers with privileged access to a system clobber one or more of these files when trying to retain access.
Aureport
A look at the history of the logons to a system can be provided by the command aureport. This tool is not included in the default installation for every distribution; for example, on Ubuntu systems, it needs to be installed with the command
jmaxwell@siegena:~$ sudo apt-get install auditd
On an OpenSuSE system, the corresponding installation command is
menklent:~ # zypper install audit
Once installed, aureport with the flag -au provides data about authentication attempts.
1. 02/18/2017 17:17:52 sgermain 10.0.2.28 ssh /usr/sbin/sshd no 456
2. 02/18/2017 17:18:03 sgermain 10.0.2.28 ssh /usr/sbin/sshd no 487
3. 02/18/2017 17:19:01 sgermain 10.0.2.28 ssh /usr/sbin/sshd no 537
4. 02/18/2017 17:19:05 sgermain 10.0.2.28 ssh /usr/sbin/sshd no 551
Determining User Activity
It is also important that the administrator know the activities of the users on the system.
Not all user accounts belong to humans; Linux systems use specialized system accounts for various processes. Generally, these system accounts have user id (UID) numbers less than 500, while user accounts corresponding to humans have UID numbers beginning with 500 or 1000, depending on the distribution and release. To find the UID given an account name, a user can use the id command.
The history command provides a list of the Bash shell commands run by the current user. Data for the history command is stored in the file ~/.bash_history, relative to the home directory of the user, and it can be manipulated and modified by the user (or root).
GNU Accounting Tools
The GNU accounting tools provide another way to determine the users that are or have been on the system as well as providing information about past executed commands. On CentOS systems, it is typically installed by default but not running, as can be verified1 by running
OpenSuSE, Ubuntu, and Mint systems do not install the GNU accounting tools, but they are available with the name acct. They can be installed with zypper (OpenSuSE) or apt (Mint/Ubuntu). Ubuntu and Mint systems start the service after subsequent reboots automatically; on OpenSuSE, this must be enabled manually.
One of the commands provided by the GNU accounting utilities is ac, which shows the amount of time users have spent connected to the system. The -d flag separates the data by date, and the -p by person, so to determine connect time by person by day run.
[root@girtab ~]# ac -dp
(unknown) 0.08
Jan 14 total 0.08
(unknown) 0.06
cgauss 36.32
Jan 15 total 36.38
(unknown) 0.01
cgauss 1.91
Feb 4 total 1.93
sgermain 1.05
(unknown) 0.04
cgauss 7.02
Feb 18 total 8.11
(unknown) 0.03
cgauss 0.04
Today total 0.06
These numbers depend on timing made by the system. If the system is virtualized, and the system is, for example, reverted from a snapshot, then these values may be misleading or confusing.
GNU accounting tools track the last time a command was run. Running lastcomm with a command name like ls shows who ran that command and when.
[root@girtab ~]# lastcomm ls
ls root pts/0 0.00 secs Sat Feb 18 20:55
ls cgauss pts/0 0.00 secs Sat Feb 18 20:55
ls root __ 0.00 secs Sat Feb 18 20:53
ls root __ 0.00 secs Sat Feb 18 20:53
... Output Deleted ...
When run with a username, like sgermain, lastcomm shows the commands run by that user.
[root@girtab ~]# lastcomm sgermain
gedit sgermain pts/1 0.00 secs Sat Feb 18 21:15
dbus-launch sgermain pts/1 0.00 secs Sat Feb 18 21:15
bash F sgermain pts/1 0.00 secs Sat Feb 18 21:15
bash F sgermain pts/1 0.00 secs Sat Feb 18 21:15
... Output Deleted ...
Determining the State of the System
Sometimes the administrator wants to know the current state of the system, including determining which processes are running or which network connections have been made.
Top
The top command provides a real-time list of processes running on the system; here is a representative result on a quiet system.
top - 21:16:39 up 23 min, 3 users, load average: 0.38, 0.15, 0.14
The processes are listed in order, with the processes using the most CPU listed at the top. When a system is slow or sluggish due to a heavy load, this is the place to start diagnosing the problem.
Ps
The ps command is used to determine the processes running on a system. This tool comes with a wide range of flags to customize the output. To see the processes currently running sorted by PID, as root run ps with the flags aux.
[root@girtab ~]# ps aux
USER PID %CPU %MEM VSZ RSS TTY STAT START TIME COMMAND
When run with the flag --forest, the command ps returns the process structure, showing which process spawned another.
[root@girtab ~]# ps ax --forest
PID TTY STAT TIME COMMAND
2 ? S 0:00 [kthreadd]
3 ? S 0:00 \_ [ksoftirqd/0]
... Output Deleted ...
4048 ? Sl 0:02 /usr/libexec/gnome-terminal-server
4051 ? S 0:00 \_ gnome-pty-helper
4052 pts/0 Ss 0:00 \_ bash
4088 pts/0 S 0:00 \_ su -
4095 pts/0 S 0:00 \_ -bash
4485 pts/0 R+ 0:00 \_ ps ax --forest
Netstat
One command to determine what ports are open on a Linux is netstat. Linux and Unix systems have two kinds of ports - network ports and Unix sockets. Unix sockets are used for communication by different processes on the same system, so in general we are uninterested in those; however, both sorts of ports are reported by netstat.
The netstat tool has several useful flags, including:
-v Be verbose
-n Use numeric values for ports, rather than names
-A inet (or –inet) Show only IPv4 connections
-A inet6 (or –inet6) Show only IPv6 connections
-x Show only Unix sockets
-t Show only TCP (v4/v6)
-u Show only UDP (v4/v6)
-p Show the PID for that connection
-l Show listening sockets (not shown by default)
-a Show listening and open sockets
-r Show routing table
To find out what is listening on the system, a good set of flags is
[root@girtab ~]# netstat -nlpv --inet
Active Internet connections (only servers)
Proto Recv-Q Send-Q Local Address Foreign Address State PID/Program name
This provides a verbose list listening TCP and UDP ports in numerical form along with the PID of the process that opened the port.
Lsof
The tool lsof can be used to determine what resources are being used and by which process. Resources include network sockets but can also include devices like a USB drive or files. For example, the current or listening IPv4 connections can be shown with
[root@girtab ~]# lsof -i4
COMMAND PID USER FD TYPE DEVICE SIZE/OFF NODE NAME
In addition to the listening ports, this shows an active SSH connection from girtab.stars.example.
To determine the resources used by a selected PID, specify the PID with the -p flag. For example, the previous shows an SSH connection for sgermain using PID 4254; to examine this process, the administrator runs the following.
[root@girtab ~]# lsof -p 4254
lsof: WARNING: can't stat() fuse.gvfsd-fuse file system /run/user/1000/gvfs
Output information may be incomplete.
COMMAND PID USER FD TYPE DEVICE SIZE/OFF NODE NAME
gedit 4343 sgermain mem REG 253,1 333632 50633441 /usr/share/font
... Output Deleted ...
Here the data shows that the user sgermain is apparently using gedit on PID 4343.
The /proc Directory
A great deal of information is available about a PID through the system’s /proc directory. That directory contains subdirectories for each running PID. Consider the PID 4343 from the previous example.
[root@girtab ~]# cd /proc/4343
[root@girtab 4343]# ls
attr cpuset limits ns root syscall
autogroup cwd loginuid numa_maps sched task
auxv environ maps oom_adj sessionid uid_map
cgroup exe mem oom_score smaps wchan
clear_refs fd mountinfo oom_score_adj stack
cmdline fdinfo mounts pagemap stat
comm gid_map mountstats personality statm
coredump_filter io net projid_map status
The command line used to start the process is contained in /proc/4343/cmdline, where the arguments are separated by null bytes. To show the complete command line, use cat with the -v option to show the non-printing null characters.
[root@girtab 4343]# cat -v cmdline
gedit^@testdoc^@
The file /proc/4343/cwd is a symbolic link pointing to the process’s current working directory.
Chapter 2 showed how to run the Java Applet JAX-WS Remote Code Execution attack against a Linux target running Java 7. Configure and run the attack, say against a CentOS 6.0 64-bit system running Firefox and Java 7 Update 0; for the payload use Java Meterpreter running through reverse HTTPS, connecting back to the attacker on port 443. Interact with the target and start a shell.
After the successful attack, on the victim’s system, a check of logged-in users by root shows nothing out of the ordinary; the who command shows
[root@sirius ~]# who
pfermat tty1 2014-07-31 12:13 (:0)
pfermat pts/0 2014-07-31 12:13 (:0.0)
enoether pts/1 2014-07-31 13:15 (10.0.2.18)
pfermat pts/2 2014-07-31 14:12 (:0.0)
A check of the process list with ps aux shows little out of the ordinary, save for a few lines near the end.
[root@sirius ~]# ps aux
USER PID %CPU %MEM VSZ RSS TTY STAT START TIME COMMAND
Here the combination of Java and Bash shells catches the eye. When ps --forest is run to make the relationships between processes more explicit, it becomes suspicious.
[root@sirius ~]# ps ax --forest
PID TTY STAT TIME COMMAND
2 ? S 0:00 [kthreadd]
3 ? S 0:00 \_ [migration/0]
... Output Deleted ...
3230 ? S 0:00 /bin/sh /usr/lib64/firefox-3.6/run-mozilla.sh /usr
This shows a Firefox process (3230) spawned a Java process (3521), which seems normal enough. On the other hand, why is another Java process (3578) unrelated apparently to Firefox spawning a pair of Bash shells2 (3615, 3640)?
A check of the network connections with netstat shows
[root@sirius ~]# netstat -ant
Active Internet connections (servers and established)
Proto Recv-Q Send-Q Local Address Foreign Address State
The victim is located at 10.0.2.10, and the SSH connection to port 22 from 10.0.2.18 seen earlier is noted. Also noticed is what appears to be an HTTP connection to the site 184.29.105.107; a lookup of the IP address shows that it is named a184-29-105-107.deploy.static.akamaitechnologies.com. Nothing in this suggests anything malicious, at least not yet. On the other hand, the last line is perplexing - it appears to be using stateless translation between IPv4 and IPv6 to connect to 10.0.2.248, yet the system is on a network that was not configured to support IPv6.
A pair of lsof commands are run, one to see what is happening on IPv4 and one on IPv6. The command on IPv4 returns
[root@sirius ~]# lsof -i4
COMMAND PID USER FD TYPE DEVICE SIZE/OFF NODE NAME
Much of what is shown is standard; for example, Java libraries have been loaded into memory. There is the IPv6 connection that appears to be running between IPv4 addresses; there also appears to be a pair of deleted temporary files that were in /tmp that are named jar_cache(long-number).tmp.
The results for the child PIDs 3615 and 3640 both are much smaller and show nothing of interest.
[root@sirius ~]# lsof -p 3640
COMMAND PID USER FD TYPE DEVICE SIZE/OFF NODE NAME
bash 3640 pfermat cwd DIR 253,0 4096 783371 /home/pfermat
These are the same deleted files jar_cache(long-number).tmp noted earlier through lsof. Though the files have been deleted from their original location in /tmp, they can still be accessed through the link in /proc. Copy these and the Java class noted earlier to a convenient location for further analysis.
An attacker that writes files to a target system runs the risk that these files will be detected by the defender, and subsequently analyzed.
Detect: Firefox XCS Code Execution
Chapter 2 showed how to attack Firefox directly with the Firefox 5.0 - 15.0.1 __exposedProps__ XCS Code Execution attack. Configure the attack using the default JavaScript XPCOM shell running on the default port (TCP/4444) for the payload. Visit the malicious web page with a vulnerable Ubuntu 12.04 desktop system using the vulnerable (and default) Firefox 14.0.1, and obtain a session on the target.
After the successful attack, listing the users on the system shows just the single logged-in user.
There are two connections of interest. The first (1567) runs on HTTP and appears to be a connection from a local Ubuntu named service to a host at Canonical, the makers of Ubuntu. The second connection (1757) is much more suspicious; it is a browser making an outbound connection to a host on TCP/4444, which is known to be the default port for many Metasploit payloads.
A closer inspection of the Firefox process (1757) is clearly warranted. The lsof command shows a collection of libraries loaded into memory, access by Firefox to an SQLite database, and the network connection.
dhilbert@betelgeuse:~$ sudo lsof -p 1757
lsof: WARNING: can't stat() fuse.gvfs-fuse-daemon file system /home/dhilbert/.gvfs
Output information may be incomplete.
COMMAND PID USER FD TYPE DEVICE SIZE/OFF NODE NAME
firefox 1757 dhilbert cwd DIR 8,1 4096 1058150 /home/dhilbert
Because Firefox is a web browser, outbound network connections from it are expected. Had the attacker selected a more appropriate port (e.g., TCP/443) for the payload, then the analysis of the network connections would have shown nothing of interest. The JavaScript payload runs within Firefox, so this attack created no new processes to arouse the suspicion of the defender. This brief analysis of the Firefox process itself shows nothing out of the ordinary. Taken together, this attack is much less detectable than the first example. On the other hand, the stealth comes at a cost, as the attacker is trapped in the Firefox process. Once Firefox is terminated, the attacker loses access to the system.
Windows Tools
As was the case for Linux systems, it is critical that Windows administrators can determine who is logged on to a system.
Determining Users Logged On to the System
One way to determine the users logged on to a system is to use one of the tools from the Sysinternals suite. The Windows Sysinternals Suite is a collection of 70 tools that are invaluable to a Windows system administrator. The tools can be downloaded in a group from https://docs.microsoft.com/en-us/sysinternals/downloads/sysinternals-suite; they can also be downloaded individually.
PsLoggedon
One useful Sysinternals tool is PsLoggedon, which lists the users currently logged on to a system.
Most Sysinternals programs have an end-user license agreement that needs to be accepted before the program will complete; the flag /accepteula accepts the agreement automatically.
Wmic Query to Determine Logged-On Users
The built-in tool wmic can be used to list the currently logged-on users; run the query
C:\Users\Felix Klein>wmic computersystem get name, username
Name UserName
INTERAMNIA INTERAMNIA\Felix Klein
LogonSessions
The Sysinternals tool logonsessions, run as an administrator, lists the logon sessions on the system.
Here the /p switch provides information about the process(es) running in each session. This program was run on the Windows 10-1607 system drake on the domain PLUTO; the non-administrator user PLUTO\gverdi was logged on to the system. To run logonsessions.exe, that user started an administrator command prompt as the domain administrator PLUTO\jbach. The computer account PLUTO\DRAKE$ is seen to have started the winlogon.exe process as well as some services, including one for VirtualBox. The user PLUTO\gverdi is seen to be logged on to the system and is running explorer.exe among other processes. The domain administrator PLUTO\jbach has started a command prompt (4612) and run the logonsessions.exe program (5796). Omitted from this output are the result from some service accounts.
Determining the State of the System
Just like on Linux, an administrator of a Windows system can examine the processes running on the system as well as the system’s network connections.
Tasklist
The command tasklist lists the processes running on a Windows system, including their name and PID.
Attackers have recognized the value of using svchost.exe as a cover for their malware; any process named svchost.exe without corresponding Windows services should be treated as suspicious. The sc command can be used to provide the description of a service.
To find the description of TrkWks from PID 1144 above, run
C:\Users\Administrator>sc qdescription TrkWks
[SC] QueryServiceConfig2 SUCCESS
SERVICE_NAME: TrkWks
DESCRIPTION: Maintains links between NTFS files within a computer or across computers in a network.
Extended information about the state of a service can be found with
C:\Users\Administrator>sc queryex TrkWks
SERVICE_NAME: TrkWks
TYPE : 20 WIN32_SHARE_PROCESS
STATE : 4 RUNNING
(STOPPABLE, NOT_PAUSABLE, ACCEPTS_SHUTDOWN)
WIN32_EXIT_CODE : 0 (0x0)
SERVICE_EXIT_CODE : 0 (0x0)
CHECKPOINT : 0x0
WAIT_HINT : 0x0
PID : 1144
FLAGS :
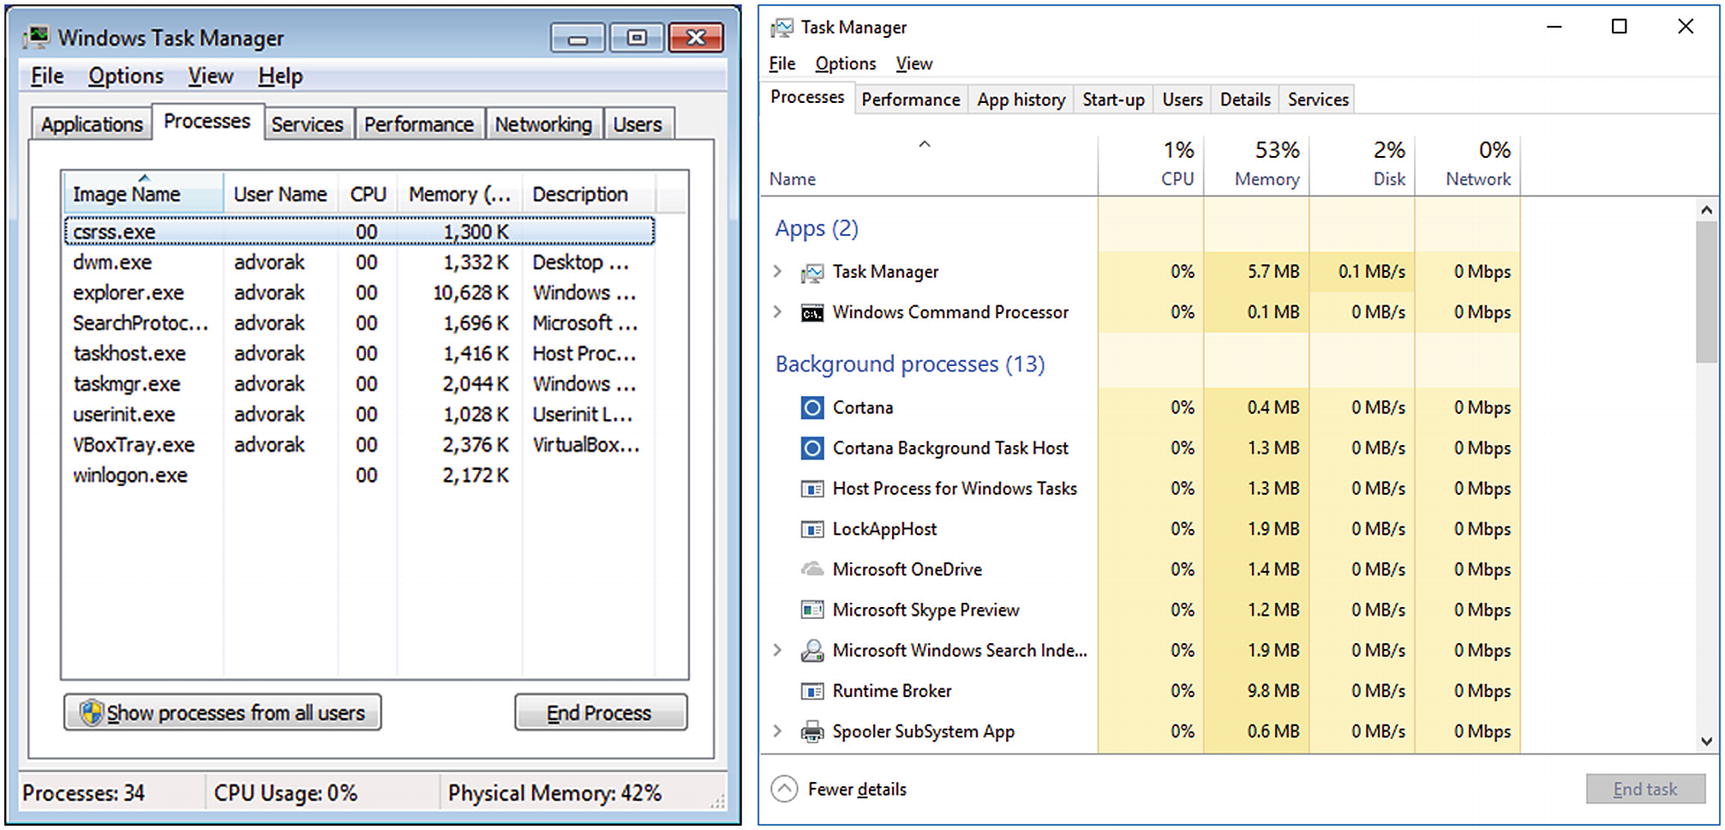
Task Manager
Windows Task Manager (Figure 3-1) displays the running processes in a graphical tool. It can be started with the keyboard shortcut CTRL+SHIFT+ESC; it is also one of the options available on a running system after pressing CTRL+ALT+DELETE on a logged-in system.
Figure 3-1
A comparison of Task Manager on Windows 7 (left) and Windows 10 (right)
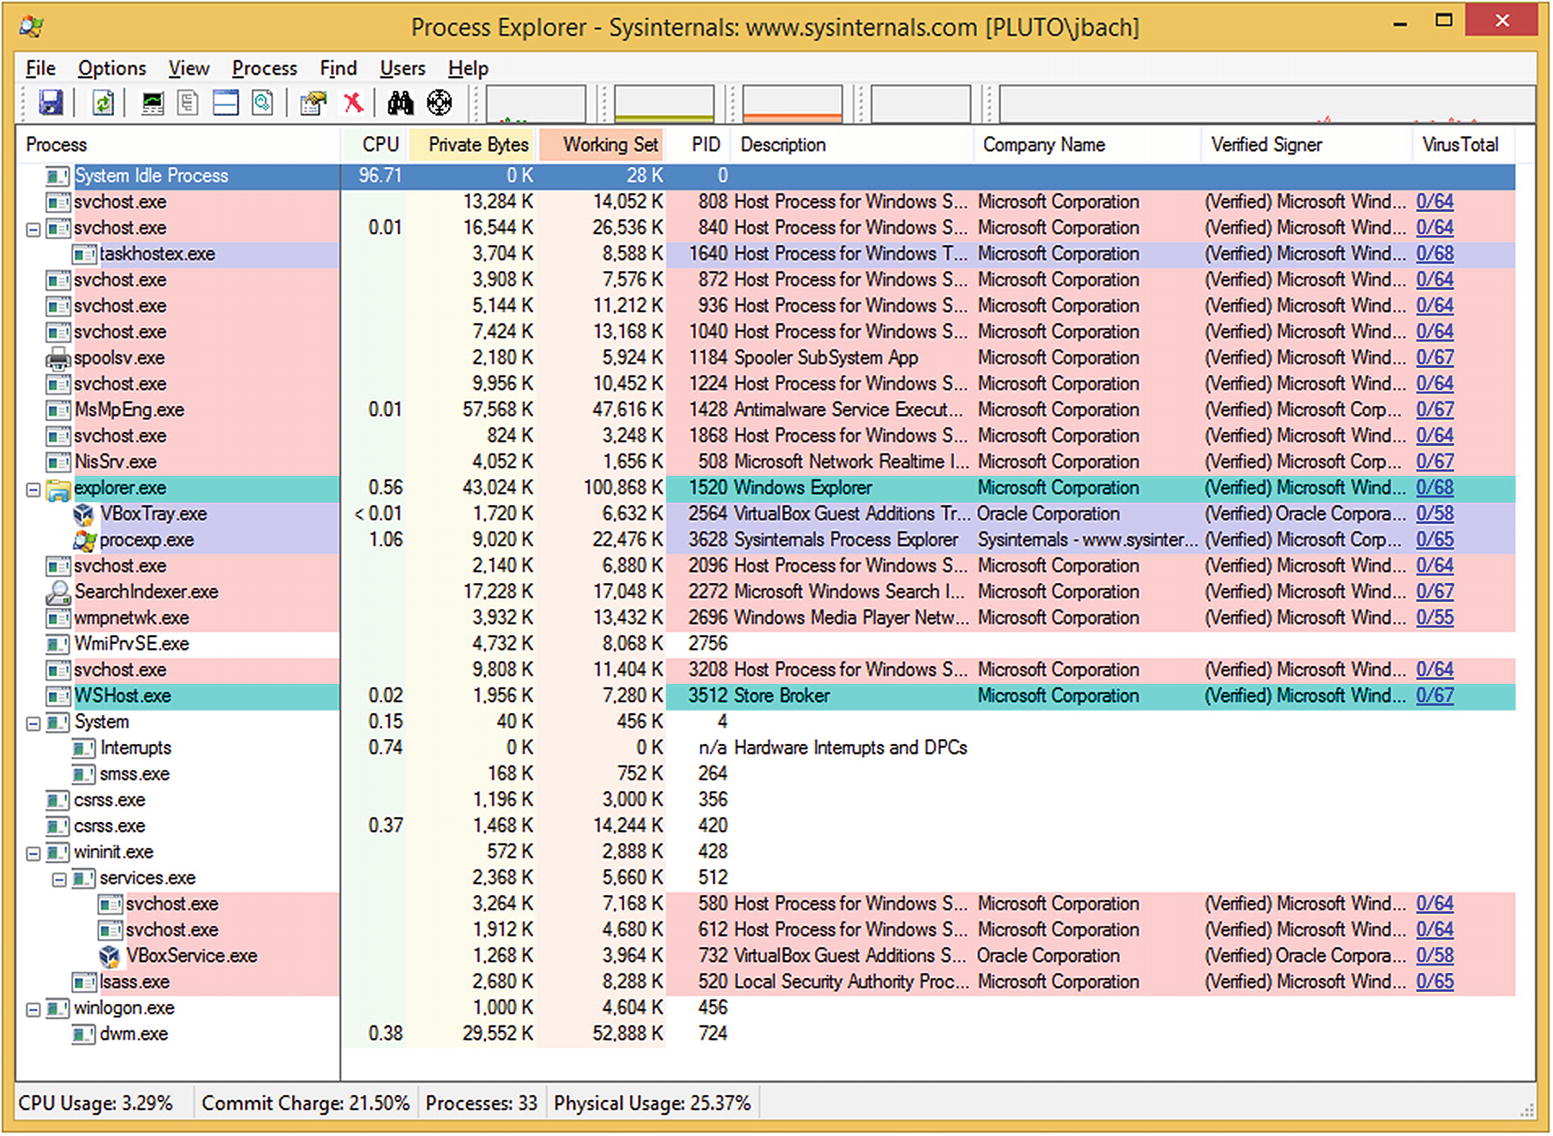
Process Explorer
The Sysinternals tool Process Explorer (procexp.exe) (Figure 3-2) when run as administrator provides a more feature-rich tool to manage running processes. Process Explorer color codes the process name by the process type.
Green: New processes
Red: Deleted processes
Gray-Blue: Processes run by the same user running Process Explorer
Pink: Services
Gray: Suspended processes
Purple: Packed processes, meaning that it is compressed or encrypted. Though some legitimate processes are packed (e.g., IrfanView, a common image viewer), some malware also uses this technique.
Yellow: .NET processes, or DLLs that have been rebased in memory
Brown: Jobs
Teal: Immersive processes; these are only found on Windows 8, Windows Server 2012, and later operating systems.
Figure 3-2
Process Explorer on Windows 8.1
Process Explorer can verify that processes on the system are running with verified signatures; from the Options menu select Verify Image Signatures. An additional column is shown; if the application is signed, then the publisher is listed. Though many legitimate applications are signed, not all are.
Process Explorer can submit the hashes of running processes to VirusTotal for analysis. VirusTotal, available at https://www.virustotal.com/en/, checks the submission against different antivirus tools. When VirusTotal is used with Process Explorer (navigate Options ➤ VirusTotal.com ➤ Check VirusTotal.com), a new column appears in the display indicating the number of antivirus products that considered the file malicious and the total number of antivirus products checked. Clicking on the hyperlink in that column takes the user to the corresponding web page on VirusTotal.com.
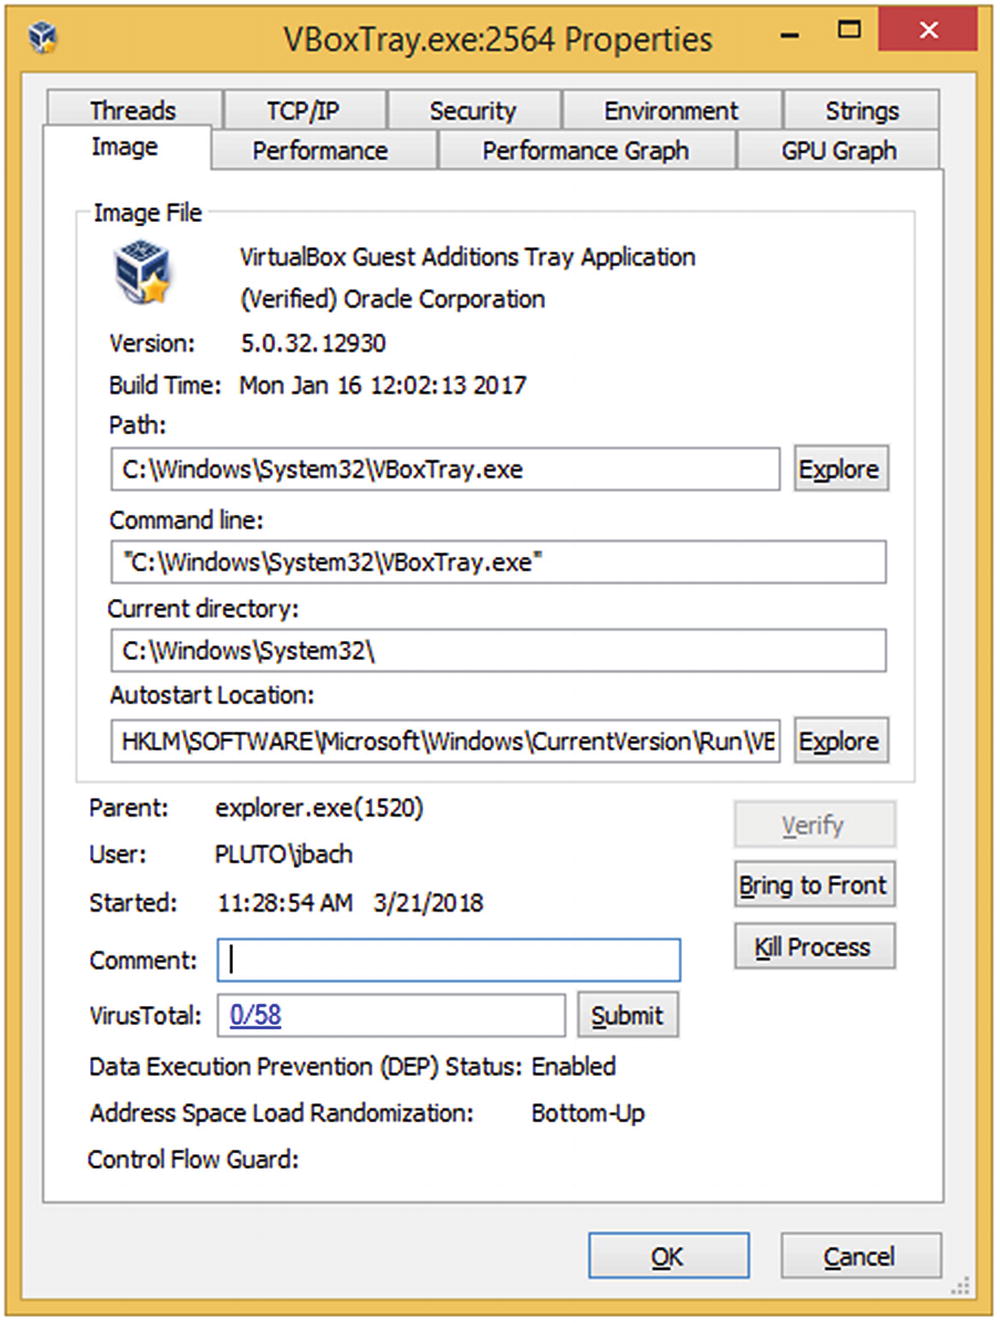
Double-clicking on any process brings up a dialog box with the properties of that process (Figure 3-3).
Figure 3-3
Process Explorer on Windows 8.1 examining a process
One tab provides information about the image, including the file name, its version, its current working directory, and its parent process. The administrator can use the “Bring to Front” button to have the process appear as the top application on the Desktop. The TCP/IP tab lists all active network connections for the process. Other tabs provide information about process execution, performance, disk and network, running threads, and the environment variables for the process. The strings tab lists the text strings that occur either in the image or in memory.
Process Explorer can replace Task Manager; from the Process Explorer main menu, navigate Options ➤ Replace Task Manager.
An open source tool that provides many of the features of Process Explorer is Process Hacker, available at http://processhacker.sourceforge.net.
Process Monitor
The Sysinternals tool Process Monitor (procmon.exe) records input and output for processes, including file access, network access, and registry access. Content data is not recorded, though the process stack is. Process Monitor captures an enormous amount of data on a running system: far too much to be analyzed live. The events recorded by Process Monitor can be saved for later analysis; this subsequent analysis can even be done on a different system.
Netstat
Windows systems have a program named netstat to determine the state of the network connections on the system. Though it is like the Linux tool, the command-line switches are different. To use netstat to show the listening ports, use the /a switch; to have the ports displayed in numeric form, use /n; and to include the PID of the process that opened the port, use /o.
C:\Users\Felix Klein>netstat /ano
Active Connections
Proto Local Address Foreign Address State PID
TCP 0.0.0.0:135 0.0.0.0:0 LISTENING 696
TCP 0.0.0.0:445 0.0.0.0:0 LISTENING 4
TCP 0.0.0.0:5357 0.0.0.0:0 LISTENING 4
TCP 0.0.0.0:49152 0.0.0.0:0 LISTENING 380
TCP 0.0.0.0:49153 0.0.0.0:0 LISTENING 784
... Output Deleted ...
UDP [::]:60876 *:* 1284
UDP [::1]:1900 *:* 1284
UDP [::1]:56500 *:* 1284
UDP [fe80::fc48:a613:ee25:557%11]:1900 *:* 1284
UDP [fe80::fc48:a613:ee25:557%11]:56499 *:* 1284
The name of the process that opened the connection is available with the /b switch, though this requires an Administrator level command prompt. The /f switch displays the name rather than the IP address for destinations. The /p flag filters the results by protocols; for example, to see just TCP listening ports on IPv6, run
C:\Users\Felix Klein>netstat /a /p TCPv6
Active Connections
Proto Local Address Foreign Address State
TCP [::]:135 Interamnia:0 LISTENING
TCP [::]:445 Interamnia:0 LISTENING
TCP [::]:5357 Interamnia:0 LISTENING
TCP [::]:49152 Interamnia:0 LISTENING
TCP [::]:49153 Interamnia:0 LISTENING
TCP [::]:49154 Interamnia:0 LISTENING
TCP [::]:49155 Interamnia:0 LISTENING
TCP [::]:49156 Interamnia:0 LISTENING
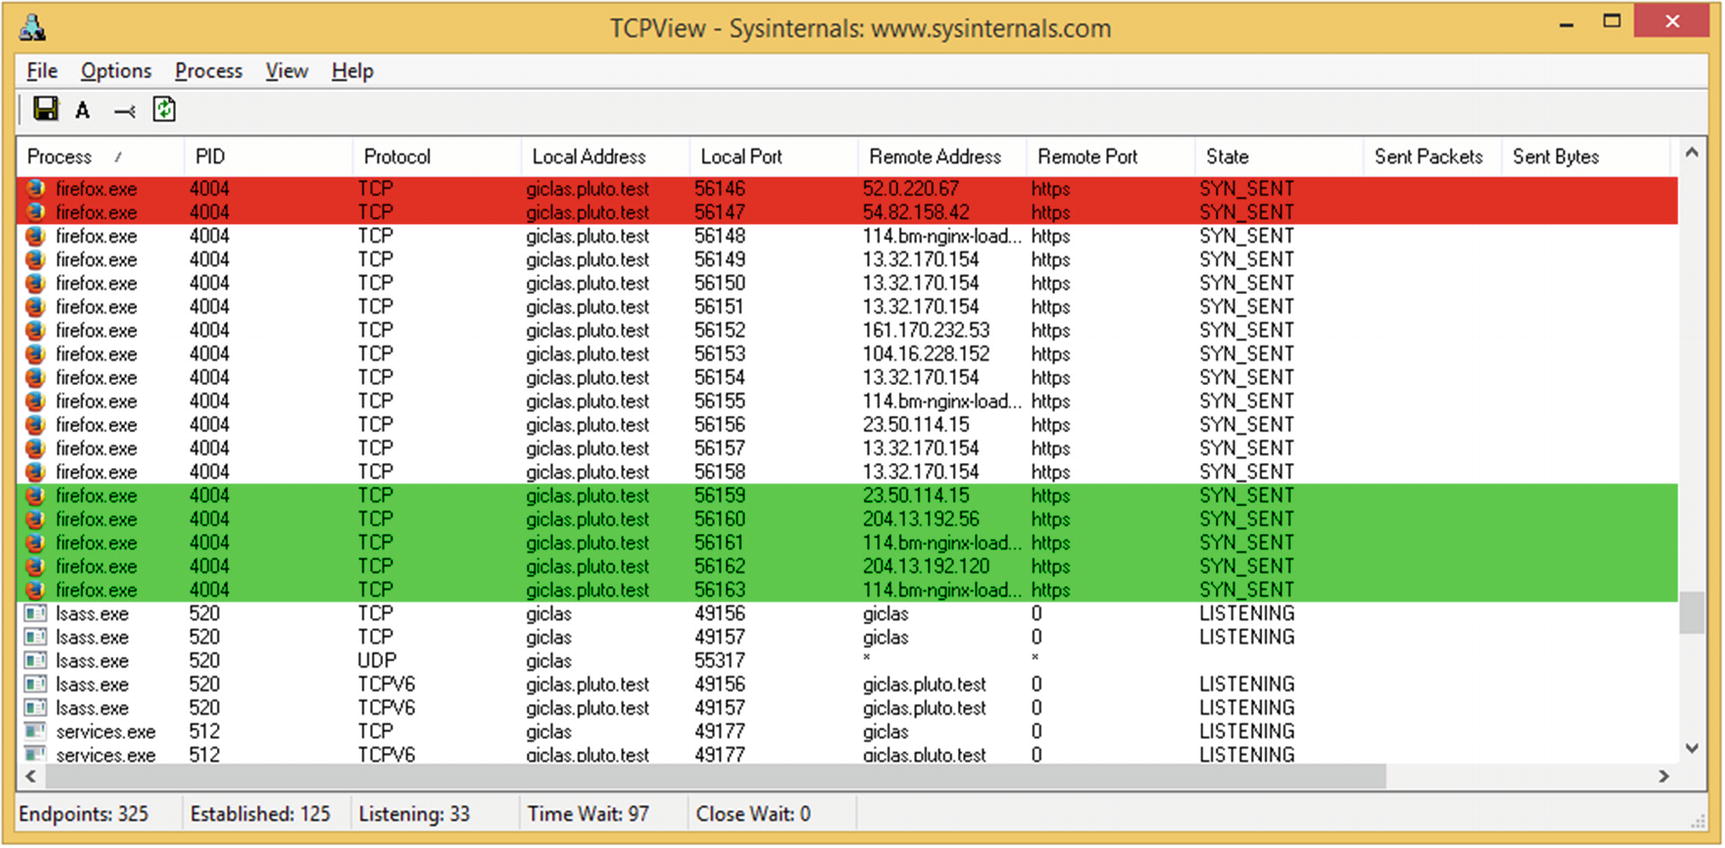
TCPView
The Sysinternals tool TCPView (tcpview.exe) (Figure 3-4) provides a graphical way to view network connections on the system. Each connection is color coded: new in green, recently closed in red, and connections that have recently changed state in yellow.
Figure 3-4
TCPView on Windows 8.1
Right-clicking on an entry in TCPView brings up a context menu that allows the user to determine the properties of the process that started the connection; it also allows the user to run a whois query on the connection’s destination.
Detect: MS13-055 CAnchorElement
Chapter 2 showed how to run the MS13-055 CAnchorElement attack against Internet Explorer 8 on a Windows 7 system running with Java 6 installed. Run the attack, using the Meterpreter payload and reverse HTTPS.
After the (successful) attack, listing the users on the system shows nothing out of the ordinary.
C:\Users\Hermann Weyl>wmic computersystem get username,name
Name UserName
DAVIDA DAVIDA\Hermann Weyl
Running logonsessions and including information about the processes yields one interesting artifact - the user appears to be running a copy of notepad.exe, yet the application is not seen on the desktop.
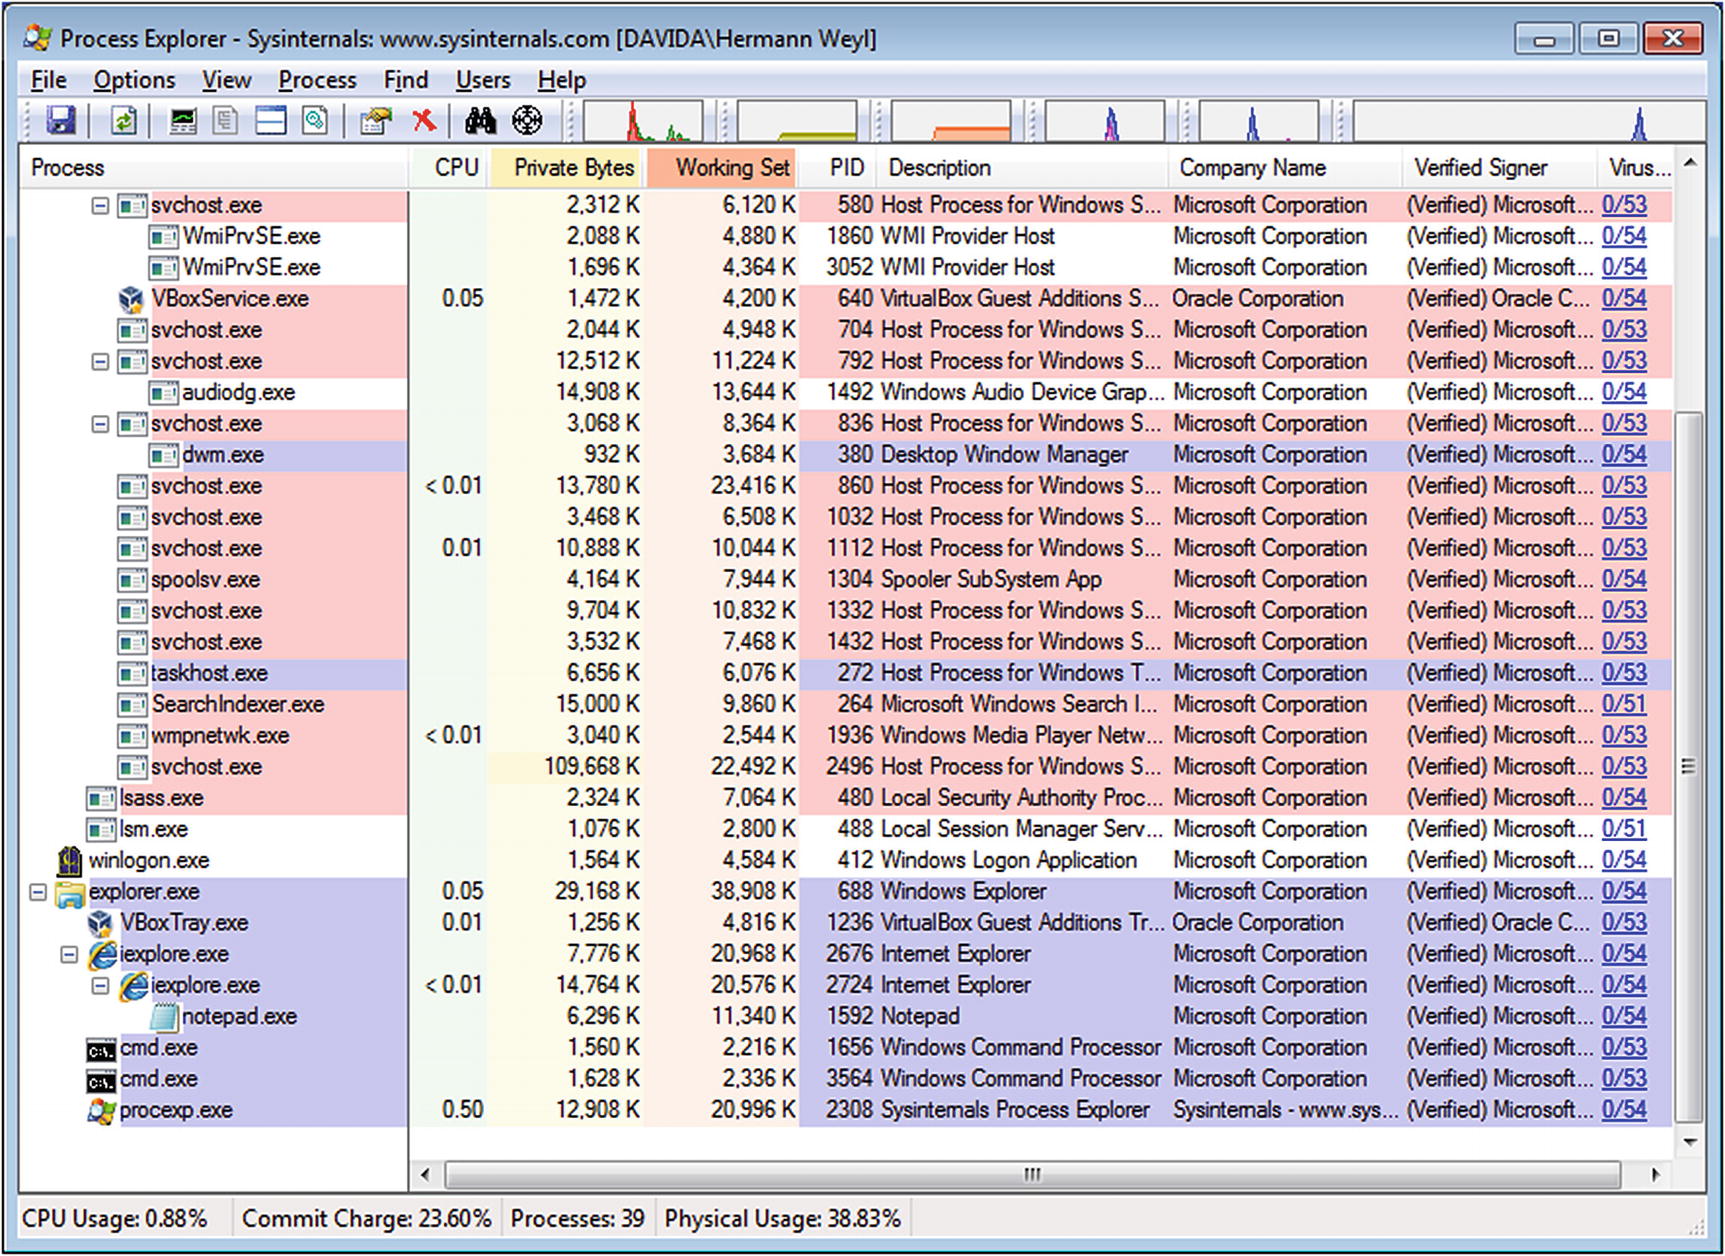
Process Explorer (Figure 3-5) notes the notepad process; unusually, it is running as a child process for Internet Explorer. Double-click on the notepad.exe process; from the Image tab, use the button to “Bring to Front”; this should bring the window(s) used by that process to the top of the Desktop. This fails, with a message, stating that “No visible windows found for this process.” Together, this is quite suspicious.
Figure 3-5
Process Explorer after a successful MS13-055 attack on Internet Explorer using the Meterpreter payload with reverse HTTPS
On the other hand, the image has a valid signature from Microsoft, and VirusTotal raises no warnings. This combination of behaviors is expected; as noted in Chapter 2, Metasploit injects its code into running processes and spawned the notepad process to ensure its survival if Internet Explorer is closed. Since the original notepad.exe on the disk is unchanged, its signature remains valid, even though it was modified after it began running.
A check of the TCP/IP resources used by the notepad process or either of the two parent Internet Explorer processes does not show any connections; neither does TCPView. Downloading a large file (say 50 MB) from Meterpreter is enough that TCPView notes the connection but then only fleetingly.
If the attacker uses the shell command from within Meterpreter to open a command prompt on the target, other artifacts become available for analysis. A new cmd.exe process spawns, with notepad.exe as the parent. Moreover, the connection between the systems now appears, both in TCPView and in netstat.
The PID (1592) for the connection back to the attacker (10.0.2.251, TCP/443) is the PID for notepad.exe, not the command prompt.
This network connection remains, even if the attacker backgrounds the shell in Meterpreter, or even backgrounds the entire session.
In this example, the defender did not so much detect the MS 13-055 CAnchorElement attack, but rather detected the activities of the attacker once they were on the system. The notepad.exe process (PID 1592) as a child of an iexplore.exe process (PID 2724) was the first anomaly. If the attacker spawns a shell, then the notepad.exe process makes an outbound network connection, providing a second anomaly. This is one reason why attackers take care to manage what artifacts they leave on the system.
Detect: Adobe Flash Player Shader Buffer Overflow
Suppose an attacker uses the Adobe Flash Player Shader Buffer Overflow attack against the default version of Flash included as the plugin for Internet Explorer 10 in Windows 8. This attack is launched in the same way as other attacks shown in Chapter 2.
After a successful attack, listing the users on the system shows nothing out of the ordinary, and the logonsessions command shows only Internet Explorer and its Flash Player plugin running.
C:\Windows\system32>wmic computersystem get name, username
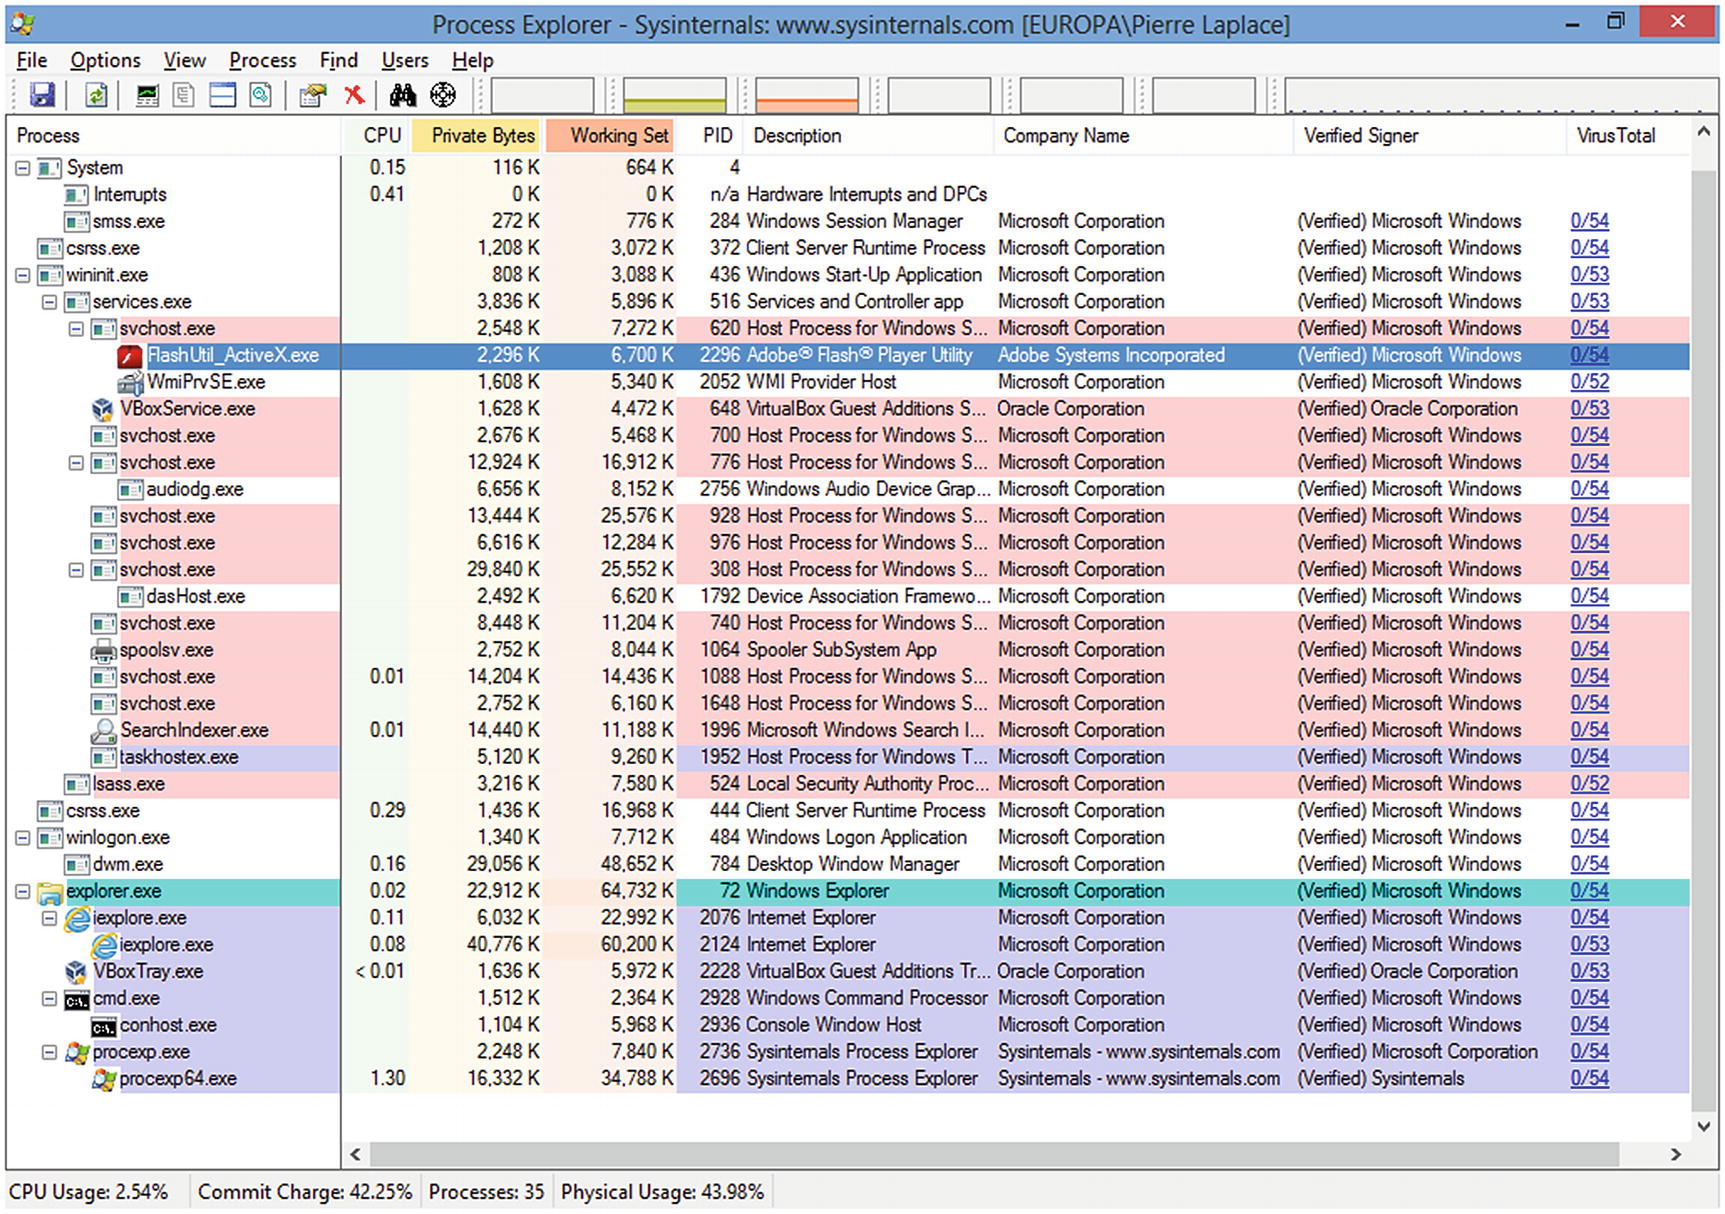
Process Explorer (Figure 3-6) shows a pair of Internet Explorer processes; the second (2124) is a child of the first (2076). It also shows a new instance of svchost.exe, running the Flash Player Plugin. These applications are running with verified signatures and without being flagged by VirusTotal.
Figure 3-6
Process Explorer after a successful Adobe Flash Player Shader Buffer Overflow Attack on Windows 8 using the Meterpreter payload with reverse HTTPS
The connection to the attacker’s system is difficult to detect. In general, it does not appear in the TCP/IP tab of the processes in Process Explorer; it does not appear in TCPView; and it does not appear in netstat, unless the attacker is making extensive use of the connection between the systems at that moment. Downloading a large file, for example, is sufficient for the connection to briefly appear. The connections are not associated with the Flash plugin, but instead associated with the child Internet Explorer process (PID 2124).
If the attacker leaves Meterpreter and starts a Windows command shell on the target using the Meterpreter shell command, then two new processes are spawned: a conhost.exe whose parent is cmd.exe whose parent is the child Internet Explorer process. Even then, unless the attacker is actively and extensively using the network, the connection does not appear in TCPView.
The original attack did not spawn a second process, making its detection on the target more difficult. On the other hand, if the Internet Explorer process is killed, the attacker loses their connection.
Network Tools
In a physical network, hardware taps and span ports can be used to send copies of network traffic to one or more sensors. For a smaller test network consisting of virtual machines running on the same virtualization solution (VMWare or VirtualBox), then the virtualization tools can be used. On VMWare Workstation with a Windows host, any guest network card in promiscuous mode can see all the traffic on its virtual network. In VirtualBox, a virtual network adapter can be placed in promiscuous mode only if allowed by the network settings for the adapter. To view or update the settings, navigate the VirtualBox main menu for the guest through Devices ➤ Network ➤ Network Settings. Select the adapter, and from the Advanced Menu, configure promiscuous mode (Figure 1-3).
Tcpdump
To capture packets on a Linux host for later analysis, use tcpdump. This tool is installed by default on most Linux distributions, including the distributions described in Chapter 1. To use tcpdump to capture packets to a file, say traffic, run (as root)
arcturus:~ # tcpdump -w traffic
Of course, if this runs sufficiently long, the file becomes quite large. To ensure that the destination file does not grow indefinitely, specify the size of the file (in MB) with the -C option. This does not stop the capture though; subsequent data is stored in the file traffic1, then traffic2, and so on. Now though the individual file sizes remain fixed, the process still attempts to fill the entire disk. The -W option is used to rotate the output through the specified number of rotating files. Consider the command
arcturus:~ # tcpdump -C 100 -W 5 -w traffic
This collects network traffic and stores the results in traffic0 until it collects 100 MB of data; then it stores the results in traffic1 until it fills, on through traffic4. When the last file fills, the original traffic0 is be overwritten with new data, and so on.
Wireshark
Wireshark is an excellent tool used to analyze captured packets. It is possible to use tcpdump to do so, but tcpdump lacks a graphical user interface. It is also possible to use Wireshark directly to capture packets, and this is often reasonable for small captures to help debug a network problem.
Wireshark is not installed by default on most Linux systems. The installation method varies with the distribution:
CentOS: yum install wireshark-gnome
OpenSuSE: zypper install wireshark
Ubuntu/Mint: apt-get install wireshark
A Windows installer is available from the Wireshark page at https://www.wireshark.org/download.html. That page also has links to older versions of Wireshark.
To analyze multiple packet capture files, they must first be merged. The simplest way to do so is to drag and drop the files into Wireshark. Wireshark does have the ability to merge two packet capture files (navigate the main menu through File ➤ Merge), but this only functions on two files at a time, and one must already be saved.
The default Wireshark display (Figure 3-7) breaks into three panes. The top pane provides a column-based list of the received frames/packets; the middle pane summarizes the details of the frame/packet broken down by component; the bottom pane is the raw data from the frame/packet.
Figure 3-7
Wireshark 1.4.6 on OpenSuSE 12.1
The highlighted frame of Figure 3-7, number 11, is an Ethernet frame containing a UDP packet from the Google nameserver at 8.8.8.8 returning with the results of a DNS query.
Packets and frames in the list are color coded by type. Additional columns can be included in the list; one particularly useful column is the absolute time that the packet was received. Right-click on the column headers and select Column Preferences. Select Add; for the Field Type select Absolute Time and give the column a name.
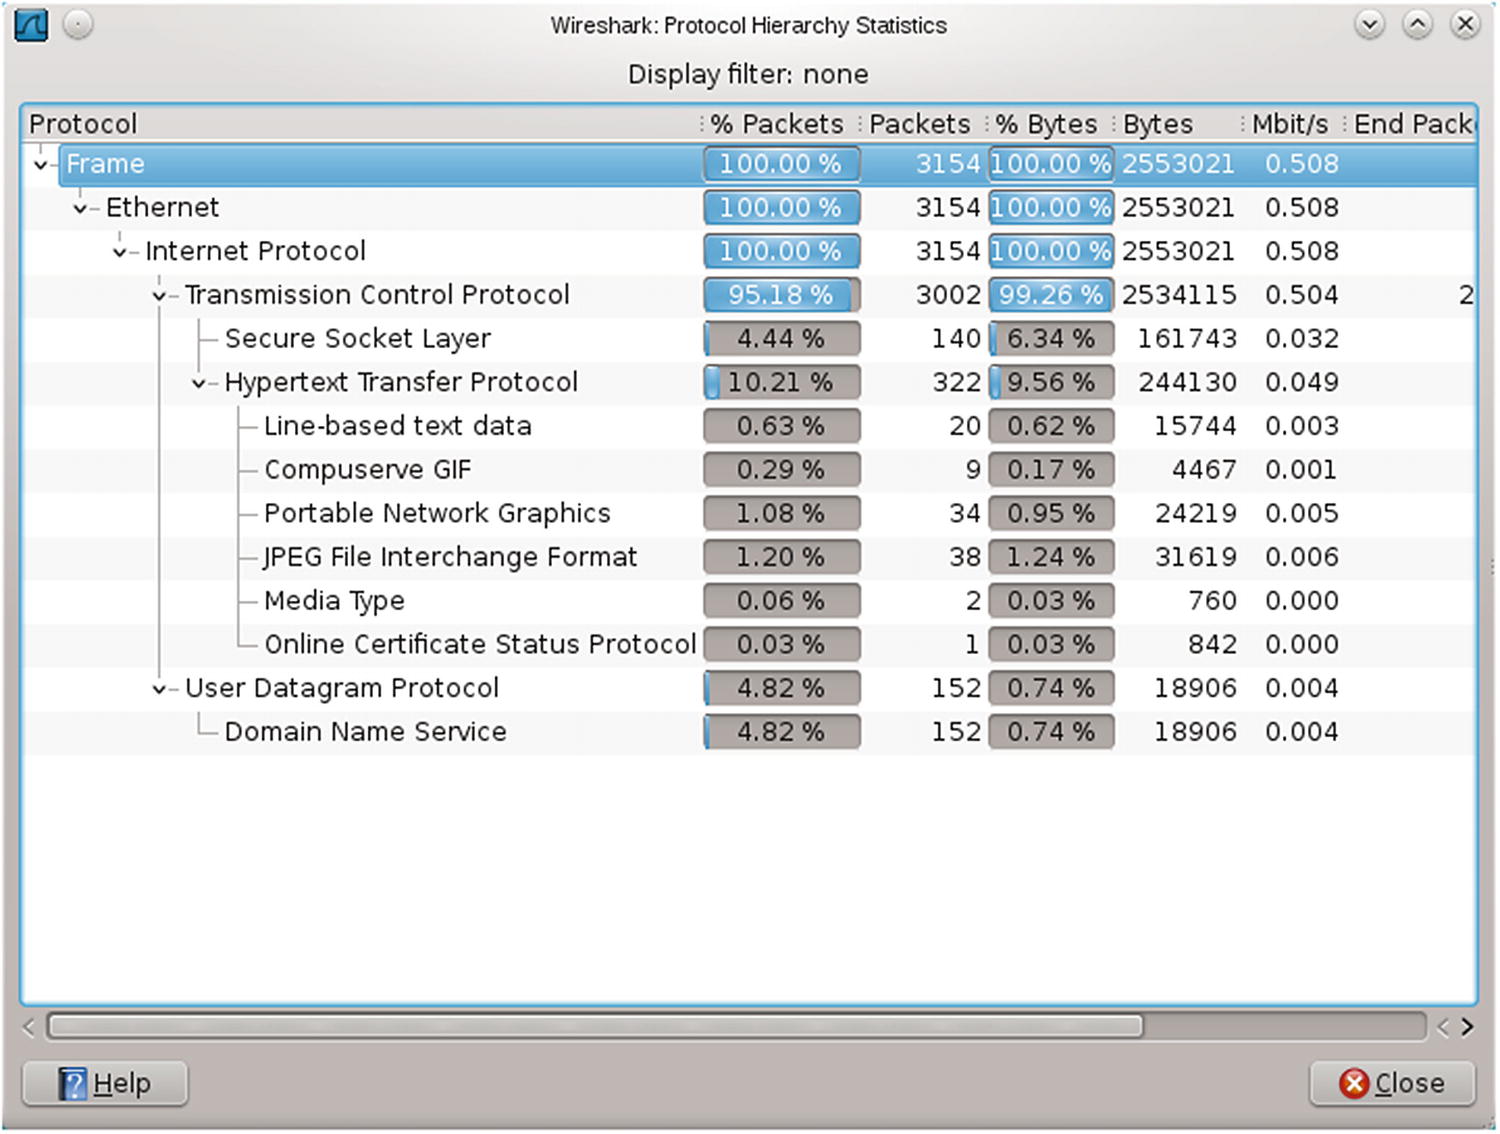
The Statistics entry in the main menu provides an entry point for tools that summarize the properties of the packet capture. For example, Protocol Hierarchy (Figure 3-8) breaks down the packets by type.
Figure 3-8
Protocol Hierarchy Statistics from Wireshark 1.4.6 on OpenSuSE 12.1
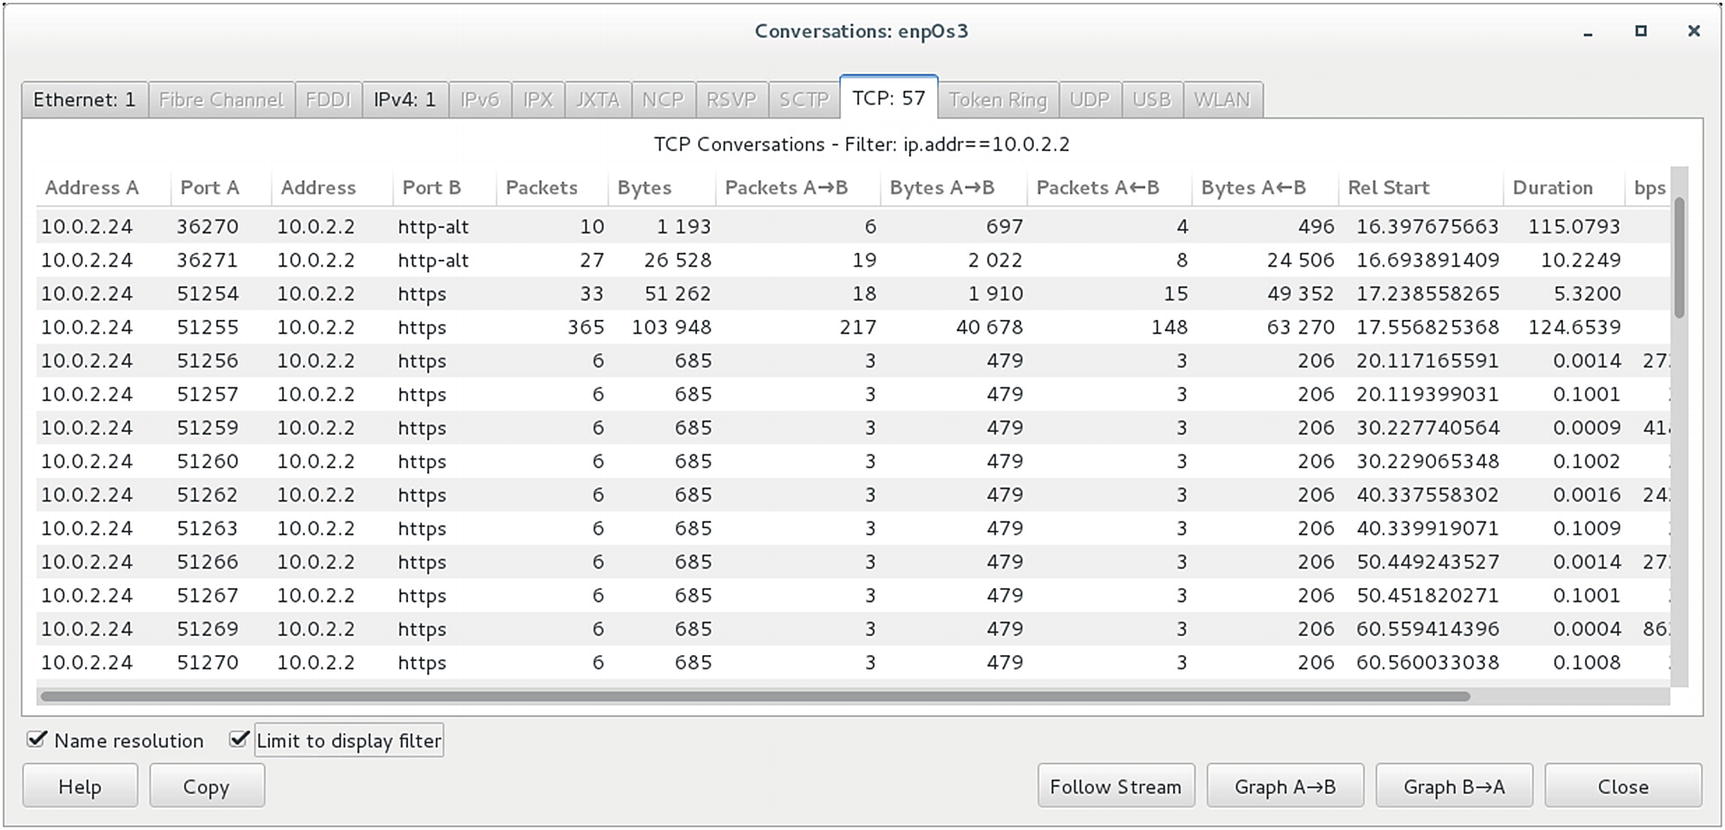
Wireshark collects packets into conversations that have the same endpoints. To view the TCP conversations, navigate the main menu through Statistics ➤ Conversation List ➤ TCP (IPv4 & IPv6) (Figure 3-9). The Follow Stream button shows the content of the conversation in a range of formats, including ASCII.
Figure 3-9
TCP Conversations from Wireshark 1.4.6 on OpenSuSE 12.1
This just scratches the surface of what can be done with Wireshark; see the Notes and References section for some excellent resources to learn more.
Detect: Java JAX-WS Remote Code Execution
Chapter 2 demonstrated how to attack a Mint 13 system running Firefox 12.0 and Java 7 Update 5 with the Java Applet JAX-WS Remote Code Execution attack. Set up a Kali offensive system and a Mint 13 target; also set up a Linux system running tcpdump to capture the packets sent between the attacker and the target. Run the attack using the Java Meterpreter payload running through a reverse HTTPS connecting back to the attacker on TCP/443. Use Meterpreter to interact with the victim system to ensure that some interesting network traffic is generated.
Open the resulting packet capture (Figure 3-10) in Wireshark and examine the list of conversations. One set of conversations goes from the victim to the attacker on TCP/8080 (http-alt); this is the request that spawned the attack. Second and far more numerous are conversations starting from the victim going to the attacker on TCP/443 (https); this is how the attacker interacts with the victim.
Figure 3-10
Conversations between attacker and victim of Java Applet JAX-WS Remote Code Execution Attack using Java Meterpreter through reverse HTTPS. Note the relative start times. Screenshot from Wireshark 1.10.14 on CentOS 7.3-1611.
Following the stream for the initial conversation shows that the attacker served a .jar file with an apparently randomly generated name.
GET /bob/ HTTP/1.1
Host: 10.0.2.2:8080
User-Agent: Mozilla/5.0 (X11; Ubuntu; Linux i686; rv:12.0) Gecko/20100101 Firefox/12.0
The conversations on TCP/443 are more difficult to understand. As expected, the content is encrypted, and following the stream provides no useful data.
Though the traffic is encrypted, the TLS handshake shows unusual behavior. Open the TLSv1 Server Hello packet and examine the data for the certificate’s issuer (Figure 3-11).
Figure 3-11
Examining the certificate issuer for the Java JAX-WS Remote Code Execution attack. Screenshot from Wireshark 1.10.14 on CentOS 7.3-1611.
In this example, the common name of the certificate issuer is “ytkrqnwt,” which appears random.
Considering the different HTTPS conversations together as a group, two facts stand out. The victim communicates with the attacker in bursts, each using a different source port. This explains why the connections were so difficult to notice during the host-based analysis. The timing of the connection attempts from the victim to the attacker is also suspicious. Examining the relative start time for the connections, they appear to go out from the victim roughly every 10 seconds (Figure 3-10).
Notes and References
The current runlevel of a Linux system can be found with the command runlevel.
One of the columns in the output from w command is the TTY for each user. There are physical devices, represented by ttyn for some number n; and slave pseudo-terminals, represented by pts/n for some number n. Although a tty was originally meant to refer to a single physical device, on modern Linux systems, the same physical hardware is usually bound to each available tty. Each time a new Bash shell is started, a new slave pseudo-terminal is created.
A user physically at a Linux system can change the tty that they use. If a graphical user interface is started, press CTRL+ALT+F8. Then to change to tty1 press ALT+F1, to change to tty2 press ALT+F2, and so on. For more information, read the manual page for console; the manual pages for tty and pts provide additional information.
On Windows, hit the F7 button at a command prompt to get a history of the commands run in a command prompt.
Windows servers open many ports for a wide range of services. Fortunately, Microsoft has a guide to the different ports and services available at http://support.microsoft.com/kb/832017.
Wireshark installation packages contain WinPcap, which is a (required) packet capture library for Windows. Older versions of Wireshark ship with older versions of WinPcap, and some are sufficiently old that they do not run on Windows 8 or later. It is possible to install WinPcap separately from Wireshark using versions that do run on Windows 8. WinPcap is available at http://www.winpcap.org/install/.