Chapter 9. Basic Debugging
The debugger is your friend. There is simply no tool more powerful than a debugger for learning C# and for writing quality C# programs. Put simply, the debugger is a tool that helps you understand what is really going on when your program is running. It is the x-ray of software development, allowing you to see inside programs and diagnose potential problems.
Without a debugger, you are guessing; with a debugger, you are seeing. It is as simple as that. Whatever time you invest in learning to use your debugger is time well spent.
The debugger is also a powerful tool for understanding code written by others. By putting someone else’s code into the debugger and stepping through it, you can see exactly how the methods work and what data they manipulate.
The Visual Studio debugger provides a number of windows for watching and interacting with your program while it executes. Getting comfortable with the debugger can make the difference between quickly finding bugs and struggling for hours or days.
Setting a Breakpoint
To get started with the debugger, return to Example 8-1. You’ll be putting
a breakpoint on the first line of
Main( ) to see how this code actually
works. A breakpoint is an instruction to the debugger to stop running.
You set a breakpoint, run the program, and the debugger runs the program
up until the breakpoint. Then you have the opportunity to examine the
value of your variables at this point in the execution. Examining your
program as it runs can help you untangle otherwise impenetrable
problems. It is common to set multiple breakpoints, which allows you to
skip through your program, examining the state of your object at
selected locations.
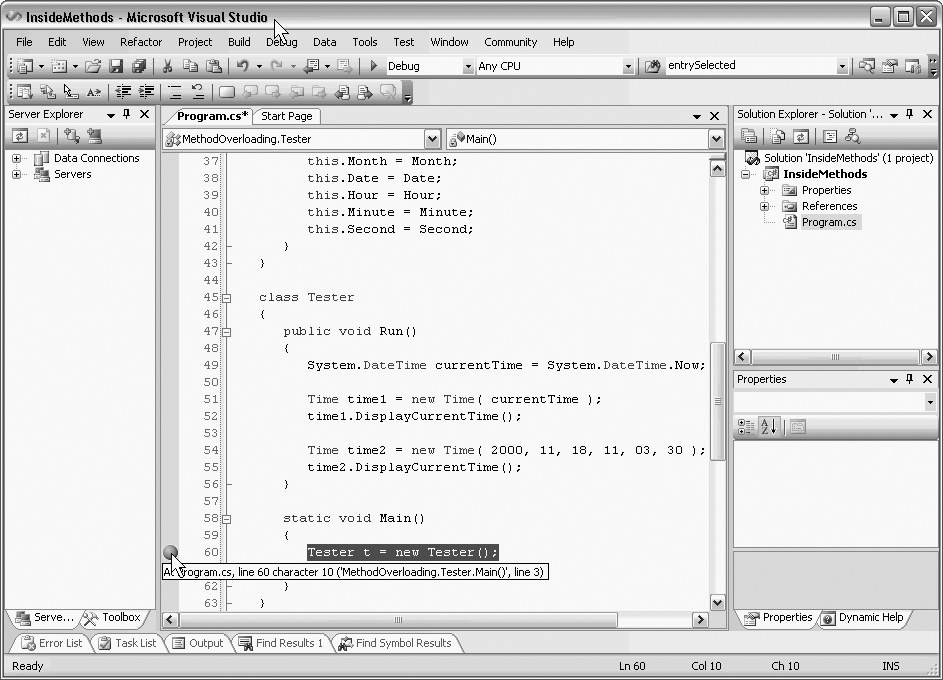
You can set a breakpoint in many different ways. The easiest is to click in the far-left margin. This causes a red dot to appear in the margin next to the relevant line of code, which is also highlighted in red, as shown in Figure 9-1. Notice that as you hover over the breakpoint, it tells you the line on which the breakpoint appears.
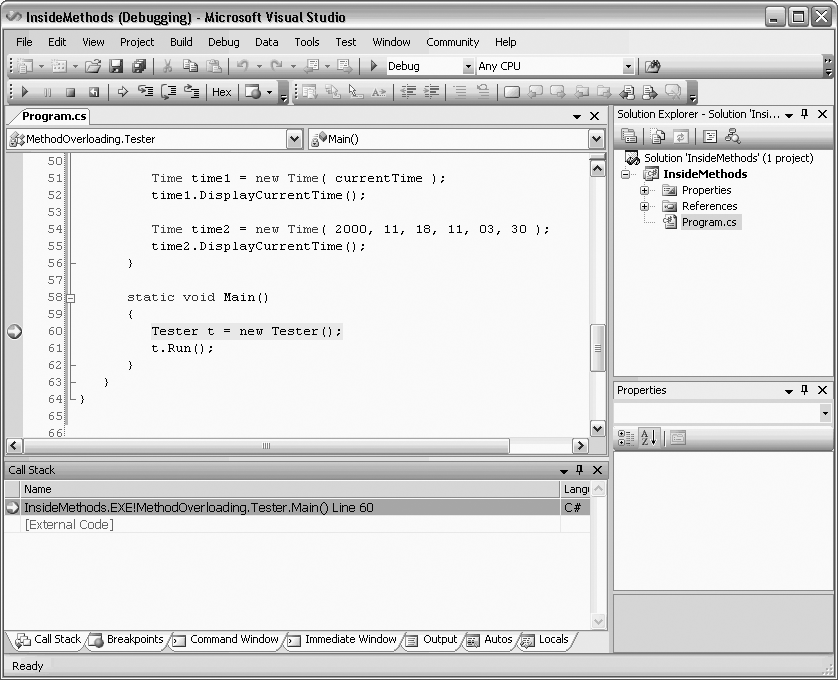
You are now ready to run the program to the breakpoint. To do so, you must be sure to run in debug mode, which you can do by clicking the Start button or by choosing the Start Debugging item from the Debug menu. In any case, the program starts and runs to the breakpoint, as shown in Figure 9-2.
The program stops just before executing the statement with the breakpoint, and that statement is highlighted. There are a number of helpful windows open as well, which we’ll examine in a moment.
The most useful feature of the debugger is the ability to
step into the code, or execute the program one line
at a time, watching the changes that happen with each line. To step into
the code, press the F11 function key twice. With the first keypress, the
Tester object is created. The second
keypress moves you to the next line in the code, which calls the
Run( ) method. Press the key once
more to step inside the code for the Run( ) method where the program assigns the
value of System.DateTime.Now to the
currentTime variable.
Tip
F11 and F10 are the step commands. The difference is that F10 steps over method calls, while F11 steps into them.
With F10, the methods are executed, but you don’t see each step within the method in the debugger; the highlighting jumps to the next statement after the method call. When you step into the method call with F11, on the other hand, the highlighting will move to the first line of the called method.
If you use F11 to step into a method you actually meant to step over, Shift-F11 will step you out. The method you stepped into will run to completion, and you’ll break on the first line back in the calling method.
Using the Debug Menu to Set Your Breakpoint
Instead of clicking in the margin to set your breakpoint, you can use the New Breakpoint item on the Debug menu (or use the keyboard shortcut for the menu item, Ctrl-D, N). This brings up the New Breakpoint dialog box , as shown in Figure 9-3. In this dialog box, you can specify the name of the method where you want to break, and even the line and character within the method, if you know it.

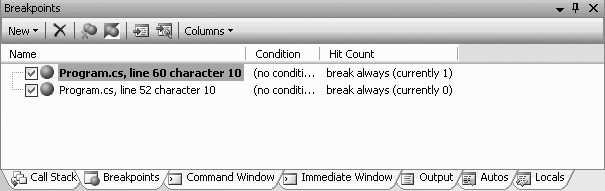
You can also examine and manipulate all the breakpoints together in the Breakpoints window, as shown in Figure 9-4.
Setting Conditions and Hit Counts
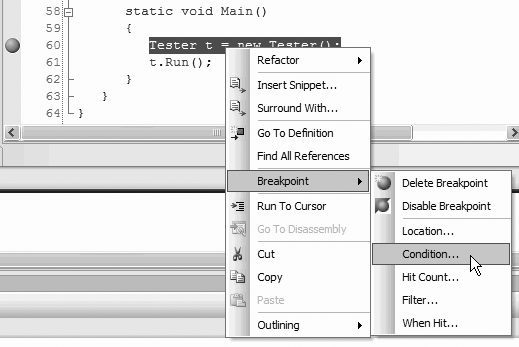
The default behavior is for the breakpoint to cause the program to break every time you pass that line of code. Sometimes you only want to break (for example) every 20th time it passes that line of code, or only if the value of some variable is greater than, for example, 0. You can set conditions on the breakpoint by right clicking on it in the Editor window or in the Breakpoints window, as shown in Figure 9-5.
Choose either Hit Count or Condition. If you choose Hit Count, you are offered variations such as “when the hit count is a multiple of ... ,” as shown in Figure 9-6.

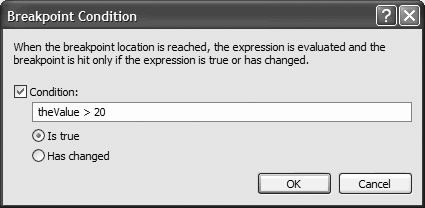
If you choose Condition, an open-ended condition text box is provided. In Figure 9-7, I have typed in the Value > 20 as an example.
Examining Values: The Autos and Locals Windows
Look at the tabs below the code window; you’ll find a Locals window and an Autos window . Both of these display your local variables. The difference is that the Autos window shows variables used in the current statement and the previous statement. (The current statement is the statement at the current execution location, which is highlighted automatically in the debugger—thus, the window’s name.) The Locals window displays all the variables in the current method, including parameters, as shown in Figure 9-8, along with each variable’s current value and type.
Tip
The debugger stacks the Autos and Locals windows together with other tabs, as shown in Figure 9-8. You are free to separate these windows or to move them to be tabbed with other windows. You can simply drag and drop the windows where you want them. When you drop one window on another, the two windows are tabbed together.
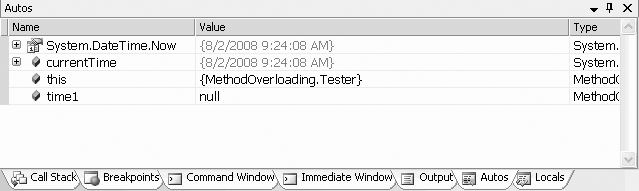
To see how this works, put a break point on the first line of the
Run( ) method and run the program.
When the program stops, click F10 to step over the creation of the new
DateTime object. The Autos window
shows you that the current time has been set to the current date, as
shown in Figure
9-9.
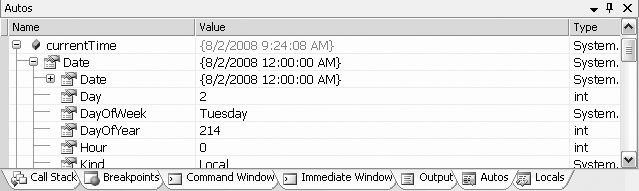
Because the value of currentTime has just been set, it is shown in
red. Notice the plus sign (+) next to the currentTime variable. This variable is of type
System.DateTime, which is a type with
many members. Expanding the plus sign reveals the state of this object,
as shown in Figure
9-10.
Press F11 again to step into the Time class constructor. When you
step into the Time constructor, the
Autos window changes to show you the new values, appropriate to the
current line of code.
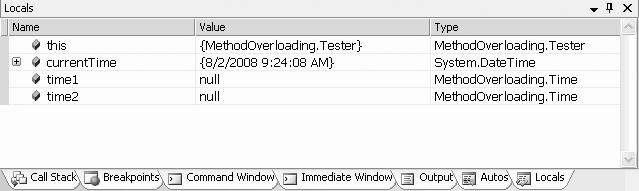
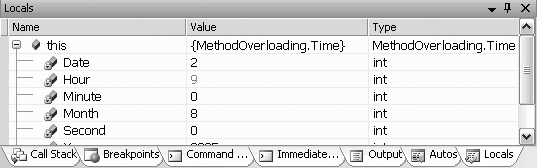
As mentioned earlier, the Locals window lets you look at all the
variables in the current method simultaneously. In this series of
examples, clicking on the Locals window reveals the local variables
dt (the parameter) and this (the current object). Expand the this variable, and you’ll see the Time object, with its members uninitialized.
Press F11 to progress through the assignment of values to the member
variables of the Time class. As you hit the F11 key, the update is
reflected in the Locals window, as shown in Figure 9-11.
Explore the Locals and Autos windows as you step through the program. When you want to stop, choose the Stop debugging item from the Debug menu to stop processing and return to the editor.
Set Your Watch
When you’re debugging a program with many local variables, you usually don’t want to watch all of them; you only need to keep track of a few. You can track specific variables and objects in the Watch window . You can have up to four Watch windows at a time. Watch windows are like by-invitation versions of the Locals window; they list the objects you ask the debugger to keep an eye on, and you can see their values change as you step through the program, as illustrated in Figure 9-12.

The Watch windows are usually tabbed with the Locals window. You can create more than one Watch window to organize the variables you keep an eye on, by selecting Watch 1 through Watch 4 from the Debug menu. You can add a watch by right-clicking on a variable and choosing Add Watch, or just drag the variable to the Watch window. The variable will be added to your Watch window. To remove a variable that you’ve added to your Watch window, right click on it in the Watch list, and select Delete.
If you just need to peek at a variable, and perhaps to experiment with manipulating its value, you can right-click on it and choose QuickWatch , which opens a dialog box with watch information about a single object, as shown in Figure 9-13.
You can enter any expression into the Expression field and
evaluate it from within the QuickWatch window. For example, suppose you
had integer variables named varOne
and varTwo:
    int varOne = 5;
    int varTwo = 7;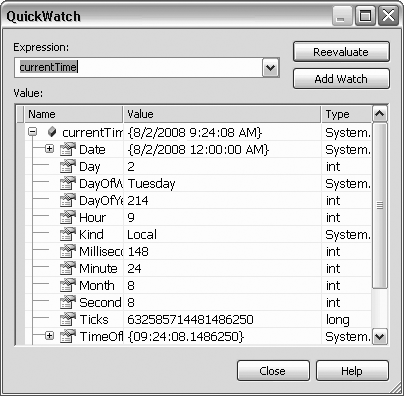
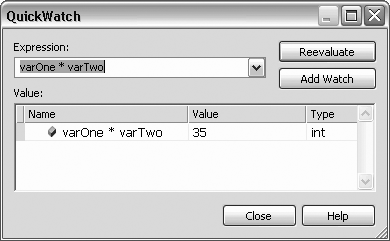
If you want to know the impact of multiplying them, enter:
varOne * varTwo
into the Expression window and click Recalculate. The value is shown in the Value window, as in Figure 9-14.
If you decide that you want to add the variable to a Watch window after all, click the Add Watch button.
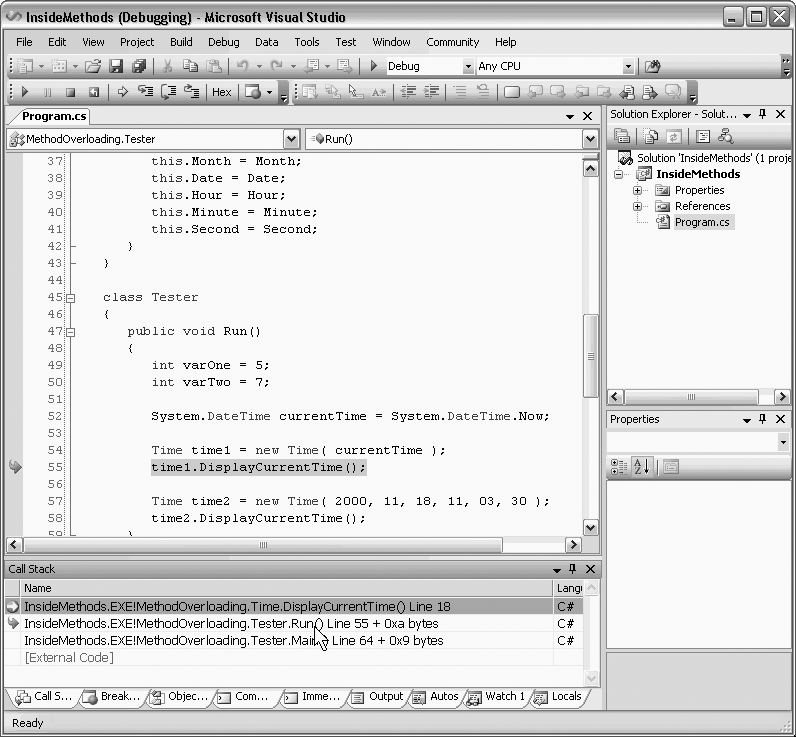
The Call Stack
As you step in and out of methods, the Call Stack
window keeps track of the order and hierarchy of method
calls . Figure
9-15 shows a close-up picture of the Call Stack window. You can
see that the Time constructor was
called by the Run( ) method, while
the Run( ) method was in turn called
by Main( ).
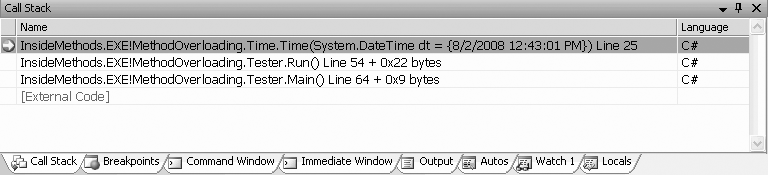
In this case, if you double-click on the second line in the Call
Stack window, the debugger shows you the line in Run( ) that called the Time constructor, as shown in Figure 9-16. Notice that the
debugger puts a curved arrow on the line in the call stack you’ve
double-clicked on, and a matching arrow in the editor to the line that
corresponds to that call. This way, if you’re debugging a method, and
you think that the data causing the problem came from outside the
method, you can quickly find where the method call came from, and check
the values at that point.
Summary
Visual Studio 2005 includes a powerful debugger that lets you step through your program and examine the value of variables and objects as methods execute.
You can set breakpoints in your code, which causes execution to stop when it reaches that point. Break points can be set to stop every time, every nth time, or when a particular condition is true.
Press F11 to step into called methods, and F10 to skip over method calls.
The Autos window displays the values of the variables used in the current statement and the previous statement. The Locals window shows the values of all the variables in the current method.
The Watch window allows you to keep an eye on variables or objects as your method executes, revealing not only their value, but with complex objects allowing you to “drill down” into their internal state.
The QuickWatch window displays information about a single object, and allows you to manipulate that object without changing the value of the object in the running program.
The Call Stack window shows you the method that called your currently executing method, and the method that invoked that method, and so forth, so that you can see how you arrived at the currently executing method.
Quiz
- Question 9–1.
What is the easiest way to set a breakpoint?
- Question 9–2.
How do you step over or into a method?
- Question 9–3.
How can you disable breakpoints, and set conditions on breakpoints?
- Question 9–4.
What is the difference between the Locals window and the Autos window?
- Question 9–5.
What is the easiest way to set a watch on a variable?
- Question 9–6.
How do you open a QuickWatch window?
- Question 9–7.
What does the call stack show and why is it useful?
Exercises
- Exercise 9-1.
You’ll use the following program for this exercise. Either type it into Visual Studio, or copy it from this book’s web site. Note that this is spaghetti code—you’d never write method calls like this, but that’s why this is the debugging chapter.
    using System;

    namespace Debugging
    {

        class Tester
        {
            public void Run( )
            {

                int myInt = 42;
                float myFloat = 9.685f;

                System.Console.WriteLine("Before staring: \n value of myInt: {0} \n
                value of myFloat: {1}", myInt, myFloat);

                // pass the variables by reference
                Multiply( ref myInt, ref myFloat );

                System.Console.WriteLine("After finishing: \n value of myInt: {0} \n
                value of myFloat: {1}", myInt, myFloat);

            }

            private static void Multiply (ref int theInt, ref float theFloat)
            {
                theInt = theInt * 2;
                theFloat = theFloat *2;

                Divide( ref theInt, ref theFloat);
            }

            private static void Divide (ref int theInt, ref float theFloat)
            {
                theInt = theInt / 3;
                theFloat = theFloat / 3;

                Add(ref theInt, ref theFloat);
            }

            public static void Add(ref int theInt, ref float theFloat)
            {
                theInt = theInt + theInt;
                theFloat = theFloat + theFloat;
            }

            static void Main( )
            {
                Tester t = new Tester( );
                t.Run( );
            }
        }
    }
Place a breakpoint in
Run( )on the following line:System.Console.WriteLine("Before staring: \n value of myInt: {0} \n value of myFloat: {1}", myInt, myFloat);Step into the
Multiply( )method, up to the call toDivide( ). What are the values oftheIntandtheFloatat this point?Run the program again, and when it reaches the breakpoint in
Run( ), set a watch onmyInt. Step through the methods. When does the value ofmyIntchange?Set another breakpoint in
Add( )at this line:theInt = theInt + theInt;
Run the program. How many calls are in the call stack when the program reaches this breakpoint?
- Exercise 9-2.
The program in this exercise is similar to the first, but it has a logic error. Type this program into Visual Studio, or download it from this book’s web site.
    using System;

    namespace Debugging
    {

        class Tester
        {
            public void Run( )
            {

                int myInt = 42;
                float myFloat = 9.685f;

                System.Console.WriteLine("Before staring: \n value of myInt: {0} \n
                value of myFloat: {1}", myInt, myFloat);

                // pass the variables by reference
                Multiply( ref myInt, ref myFloat );

                System.Console.WriteLine("After finishing: \n value of myInt: {0} \n
                value of myFloat: {1}", myInt, myFloat);

            }

            private static void Multiply (ref int theInt, ref float theFloat)
            {
                theInt = theInt * 2;
                theFloat = theFloat *2;
                Divide( ref theInt, ref theFloat);
            }

            private static void Divide (ref int theInt, ref float theFloat)
            {
                theInt = theInt * 3;
                theFloat = theFloat * 3;
                Add(ref theInt, ref theFloat);
            }

            public static void Add(ref int theInt, ref float theFloat)
            {
                theInt = theInt - theInt;
                theFloat = theFloat - theFloat;
            }

            static void Main( )
            {
                Tester t = new Tester( );
                t.Run( );
            }
        }
    }
If you run this program, you will not get the same results as you did in the previous example. Use the debugging tools you just learned about to find the error. Correct the error, and then run the program again to see if the results are correct.