
“The fight is won or lost far away from witnesses–behind the lines, in the gym and out there on the road, long before I dance under those lights.”
—Muhammad Ali
“Know yourself, know your enemy, and you shall win a hundred battles without loss.”
—Sun Tzu, The Art of War

I love the expression “punching above your weight.” It means fighting enemies that are much larger and better resourced. The ability to fight and win against larger opponents requires not only thorough preparation, but also an obligation to really understand your enemy before engaging in an attack.
The best way to do this is to put aside your own beliefs and assumptions and put on your competitor's “hat.” Adopt the perspective of the competitive brand as your brand, and answer each of the following questions:
This exercise will explain the value of using a competitive blueprint to understand your competition. If you want to understand exactly how a building is constructed, you analyze the building's structural blueprint. When it comes to your competitor, you can do the same thing by using this simple framework to “unpack” a brand's “Competitive Blueprint” (see Figure 3.1).
Figure 3.1. Competitive Blueprint framework.
The following three sections are meant to give you a more granular understanding of your competition. Answer them by putting yourself in their shoes.
Brand Strategy
Company Structure
I am a big fan of scrappy, ninja-style, guerrilla research. A lot of good work can be performed very quickly on your own, and at a fraction of what a full-service agency will charge. Even if you decide to use an agency, I have found that you can often reduce the scope and cost of custom research just by doing some of your own prework.
The following list of ninja research techniques is not all encompassing, but it does include many popular ways to uncover insights on your own.
Competitive websites often publish digital brochures that contain descriptions of their products and services and provide a broad overview of the local landscape. Online industry magazines and communities also publish lots of relevant information regarding product performance and trends.
Depending on the market you are trying to enter, you may be able to purchase existing research reports from companies such as Mintel and Euro-monitor who collect and then summarize data that has broad appeal. These “off-the-shelf” reports provide macro-level category reviews along with industry trends and key issues that the industry faces as a whole.
Conducting intercept interviews with consumers is a great way to learn more about your target. It's easy to recruit respondents near the point of purchase (e.g., in front of cafes, on the street, and in shopping malls). Additionally, you can gain valuable insights by arranging informational interviews with industry professionals. Make sure you ask permission to video record your interviews. Verbatim clips of real consumers and distributors can provide powerful support for your internal presentations.
One of my favorite marketing activities is participating in local market immersions. Like a cultural anthropologist, you get to immerse yourself into the consumer environment and watch how real end-users interact with various brands. Whether you visit restaurants, grocery stores, or fashion boutiques, you can cover large sections of a city in a single day. Make sure to take lots of pictures and videos of what you see. You will be able to use this content later when you develop your positioning boards and tell your brand story to others.
Today, there are many cloud-based survey tools that you can choose from to help you generate insights. Companies like SurveyMonkey make it easy to quickly create a questionnaire and field it using their online panel of respondents. Many online survey companies now have global partners to support international research projects.
Apple uses lean, ninja-style research techniques to quickly understand and adapt to emerging consumer needs.
Steve Jobs once said that Apple did not do market research and followed it up by saying that it didn't hire consultants either. Although that may have been true, Apple certainly uses marketing research now to help make better decisions. In fact, Apple has become very adept at using lean research techniques to gain insights about what consumers want and how they feel about Apple products.
As all Apple users know, an Apple ID is required to access products like iCloud, iTunes, and the App Store, which allows the company to collect data to “see” purchasing behavior. Apple uses its Customer Relationship Management (CRM) system to send surveys to customers that gauge satisfaction and help Apple develop better products (see Figure 3.2). While discussing these surveys, Greg Joswiak, the VP of product marketing for Apple, said, “The surveys reveal, country-by-country, what is driving our customers to buy Apple's iPhone products versus other products such as the Android products that Samsung sells, what features they most use, our customers' demographics and their level of satisfaction with different aspects of iPhone.”1
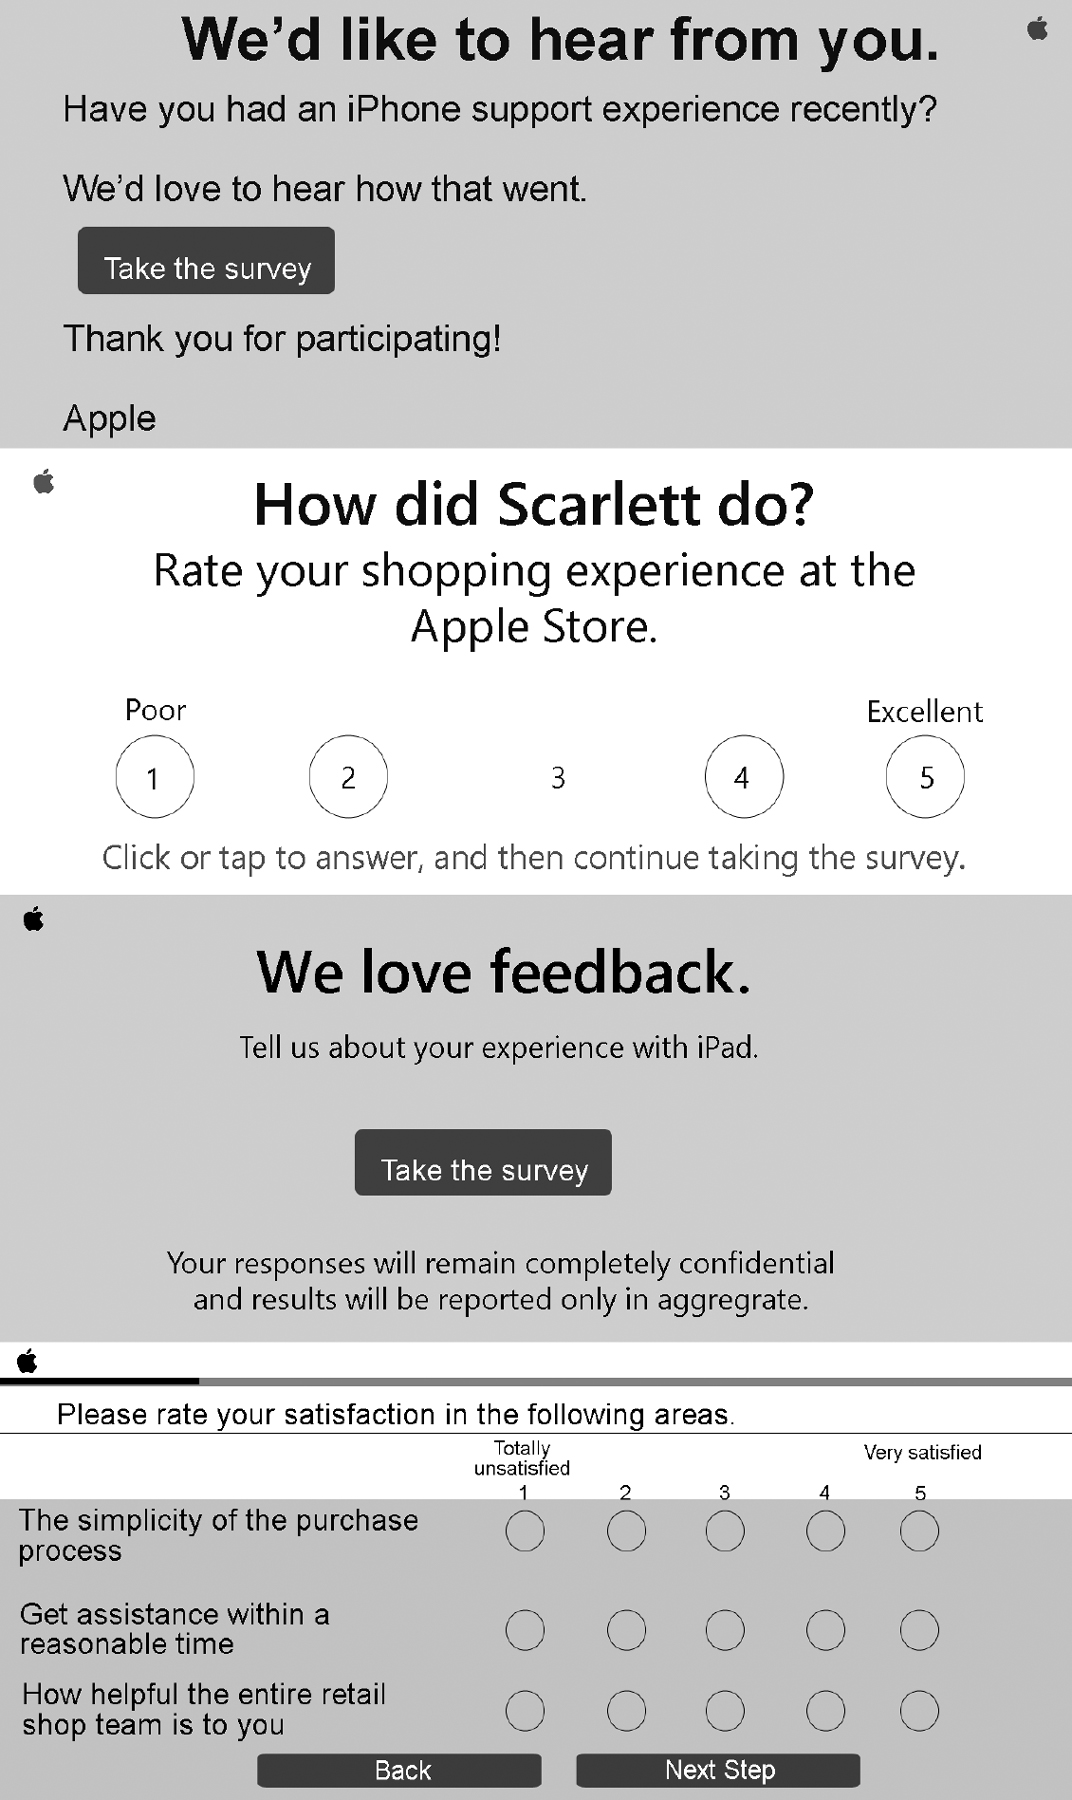
Figure 3.2. Apple online survey invitations and requests for consumer feedback. Photo credit: Amy Hsu
Another way Apple uses research is watching consumers as they shop. With its new store designs, Apple intentionally created community-gathering spaces where consumers feel free to play with products.2 Apple merchandises products to optimize this kind of interaction. Additionally, the company offers lots of educational sessions, workshops, and product demonstrations that provide opportunities to listen and learn from its consumers. Today, 64 percent of the store headcount is service focused, dedicated to answering questions and educating customers (see Figures 3.3 and 3.4).3

Figure 3.3. People shopping inside an Apple store in Shanghai, China. Photo credit: Siempreverde22 | Dreamstime
Figure 3.4. Product merchandising inside an Apple store in Hong Kong. Photo credit: Tea|Dreamstime
Angela Ahrendts, senior vice president for Apple Retail, wrote about the company's free training sessions offered in Apple stores called Today at Apple. These sessions are open to everyone and focus on topics ranging from computer basics to creative passions. In a letter addressed to her team, Ahrendts wrote, “We'll start collecting this type of feedback from everyone who attends a Today at Apple session. We'll focus both on their immediate experience and on their perceptions about the long-term value. We want to be as rigorous in measuring our human impact as we are in every other part of our business.”4
Mondelēz uses lean research techniques to quickly test advertising and make adjustments to maximize sales.
Mondelēz is a multinational food company operating in 165 different countries around the world. Some of the company's most famous brands include Oreo, Nabisco, and Cadbury.
In Brazil, Mondelēz conducted lean research to help launch its new apple and cinnamon belVita breakfast biscuit. In order to create and test content quickly, Mondelēz chose YouTube as the primary communication medium for introducing the brand. Using Google Brand Lift analytics allowed Mondelēz to get a very quick read on its initial ad and make rapid improvements.
Google found that retention dropped considerably after only five seconds of viewing the first version of the ad. Using a short online questionnaire and Google search data, Mondelēz was able to make improvements that increased recall by 57 percent and brand awareness by 26 percent compared to the original version.5
Before too long, stakeholders will ask you to estimate the size and growth potential of any new business. Figuring out the “size of prize” is one of the first things you need to do when entering a new market. If the opportunity is large enough, you will most likely get approval to spend resources to position and launch your brand.
However, like a ninja warrior without a big army, you probably will not have enough data to make you feel completely comfortable. If the current size of the market is not large enough to warrant having a large research agency like Nielsen or TNS collect and publish syndicated data, you will need to get creative and comfortable extrapolating estimates from the facts that you are able to gather.
When working with scarce data to estimate the “size of the prize,” the margin of error can be unacceptably high. A good way to help validate the accuracy of your estimate is to “triangulate” (see Figure 3.5).
Triangulation is a fairly simple technique that is easily mastered and can help estimate the size of an opportunity. It works by using calculations derived from three different perspectives and then reconciles any differences to arrive at a “reasonable” approximation for the “size of prize.”
Figure 3.5. Triangulation framework.
The following are the three approaches that I use most often when applying this method. Each approach starts at a different point to arrive at an estimate.
In the standard supply chain sequence, product is produced at the manufacturer, and then moves through distribution before finally arriving at an end-user for consumption (see Figure 3.6).
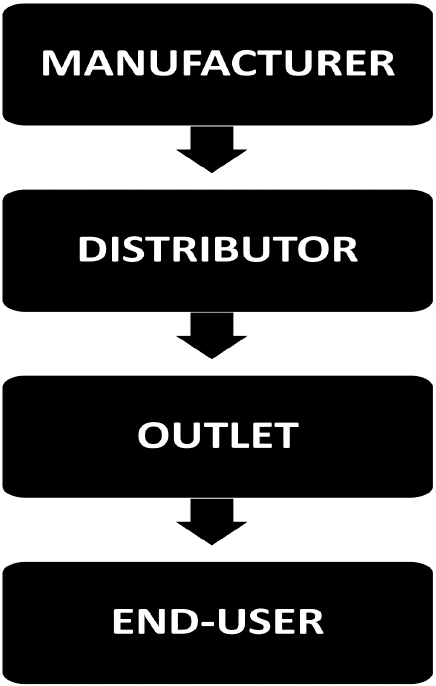
Figure 3.6. Standard supply chain sequence.
A Bottom-up approach begins by estimating the number of end-users in your target market, after which you assign a sales rate (trial and repeat) per user to predict a total demand (see Figure 3.7).
Estimate the number of end-users from general to specific. First, approximate the size of a general population that includes your target. For example, you could start by searching for the number of households or families living in a geographic location. Government census bureaus and cross-national organizations like the World Bank and the United Nations regularly publish this kind of data and it can be easily found online for free.
Next, cut the large general population down to a smaller, specific subset that represents the actual target. For example, after you determine the number of households in a city, you could then look at the percentage of above-average income households with children living in that city. If your target is defined by demographic or geographic data, you should be able to use the same data sources mentioned previously.
If your target is defined by purchase behavior, try using a proxy as a substitute. A proxy is a company that sells a product or service to the same target market that you are pursuing. For example, if you want to sell nutritious beverages to children, you could search for a proxy that sells nutritious kid snacks instead.
Use desk research to find data published about the proxy in annual reports and industry articles. You might have to back into some of your numbers. For example, you can estimate the number of consumers a brand has by simply taking annual sales and dividing by an estimate of how much an average consumer buys each year. Once you approximate the size of your target market, you can make an educated guess regarding potential trial and repeat rates for your brand to arrive at your “bottom-up” volume estimate.
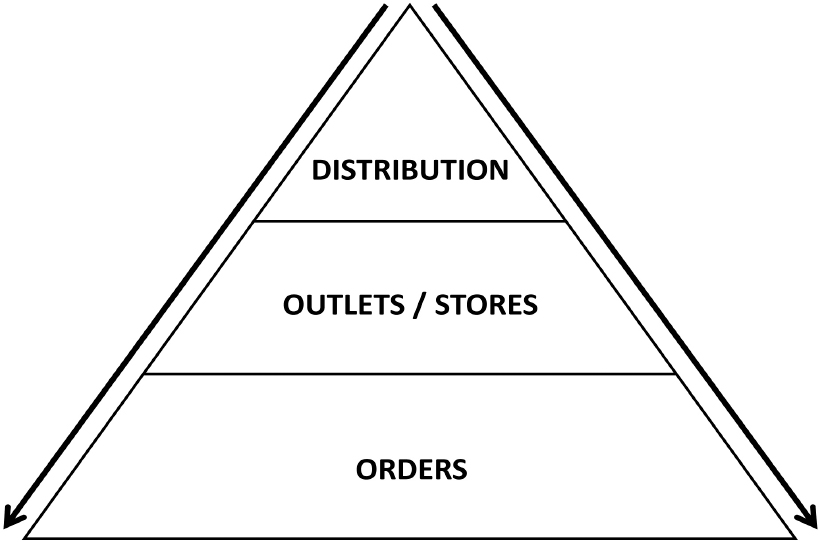
The top-down approach begins at the distributor level and moves down the supply chain sequence to arrive at an opportunity size. The first step is predicting how many distributors you expect to carry your brand. Then, estimate how much product each distributor can reasonably sell. A great way to obtain distributor information without investing in expensive research is to conduct your own informational interviews with professionals who have extensive knowledge about the market and industry you are trying to enter.
When you feel comfortable with your estimated number of distributors who will sell your brand, you can approximate the number of stores an average distributor covers. Then, assign a reasonable sales volume estimate per outlet to determine your “top-down” projection (see Figure 3.8).
The fair share approach starts in the middle by estimating or obtaining a competitor's market share or sales volume and then uses that figure to extrapolate out to the size of the category and your potential “fair” share.
High-level sales and growth figures can be found in annual reports and industry articles. A scrappy method for estimating competitive market share is to conduct your own small-scale store audits. Randomly select stores that serve your target market. During store visits, take note of which competitors are being sold and ask store employees to tell you how the various brands are performing. Which brands are the most popular? How many units do they sell each day?
You should also study previous launches in the industry. When you know how other new brands performed in the past, it provides a good “sanity” check. When you feel good about your estimate of the competitor's market share, you can then make some reasonable assumptions regarding the total market size and your brand's “fair share” (see Figure 3.9).
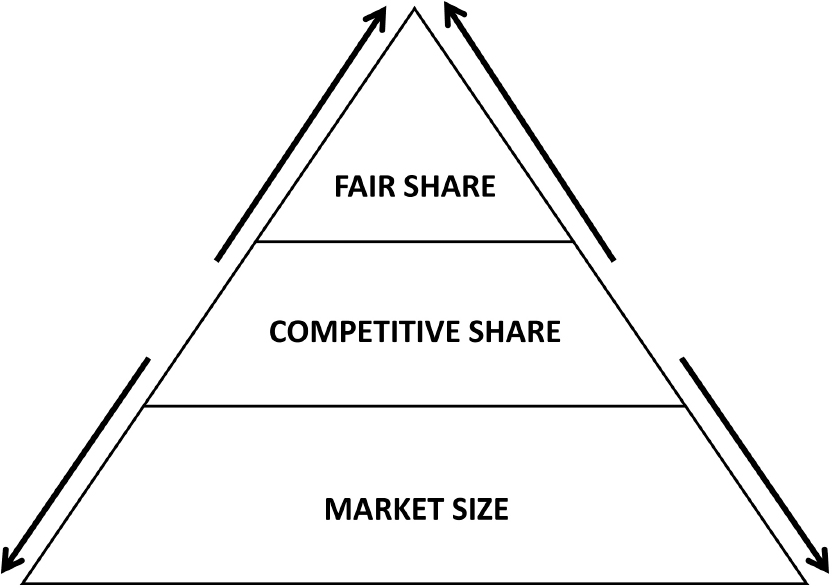
Figure 3.9. Fair Share method.
Beyond calculating the size of the prize, stakeholders and investors want to understand the growth potential for your brand. When you are comfortable with the accuracy of your base volume (size of prize) estimate, you can then apply an annual growth rate to forecast sales out across subsequent years.
A helpful technique for conceptualizing changes in sales volume from one year to the next is the Sales Deconstruction method. Start by pulling out each component or “building block” that makes up your sales growth. Then analyze each factor's contribution separately before reassembling the pieces back together to build a comprehensive forecast (see Figure 3.10). This process will also help determine if your plan will not deliver your intended results, which gives you an opportunity to isolate volume building blocks to make corrections to the plan.
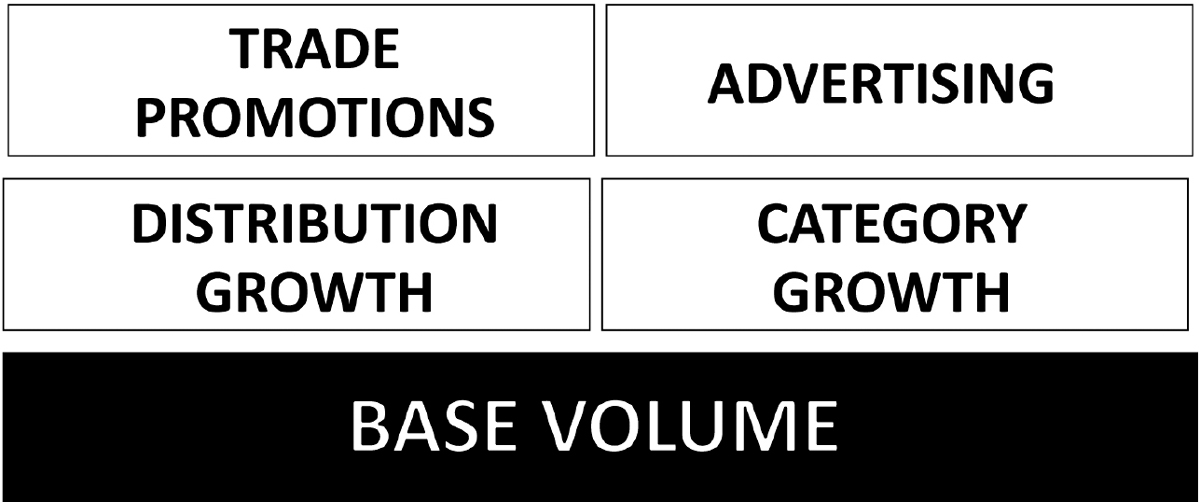
Figure 3.10. Sales Deconstruction method.