5

Intangibles, Investment, Productivity, and Secular Stagnation
This chapter looks at the role of intangibles in secular stagnation, the puzzling fall in investment and productivity growth seen in major economies in recent years. We argue that the increasing importance of intangible investment may have an important role to play in this troubling phenomenon.
One of the most troubling and widely talked about trends in economics at the moment is secular stagnation: the fact that business investment is stubbornly low despite every indication that it shouldn’t be. There have been a variety of explanations put forward for what is wrong with business investment, from the failings of monetary policy to a slowdown in technological progress.
This chapter is the first of our chapters discussing the consequences of the rise in intangible investment. We will argue that at least part of the reason for the secular stagnation puzzle is the shift in the balance of business investment toward intangibles. Furthermore, we shall make that argument on the basis of the four characteristics of intangibles we pointed out in chapter 4. Because (a) intangibles can be scaled, leading firms break away from laggards, and because (b) they are unmeasured, measured productivity and profitability look high. And because they spillover when the pace of intangible investment slows, as it did after the Great Recession, productivity slows down as reduced intangible growth throws off fewer spillovers.
Secular Stagnation: The Symptoms
Before we look at the link between secular stagnation and intangible investment, it is worth reviewing what secular stagnation actually consists of. Secular stagnation is characterized by a number of symptoms.
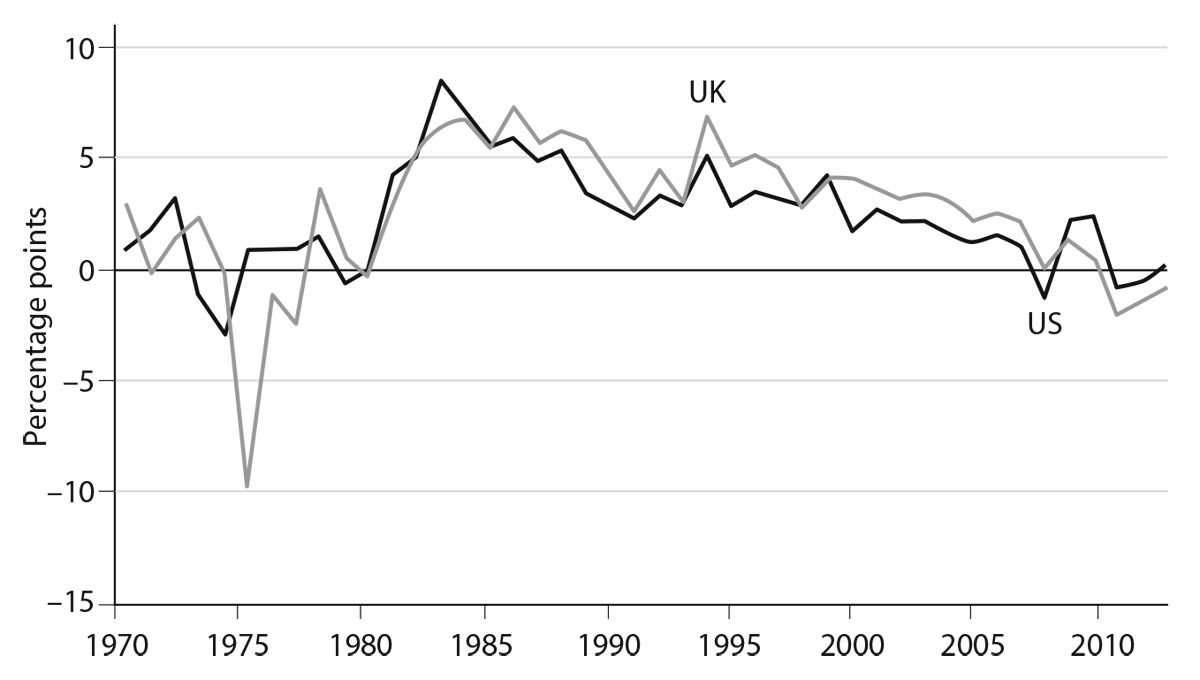
The first is low investment. As figure 5.1 shows, for the United States and the UK, investment fell in the 1970s, recovered somewhat in the mid-1980s, and then fell precipitously in the financial crisis. Since then it has not recovered.
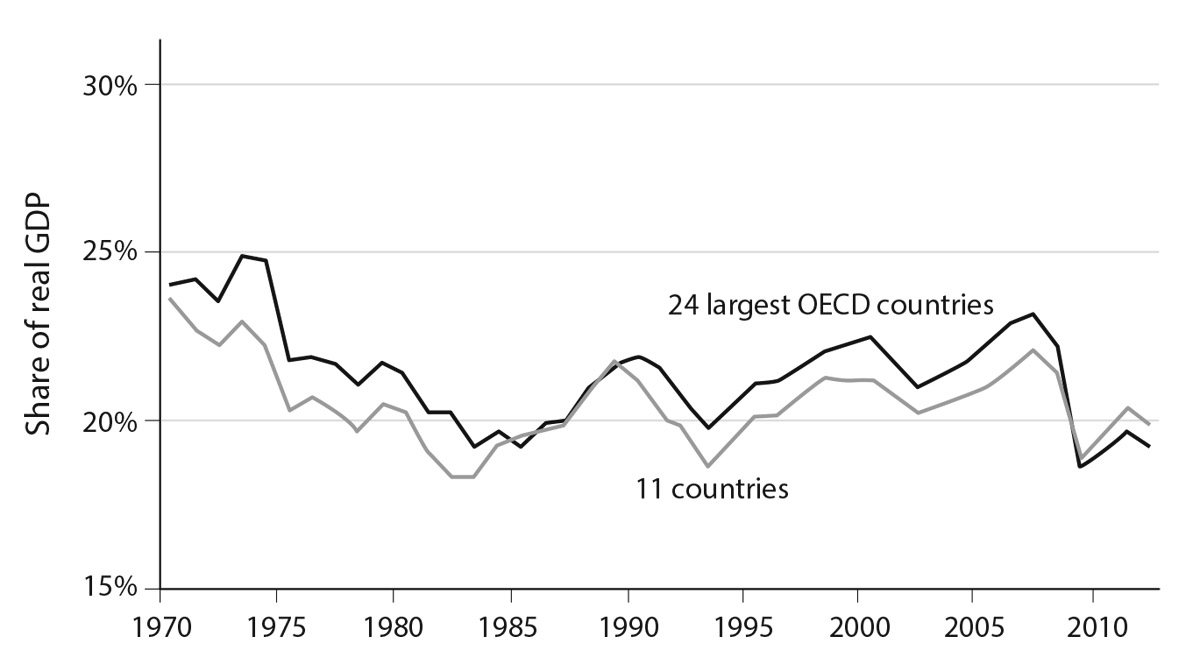
Now, this would not be so surprising were it not for the second symptom: low interest rates. As figure 5.2 shows, long-run real interest rates have been declining since the mid-1980s and have been particularly low since the financial crisis. But there has been no recovery in investment since then, even though the costs of making such investments are very low.
The coincidence of low investment and low interest rates is a puzzle for economists. Once upon a time, central bankers thought they understood what to do about low investment. When businesses got nervous about the future, as they did from time to time, and reduced investment, central banks would respond by lowering their base interest rate, making money cheaper. Cheap money made it less costly for businesses to raise financing and for consumers to borrow. So businesses and consumers borrowed and investment and consumption went back up.
But this tactic seems to have stopped working. For central bankers this is the equivalent of being a captain headed for a rocky shoal and finding that your wheel will no longer turn the ship. This coincidence of very cheap borrowing and the apparent unwillingness of businesses to invest was what Larry Summers was talking about when he popularized the term “secular stagnation” in a 2013 lecture to the IMF.1
One immediate explanation for this weird mix of cheap money and low investment is simply that the demand for investment has fallen. In his 2011 bestseller The Great Stagnation, economist Tyler Cowen suggested that developed countries might have exhausted easy sources of good investments, such as settling new land or getting children to spend more years in education. Most memorably, he argued that technological progress might have slowed down, or, more specifically, that the economic benefit of new discoveries was less than had been the case in the past. The economist and economic historian Robert Gordon developed this theme in his influential 2016 book The Rise and Fall of American Growth, in which he argued that the inventions over the twentieth century, such as electricity, indoor plumbing, and the like, were part of “one big wave of innovation” that will not be repeated.
This explanation for secular stagnation has proved controversial, not least because it turns out to be very difficult to measure whether technological progress has slowed down. A totally out-of-the-blue technological slowdown that is not easy to confirm using data has seemed to some too much of a deus ex machina, and many of those interested in secular stagnation have looked around for other causes.
And then there are three further symptoms associated with current-day secular stagnation, all of which demand explanation.
The first is the fact that corporate profits in the United States and elsewhere are, on average, higher than they have been for decades and seem to be steadily increasing. Far from being under pressure, firms’ profits have never looked better. Some measures of these are shown in figure 5.3.2 The most directly comparable measure is average return on capital (figure 5.3B), which has grown sharply since the 1990s; it certainly does not suggest an Age of Lead, where investment has fallen because there is nothing worth investing in.
At first glance, this does not seem to be compatible with the idea that there are few good investment opportunities out there; on the contrary, if profits are high, one would expect businesses to be tempted to invest more to take advantage of cheap money to invest in all the attractive business opportunities that are driving high returns.
The second curious fact is that when it comes to profitability, businesses are not equal—and more to the point, they are becoming increasingly unequal. As figure 5.3C shows, profits for firms at the top are booming. It doesn’t look like investment opportunities have fallen away for firms at the top. This has led to a lively debate around whether competition—which we would normally expect to level the playing field between leading firms and laggards as the leaders’ profit margins regress to the mean and the laggards go out of business—has fallen.
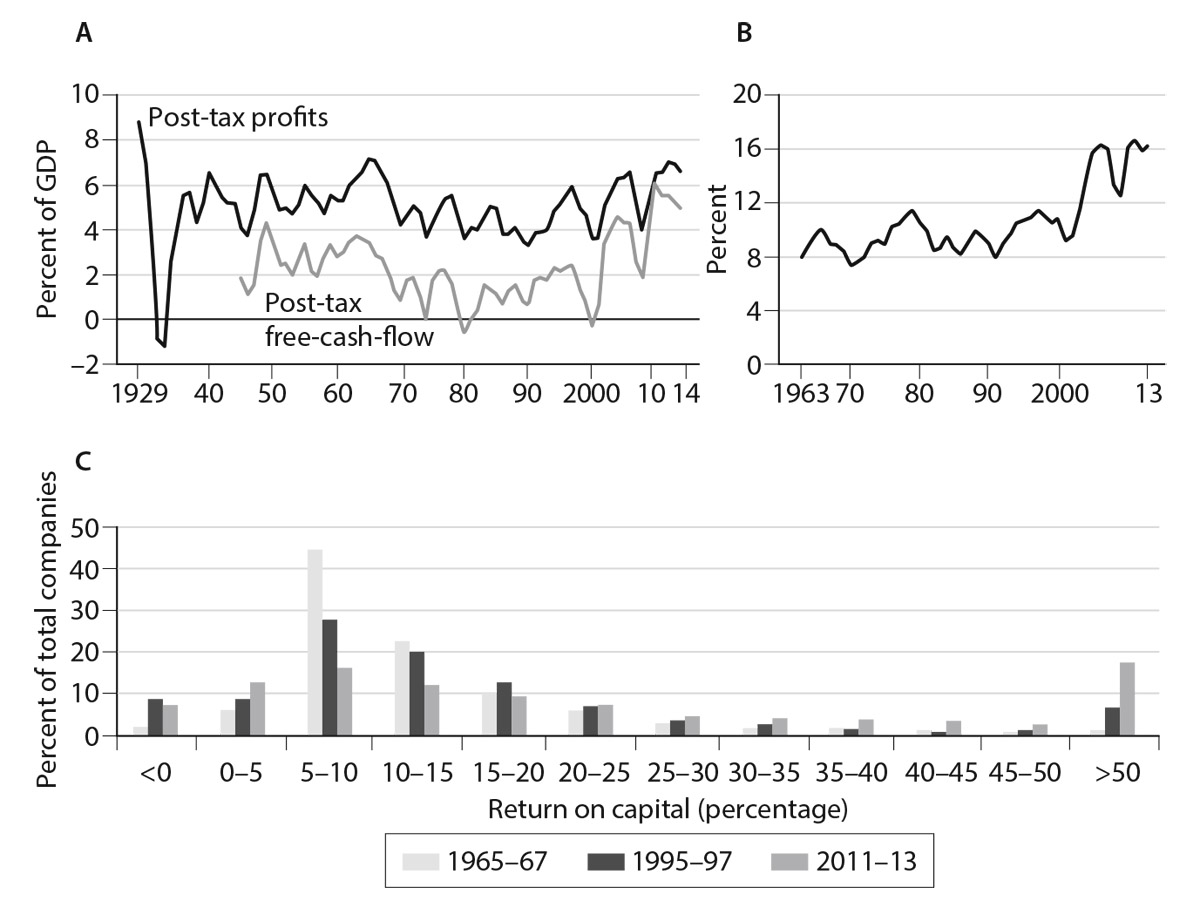
Figure 5.3. Measures of profits and profit spreads. A: US domestic corporate profits. B: US companies’ global return on capital (excluding goodwill). C: Distribution of profits among US companies. Source: Economist, March 2016, https://www.economist.com/news/briefing/21695385-profits-are-too-high-america-needs-giant-dose-competition-too-much-good-thing.
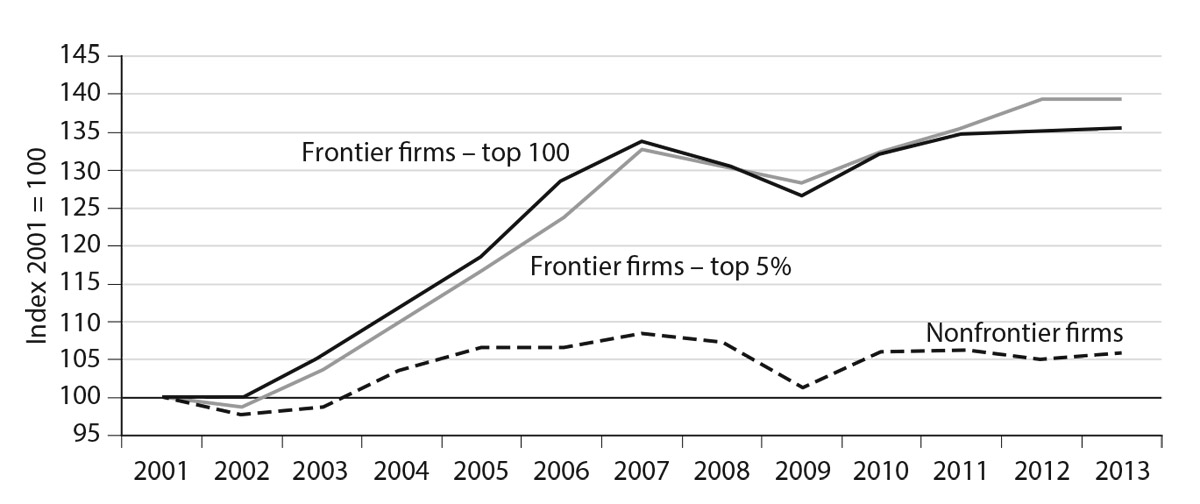
Figure 5.4. Labor productivity spreads. Data are value added per worker. “Frontier” are 100 or 5 percent globally most productive firms in each two-digit manufacturing or business services industry for a twenty-four-country sample from Orbis database. Source: Andrews, Criscuolo and Gal (2016), quoted in OECD, Economic Outlook, 2016, http://www.oecd.org/eco/outlook/OECD-Economic-Outlook-June-2016-promoting-productivity-and-equality.pdf.
The picture for profits looks similar to that for productivity. Figure 5.4 shows the results of an influential research project by Dan Andrews, Chiara Criscuolo, and Peter Gal of the OECD, who looked at how the productivity gap between the top firms in different industries and their competitors was developing, using accounting data from the OECD-ORBIS database. Of course, there has always been a gap—some firms have always done better than others—but that gap seems to have widened considerably, starting before the financial crisis.
The final fact surrounding secular stagnation is that the sustained decrease in productivity growth that we have seen in developed countries does not seem to be driven solely by lower investment. Labor productivity growth (see box 5.1 for a fuller explanation of labor productivity, profitability, and total factor productivity) can fall for two broad reasons. It can fall because investment falls, thus giving workers less capital to work with. Or it can fall because workers are working less effectively with whatever capital they have; this is called a fall in “multi-factor” or “total factor” productivity (TFP). Now, since the financial crisis, investment has fallen, but not by enough to account for all the loss in labor productivity. In fact, the bulk of the slowdown in productivity growth has been a decline in total factor productivity. Figure 5.5 shows, since about the mid-2000s, a fall in OECD multi-factor productivity growth.
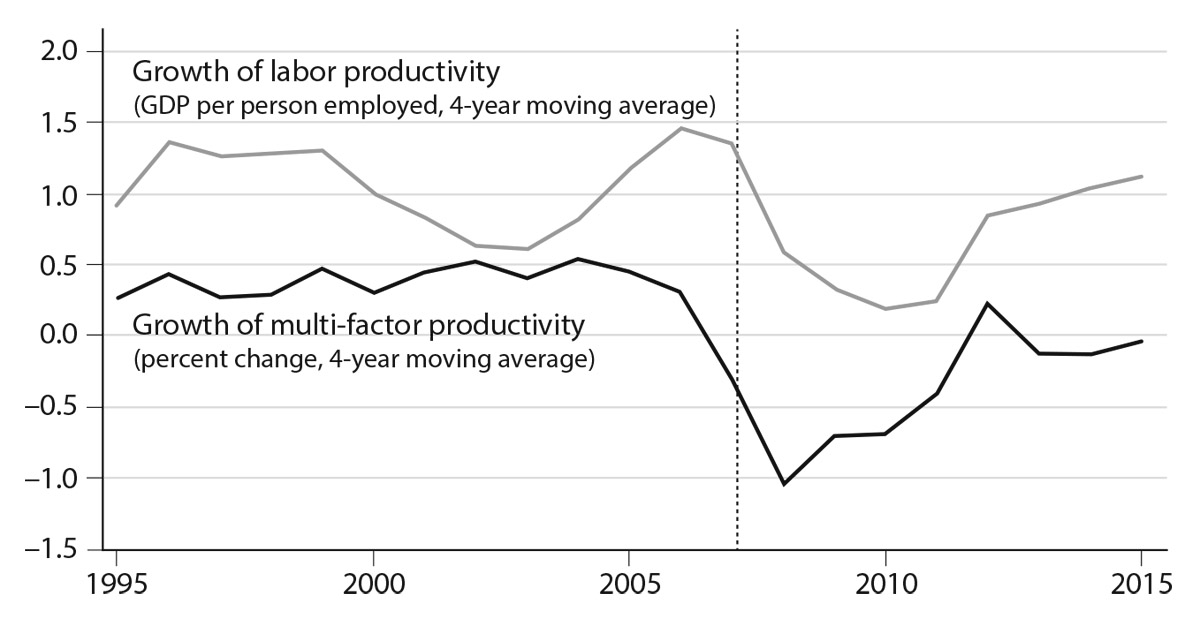
Box 5.1. Productivity and Profitability Explained
Productivity is “real” output per unit of input. Behind this seemingly innocuous definition lies a host of productivity measures and difficult conceptual issues, so it’s worth reviewing some of them.
Let’s start with explaining what we mean by “real” output. Take the UK railways. In 2010 there were 1.35 billion passenger journeys, with an average distance of 40 kilometers per journey. Thus UK rail companies provided 54.1 billion passenger kilometers (that is, the number of passengers times the average distance each passenger travelled). In 2015 that figure was 64.1 billion passenger kilometers. (If you were wondering why UK railways are so crowded, the 1986 figure was 30 billion, less than half that.)
How much did passengers pay? In 2010 they paid, on average, 12.2 pence per kilometer, rising to 14.4 pence per kilometer in 2015. So passenger revenues (passenger kilometers multiplied by price paid per passenger kilometer) went up by 6.8 percent per annum (from a revenue of £6.62bn in 2010 to £9.2bn in 2015).
It is clear, however, that the revenues went up for two reasons: (a) rail companies carried more passengers more kilometers, and (b) they charged passengers more. If you use the data above, you find out that the 6.8 percent rise in revenue was accounted for by a rise of 3.5 percent in passenger kilometers and 3.3 percent in fares.
So what’s the right output measure for productivity purposes: passenger kilometers or revenues? Productivity analysts prefer to strip out the rise in prices, to get the change in volumes of output rather than its price. They do this since they are interested in the “productive efficiency” of the firm, that is, how readily it can convert input into output. The extent to which a firm can charge high or low prices is interesting, but it’s the domain of profitability analysts, not productivity ones. See below.
This is where the notion of “real” output comes in. Statisticians call the revenue from output “nominal” output (that is, price times volume), but stripping out price changes (so you have only volume) is called “real” output. In this case then, the rise in “nominal” output was 6.8 percent, due to a rise in “real” output of 3.5 percent and a rise in prices of 3.3 percent.
This highlights a difference between productivity and profitability. Productivity compares output to input, and uses real output. Profitability compares output to costs, both being nominal measures. So if a firm raises its prices but does nothing else, its profitability has risen, but its productivity has remained the same. That’s why productivity is often linked to efficiency: in this example, the efficiency of the firm has not changed at all. Indeed, it is perfectly possible for a firm to have very low productivity (or be very inefficient), but be highly profitable, as long as it has sufficient pricing power. And consumers know this; this is after all their complaint against most monopolies. Even though profitability is a perfectly interesting subject, it is a combination of both productivity and pricing power. Most productivity analysts confine themselves to productivity, especially since it’s perfectly possible that productivity and profitability are negatively correlated.
Returning to our main theme, let’s look at the measure of input. The rail network requires a host of inputs to produce the output: the trains, the track, the staff, the fuel, etc. So let’s define two productivity measures. Single-factor productivity is real output per single unit. Multi-factor productivity (MFP) (confusingly, sometimes called “total factor productivity” [TFP]) is real output per multiple inputs. An example might help.
Consider agriculture (Pardey, Alston, and Chan-Kang 2013). Between 1961 and 2009, world population rose from 3 billion to 6.8 billion, a rise of 127 percent. How was everyone fed? In 1961 the world produced US$746bn worth of agricultural output and, controlling for inflation, that had risen to US$2,260bn in 2009, a rise in real output of 203 percent, far outpacing the rise in population. Now, it’s easy to increase food output: you just bring more land under cultivation. Did that happen? No. In 1961 the world had 4.46 billion hectares under cultivation and in 2009 that had only slightly risen to 4.89 billion hectares, a rise of 10 percent. Thus world agricultural single-factor productivity—that is, real output per hectare—rose, remarkably, by 176 percent. Other measures of single-factor productivity rose too. Agricultural labor rose by 70 percent, as more people worked on the land (from 1.5 billion to 2.6 billion), but real output rose even faster, so real output per agricultural worker rose by 78 percent.
What about multi-factor productivity growth? Here analysts tend to choose the number of inputs they enter (the “multi” bit) depending somewhat on the industry and the output they are comparing. Consider then agriculture, where the real output is tons of produce. The typical inputs to a farm would be (a) land, (b) labor: the number of people working on the farm, (c) capital: machines used on the farm, and (d) intermediates: inputs used up in production, for example, seed, fertilizer, feed for animals, etc. Now, it’s perfectly possible that agricultural output went up because of more land, more labor, farmers using more tractors, or maybe better fertilizer. Thus multi-factor productivity in this case is real output per unit of land, labor, capital, and intermediates (we’ll explain how to combine these inputs in a moment). If then there is growth in farm output over and above that accounted for by all these inputs, then the inputs themselves are being better utilized. Thus multi-factor productivity growth measures not how many more inputs the farm is using, but rather how well the farm is combining the inputs.
Multi-factor productivity growth is then a very useful indicator for (at least) two reasons. First, it helps better understand single-factor productivity growth. If output per worker or per hectare has risen, then we naturally want to understand whether this is because those workers had more tractors (capital) and/or more fertilizer (intermediates) to work with.
Second, multi-factor productivity growth helps us understand where growth is coming from. Suppose the economy consists of farms and tractor manufacturers. Suppose a farmer claims productivity (output per laborer) on the farm has doubled. If the farmer has only brought in more tractors (not changing other inputs), then multi-factor productivity growth will have stayed the same and any productivity growth in the economy as a whole will be due to improvements in the tractor industry. If the farmer has improved the efficiency of operations, maybe innovated in crop rotation or improved work practices on the farm, then multi-factor productivity growth in farming will have risen. As a matter of fact, researchers have found that world agricultural multi-factor productivity growth is about 45 percent of productivity growth over this long period. That is, improved machines and fertilizer account for about 55 percent of productivity growth and better farming practices 45 percent of it. Those improved farming practices are particularly concentrated in the reorganization of collective farms in the ex–Soviet Union and China.
A few final points. First, in most industries or services, land is not typically a varying input, so analysis of single-factor productivity tends to be real output per worker. Second, the input of workers can vary by person and the hours they work, so single-factor productivity analysts looking at labor productivity often work with output per worker, or output per worker-hour. Third, in calculating multi-factor productivity growth, inputs are combined using their payment shares in total costs, so a very labor-intensive process would give labor a high weight and capital a low weight (the economic rationale for this is set out in Solow 1957). These payment-share combined inputs are called input services, so for example, capital services are combined inputs of capital assets like ICT, buildings, and vehicles, weighted by their payments.
Finally, many statistical agencies calculate real output in two ways, including intermediates, called real gross output (number of tons of wheat, say), and excluding intermediates, called real value added (wheat output excluding the intermediates). Thus gross output MFP is typically real gross output per input of labor, capital, and intermediates, and value added MFP is real value added per input of labor and capital. (The former turns out to be a [complicated] weighted average of the latter, the weights called Domar-Hulten weighting, after two brilliant papers that derived them by Evesy Domar and Charles Hulten [Domar 1961; Hulten 1978].)
An Intangible Explanation
A good explanation for secular stagnation should ideally explain the following four facts:
1. A fall in measured investment at the same time as a fall in interest rates
2. Strong profits
3. Increasingly unequal productivity and profits
4. Weak total factor productivity growth
Can intangibles explain any of this? The rest of this chapter suggests it might have some part to play, for the following reasons.
First, in the earlier chapters of this book we presented evidence that the nature of investments that businesses are making is shifting from tangibles to intangibles, that in several developed countries intangible investments now dominate, and that these intangible investments are poorly measured in national accounts. Maybe then, at least in part, investment seems low because we are not measuring all the investment that is being made.
Second, in chapter 4 we also saw that intangibles had particular economic properties. One was the ability of firms to scale intangibles over their operations. Maybe then firms are investing in intangibles and scaling up their sales: think Uber, Google, and Microsoft. They can achieve this giant scale with relatively little employment. So their productivity (revenue per employee) rises, perhaps massively. And since they have relatively little tangible capital, which is what is measured, their revenue per unit of capital employed also rises massively. The successful firms that achieve great scale, therefore, become leaders, breaking away from the laggards in the industry that haven’t managed to scale up as much (at least not at the moment).
Third, another property of intangibles is spillovers. A firm cannot use its rivals’ factories but can potentially use its rivals’ designs, organization structure, or ideas. This has two implications. On the one hand, if firms reduce their investment in intangibles, we might expect fewer spillovers to be generated. Since spillovers are picked up in TFP growth, we would expect TFP to fall. The second issue is that, in a world where it is harder for a given firm to be sure it will appropriate the benefits of its investments, it may choose to invest less.
We’ll go through these possibilities one by one.
Mismeasurement: Intangibles and Apparently Low Investment
As we saw in chapter 2, intangible investment in countries like the United States and the UK now exceeds tangible investment. Much of it is not included in national accounts—and, therefore, is not included in the figures used to demonstrate secular stagnation. So does investment seem low because we are simply not counting it right? Or to put it another way, could the world’s economy be growing much faster than we thought because we’ve been failing to include the value of investment in intangibles?
The effect of counting these investments on the investment/GDP ratio depends on a number of things. First, it depends on the extent to which national statistical offices are counting intangibles. As we saw in chapter 3, statistical offices are increasingly counting the intangible assets set out in table 3.1. Second, when we include new investment in national accounts we also raise GDP, so the effect on the investment/GDP ratio is potentially ambiguous.
As figure 5.6 shows, it turns out that the effect of including previously unmeasured intangibles is to raise the investment/GDP ratio, but not to greatly affect its trend, partly because of the effects above and the relatively short time period. So the undercount does not appear to greatly affect the trend, at least not since the Great Recession. (The undercount in investment also affects growth of GDP and might potentially mean GDP appears to be growing more slowly. In the appendix we show this is not, in fact, a big effect.)
Profits and Productivity Differences: Scale, Spillovers,
and the Incentives to Invest
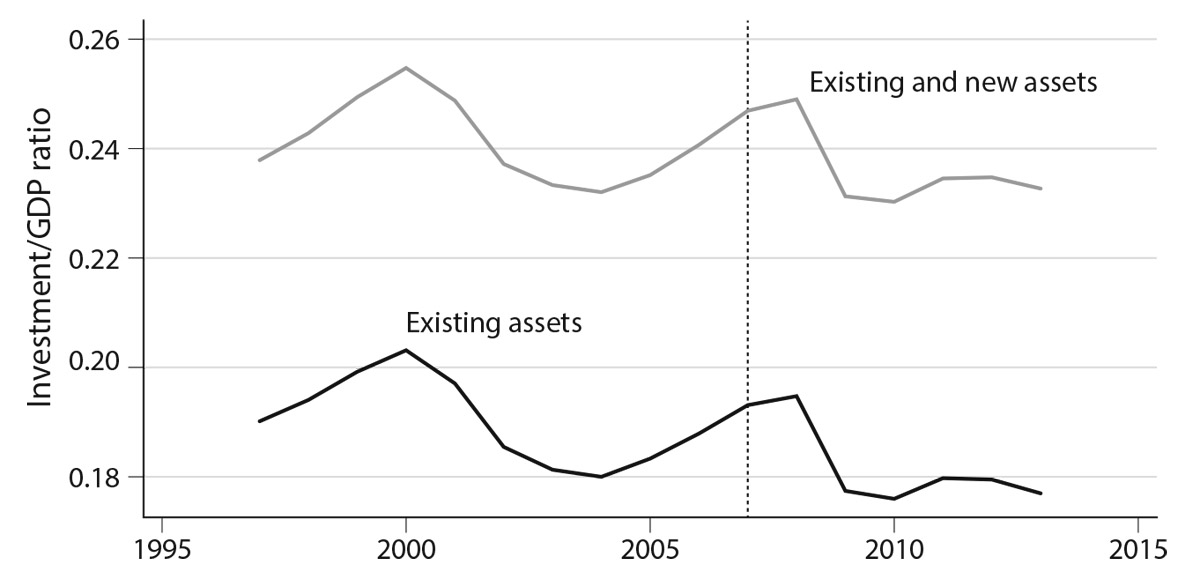
Figure 5.6. Investment/GDP ratios with and without new intangibles for eleven European Union countries and the United States. Data are whole-economy; GDP is adjusted to include or exclude new assets investment. Source: authors’ calculations based on the INTAN-Invest database (www.intan-invest.net).
The effect of intangibles on investment goes beyond issues of measurement. As we saw in chapter 4, intangible investments are unusual in a number of ways. It seems plausible that these unusual characteristics could have an effect on businesses’ incentives to invest. Of particular relevance here is the fact that intangibles are scalable and exhibit spillovers. (A scalable asset, like Uber’s software or Starbucks’s brand, can be scaled across a very large number of locations. Firms that are good at exploiting spillovers—for example, because they are good at open innovation—can benefit not only from their own intangible investments but also from those of other firms. Think of how Apple learned to develop the iPhone from the failures of early smartphone makers like Nokia and Ericsson and from decades of government research.)
Scalability increases the appeal of intangible investment. If a firm has confidence it can scale an investment across a large volume of business, the incentive to invest increases. If a firm genuinely believes its latest project could be the next Google PageRank or the next blockbuster drug, it would be justified in betting the farm on it because the returns on these sorts of scalable intangible investments are so high.
We would expect the presence of spillovers to reduce the willingness of the average firm to invest. Consider the case study of EMI and the CT scanner we discussed in chapter 4. Most firms would be very wary of following in the footsteps of EMI, investing millions in a radical new product only to see competitors walk away with the gains (and indeed EMI themselves might not have made the decision to invest in the CT scanner had they not received considerable government R&D subsidies to do so).
Spillovers may discourage the average firm from investing in intangibles, but of course, not all firms are average. As we discussed in chapter 4, the benefits of intangibles do not spill over entirely at random. Indeed, management gurus have studied the art of appropriating the spillovers of other firms’ investments and have even given it a name: open innovation. Like any art, some are better at open innovation than others. A glance at the business news reveals that some companies have a reputation for being especially good at absorbing and exploiting good ideas from elsewhere. (An extreme example is Rocket Internet, a German incubator of e-commerce businesses, which systematically identifies good online ideas and executes them faster and better than their originators.)
These characteristics affect firm performance: firms that can create and manipulate intangibles can reap outsize benefits. In a world where intangible investment is very important, we would expect to see the “best” firms—that is, those firms that (a) own valuable scalable intangibles and (b) are good at exacting the spillovers from other businesses—being highly productive and profitable, and their competitors losing out.
Now, as we saw in figure 5.4, the gap between the most and least productive firms is widening. One popular explanation for this is that perhaps competition policy is becoming weaker, allowing powerful incumbents to protect their market position. But it’s not clear that there has been any sort of worldwide weakening of competition policy; indeed, most governments seem to take competition policy quite seriously. So might it be that scalability and spillovers have created the possibility for leading firms to pull away from their competition and entrench their advantages?
The idea that intangible-rich firms are scaling up dramatically seems plausible on an anecdotal basis: Uber, Google, Microsoft, and so on. To really nail it down, we would need to collect intangible investment data for each firm and see how that data correlates with inequality of profitability. But accounting conventions don’t let us do this yet (see chapter 10). In the meantime, we can look at the industry level, where we do have data. Now, if firms are taking advantage of intangibles, then they will be best placed to do so in industries where intangibles are important. For example, public water and sewerage utilities could potentially scale up using intangibles, but there’s probably much less scope for doing so than in intangible-intensive industries like pharmaceuticals or financial services. Thus we would expect larger rises in the productivity spread in industries and countries that are more intangible-intensive. Figure 5.7 tests this out.
Figure 5.7 shows the relationship between the change in the productivity spread (the gap in productivity between the best and worst firms), averaged from 2001–7 (we stopped before the financial crisis years) and intangible intensity in 2001. The panels show manufacturing and marketing services, respectively. So, for example, in manufacturing, Italy and Austria don’t invest very much in intangibles and have had only a small rise in the manufacturing productivity spread. By contrast, the UK, Sweden, and France do invest a lot in intangibles and have had a much larger rise in the productivity spread. The same goes for services.
What about profits? We do not have direct data on profits, but if we are willing to use R&D and/or patents as a proxy for intangibles, there is more evidence that supports this view of productivity spread. The economists Bronwyn Hall, Adam Jaffe, and Manuel Trajtenberg (2005) collected financial and R&D data on a panel of US firms and linked this data with their patents and how heavily cited the patents were. They found strong correlations, controlling for a range of other factors, between the stock market value of a firm and its R&D spending and its well-cited patents. Stock market values may not be the best measure of company prospects, but this does suggest a link between company performance and (one dimension of) intangibles, which is consistent with the idea that an intangible-heavy firm can outperform its rivals.3
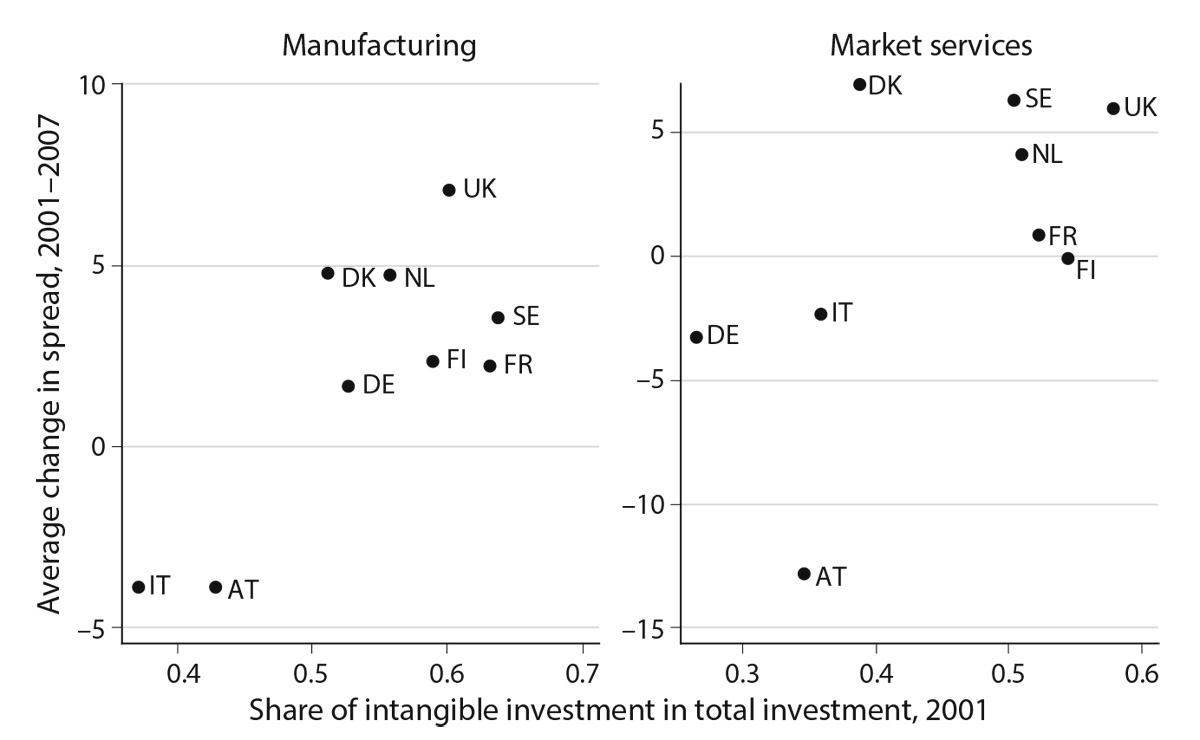
Figure 5.7. Intangible intensity and change in productivity spread. Change in productivity spread is change in top less bottom quartile of sector labor productivity between 2001 and 2007. Countries are Austria (AT), Denmark (DK), Finland (FI), France (FR), Germany (DE), Italy (IT), Netherlands (NL), Sweden (SE), UK (UK). Source: authors’ calculations based on productivity spread data from ESSLait (https://ec.europa.eu/eurostat/cros/content/impact-analysis_en) and the INTAN-Invest database (www.intan-invest.net).
So, productivity spreads rose a lot in countries where industries invest a lot in intangibles. Clearly more work on this question is needed but if the story holds up under more research, then the rise in intangible investment might be part of the explanation for the rise in the performance/productivity spread. This, in turn, could account for a divergence in investment behavior: leading firms, which are confident of their ability to create scalable assets and to appropriate most of their benefits, will continue to invest (and enjoy a high rate of return on those investments); but laggard firms, expecting low private returns from their investments, will not. In a world where there are a few leaders and many laggards, the net effect of this could be lower aggregate rates of investment, combined with high returns on those investments that do get made.
Spillovers: Intangibles and Slowing TFP Growth
A Lower Pace of Intangible Growth?
While the mismeasurement of intangible investment does not explain most of the investment problem, it may help account for one aspect of the secular stagnation puzzle: poor TFP performance in recent years.
As figure 2.4 showed, intangible investment has grown steadily over the past decades in most countries. Further, both intangible and tangible investment slowed after 2007. Now, while it has recovered, the growth rate is not as fast. Figure 5.8 shows that, as a result, the growth rate of the capital services of intangibles and also of R&D has slowed since 2007. (The capital services accounts for both investment and depreciation and so is a better measure of the flow of intangible services than just investment; see the appendix to chapter 3 and box 5.1.)
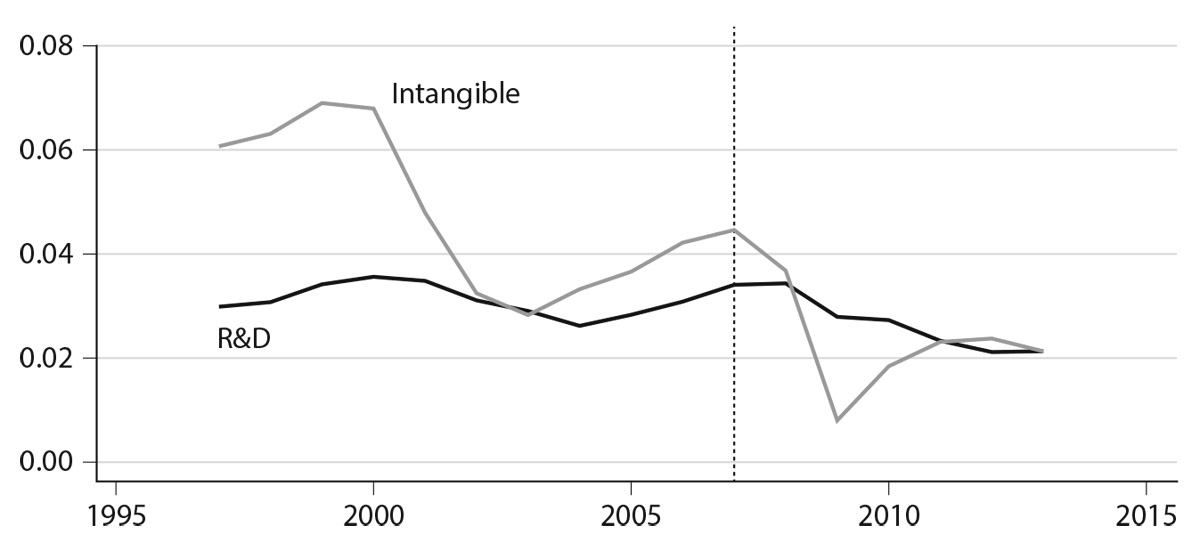
Figure 5.8. Intangibles and R&D capital services growth: all countries (weighted using GDP at PPP). Source: authors’ calculations from INTAN-Invest (www.intan-invest.net) and SPINTAN (www.spintan.net) databases.
Consider then two of the economic features of intangibles: spillovers and scalability. Suppose a firm invests in some tangibles and some intangibles. It should reap the benefits of both, but from intangibles it should get higher productivity, since it may be able to scale up those intangibles. In addition to that, if the benefits of intangibles spill over, other firms should be able to raise their productivity. We would expect these additional effects to show up in total factor productivity.4 The flip side of this is that if intangible capital growth falls, as we have seen in figure 5.8, then total factor productivity growth should fall as well.
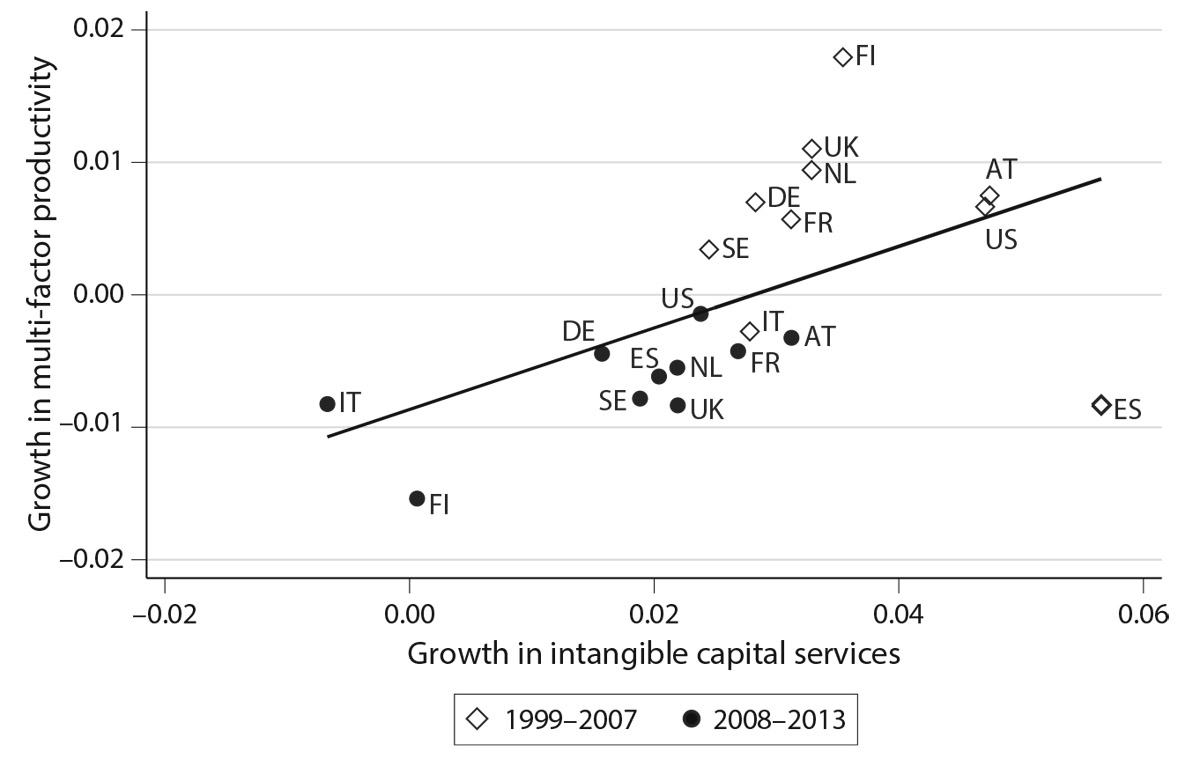
Figure 5.9. Multi-factor productivity and intangible capital services growth. The figure shows average annual growth rates between 1999 and 2007 (open diamonds) and 2008 and 2013 (closed circles). Data are whole-economy. Countries are Austria (AT), Finland (FI), France (FR), Germany (DE), Italy (IT), Netherlands (NL), Spain (ES), Sweden (SE), UK (UK), USA (US). Source: authors’ calculations from the INTAN-invest (www.intan-invest.net) and SPINTAN (www.spintan.net) databases.
Figure 5.9 takes a look at this, plotting TFP growth and intangible capital growth for ten countries before and after the Great Recession. Before the Great Recession, most of the countries were to the top right of the figure, indicating positive growth in intangibles and positive TFP. After 2008, all the countries except Spain moved down to the bottom left as their intangible growth and their TFP both fell. The upward-sloping line of best fit summarizes this: there does seem to be an association between the slowdown in intangible capital growth and the slowdown in TFP growth. A more sophisticated investigation involving more years confirms this, and Figure 5.10 confirms a similar pattern for R&D capital growth.
Granted, both pictures are noisy and other things might be going on, which future research will have to explore. But the figure suggests that the TFP slowdown might be in part accounted for by the intangible slowdown.
Are Intangibles Generating Fewer Spillovers?
Another reason why there might be slower TFP growth is that intangibles are somehow generating fewer spillovers. This is inevitably rather speculative, but let us consider why it might be.
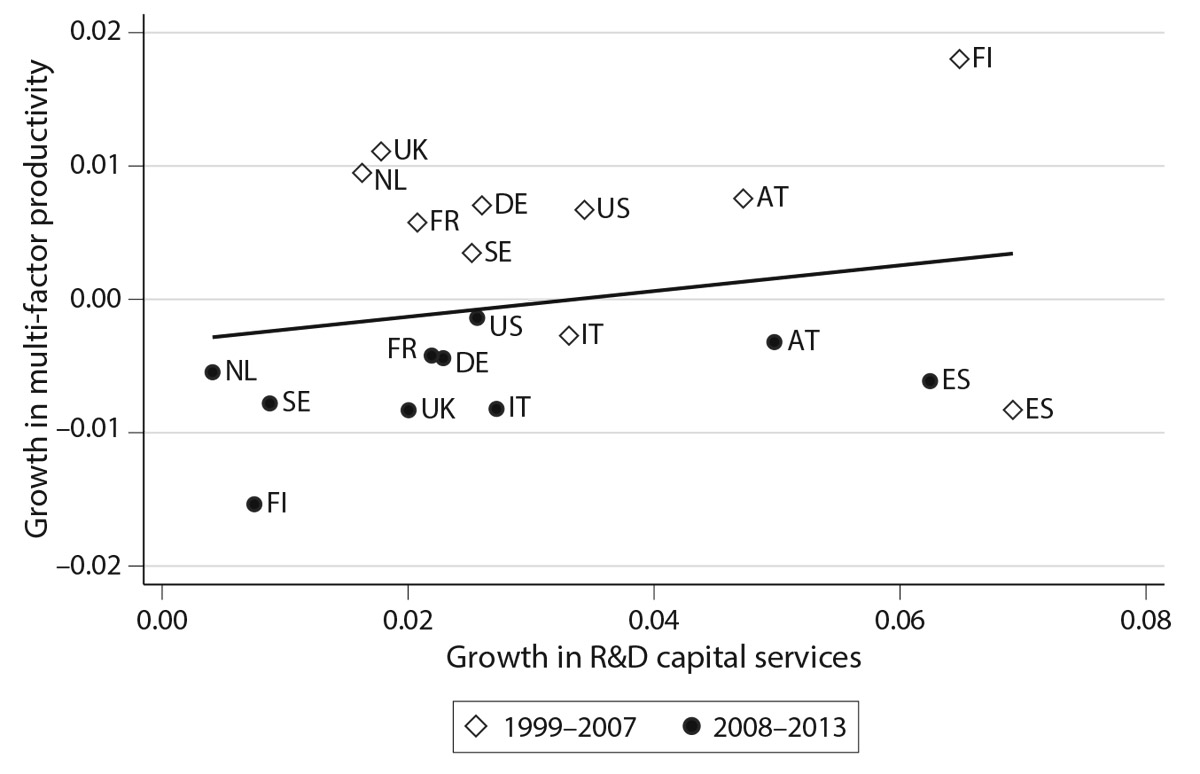
Figure 5.10. Multi-factor productivity and R&D capital services growth. The figure shows average annual growth rates between 1999 and 2007 (open diamonds) and 2008 and 2013 (closed circles). Data are whole-economy. Countries are Austria (AT), Finland (FI), France (FR), Germany (DE), Italy (IT), Netherlands (NL), Spain (ES), Sweden (SE), UK (UK), USA (US). Source: authors’ calculations from the INTAN-Invest (www.intan-invest.net) and SPINTAN (www.spintan.net) databases.
One possibility is that lagging firms have become less effective at absorbing spillovers. If the benefits of intangible spillovers accrued to firms at random, this would have no obvious effect on firm profitability. Any firm would have as good a chance of serendipitously gaining from another firm’s intangible investments as it would have of losing the returns of its own investments to a rival. But even a casual acquaintance with the business press or with management studies research suggests that the world does not work like that.
Certain businesses are thought to be unusually good at benefiting from other firms’ ideas. Google’s ability to purchase, grow, and promote the Android operating system, which Steve Jobs believed was a rip-off of Apple’s iOS, is a famous example of this. But it is a trend we see throughout the economy: management gurus offer advice on “open innovation” and “fast followership.” People often observe that while the early bird catches the worm, it is the second mouse that gets the cheese. (Economist and blogger Chris Dillow made the point that the incentive to be a “fast follower” might be higher in a sector experiencing a lot of technological progress: waiting not only allows a firm to benefit from the spillovers of the first firm to invest, but it might also benefit from falling prices for investments like software.)5
The scalability and synergies of intangible investments also play a role in making leading firms more willing to invest. Leaders are more likely to be larger and to grow faster and, therefore, to be able to take advantage of the scalability of intangibles. (Consider how Starbucks can deploy its brand and operating procedures in every new café it opens without more intangible investment.) They are more likely to possess other valuable intangibles that are synergistic with new investments they make. (Consider how Apple’s preexisting reputation for attractive, intuitive products made consumers willing to try the iPhone, even though previous smartphones had been hard to use.)
Even if lagging firms are investing less, an overall fall in investment depends on the composition of the industry. If only a few leading firms were able to internalize the benefits of intangible investment, those firms could, in theory, increase their levels of investment so much that they would be taking up the slack for all the laggards—only a few firms would invest, but those that did would invest massively. For overall investment and growth to be reduced, the level of investment by the leading firms that are still happy to invest in intangibles would have to be insufficient to fully make up for the putative shortfall in investment by the laggards.
There are a couple of reasons why this shortfall may occur. The first comes back to our earlier discussion about the fundamental characteristics of intangibles as investments generally. Even a big firm with many complementary assets that is good at open innovation is likely to struggle to capture the benefits of some intangible investments. A firm like Tesla Motors that makes many large long-term R&D and design investments (as well as big tangible investments) is considered to be unusual by media and stock market analysts alike.
The second possibility is that perhaps even when a leading firm is theoretically willing to make big intangible investments, management attention and the difficulty of delivery act as a bottleneck. Consider Amazon, a market leader with overwhelming scale and lots of valuable intangibles. It has a reputation for being very good at execution and for adopting the ideas of challenger firms and beating them at their own game, and it is willing to invest and defer profitability for the long term. Amazon has certainly invested heavily to develop new businesses, expanding from its original bookselling business to general retail, computer hardware, and cloud computing and is now moving into groceries. But these investments have taken time. Perhaps the need to focus management attention on so many priorities limits the speed with which individual firms, even if they are market leaders, can make big strategic investments. Certainly the idea of managerial focus, and of not biting off more than a company can chew, is popular in management books and business journalism. If this is true, the perceived need to focus could limit total investment in sectors where only a few companies felt confident of reaping the rewards of investment.
Finally, we should consider the possibility that the true nature of intangible investment has changed. Maybe it conceals rent-seeking activities that superficially look like they increase productivity but actually do nothing of the sort.
Common sense tells us that, tangible or intangible, some investments that firms make are good and some are bad: that’s the nature of business. Over time, and at the level of the economy as a whole, the good investments and the bad investments balance out, and the marginal investment of an average company delivers a market rate of return.
Of course, the private returns to the firm making an investment will not always be the same as the wider returns to the economy as a whole. When an intangible investment has beneficial spillovers, as we discussed above, the social rate of return exceeds the private rate, and other firms benefit too, just as Samsung and HTC benefited when Apple invested enough to convert mobile phone users to smartphones.
But it is also possible to imagine investments, intangible and tangible, that produce little or no social return; the private return they generate for the firm that makes them is the result of shifting value that had already been created somewhere else.
Consider two businesses that have been in the news recently: Mylan, a drug company that sells the EpiPen, and Uber, the global ride-sharing business. As we mentioned in chapter 4, the success of the EpiPen depends on a set of interlocking intangible investments: its design has been approved by drug regulators; its name (which is protected) is recognizable; first aiders are trained in how to use it; and it has sales and marketing channels into important customers, like schools (some of which are supported by laws, like the US Schools Access to Emergency Epinephrine Act of 2013). There is also a darker side to the EpiPen’s success: EpiPen’s makers have sued the makers of competing products, delaying or preventing their access to the market. Some of the things that make the EpiPen profitable create a social benefit as well as a private one: the fact that first aiders know how to use an EpiPen, or that many anaphylaxis sufferers know the EpiPen brand, is good both for consumers and for Mylan. But it is less clear whether lawsuits against competing products, or the difficulty of the process for approving new autoinjectors, are in anyone’s interest but Mylan’s.
Uber raises similar questions. One of the valuable intangibles that Uber profits from, alongside its software and its brand, is its large network of driver-partners. (A sign of the value of these networks to Uber is the fact that when Uber opens in a new city, it sometimes offers generous deals and premia to new drivers to sign up with the service.) Now, in some respects, this intangible asset provides a public as well as a private benefit: building a network of quality-assured, networked drivers is a valuable service for Uber’s customers. But critics have argued that at least in some respects, Uber’s “investment” in its driver network is a zero-sum game: the purpose of maintaining a network of drivers, they argue, is to allow Uber to get the benefits of hiring a lot of staff without having to comply with employment laws or minimum wages. To this extent, Uber’s investment in a network of drivers is valuable to Uber at least in part not because it creates new value but because it takes value away from drivers (who would otherwise benefit from minimum wages, etc.).
The allegations against Mylan and Uber are that some of their intangible investments do no good for the economy as a whole, but instead are about slicing the existing economic pie to the exclusive benefit of the intangible investor.
We can think of other examples of this. Consider two companies, GoodCo and BadCo, both of which spend money on legal fees and business restructuring costs to set up a new subsidiary—an example of an organizational development investment. The purpose of GoodCo’s subsidiary is to deliver a new, profitable service to customers; it will be a positive private return to the firm and also a positive social return (that is to say, GDP will go up).
But suppose that the sole purpose of BadCo’s subsidiary is to help the company avoid tax. In this case, there would be a private return to BadCo in the form of a lower tax bill, but no social return, and no increase in GDP; the firm’s private return is just the appropriation of money that would have otherwise gone to the government.
When this sort of rent-seeking spending is made, and if it is counted as investment, then investment would increase. Perhaps the position of the leader will also rise, but total output would not increase at all. This would manifest itself as a decline in TFP, the residual between the contribution of labor and investment to growth and the observed rate of growth itself. To the extent that there are spillovers, the spillovers are negative.
We can think of other sorts of spending like this: so-called blocking patents developed solely to keep rivals out of a particular field of research; or advertising campaigns that are only about stealing market share from other firms (although, as we saw in chapter 4, the evidence is that most advertising does not do this). Intangible investment might have other negative externalities that are harder to measure: it is a long-standing criticism of capitalism that following bureaucratic rules is dehumanizing and depressing for workers—it is plausible that some types of organizational development investment might make workers less happy by removing their autonomy. Although the opposite case could also be made: some organizational development investment, like lean processes, are predicated on giving workers greater agency rather than less. Some tangible investment may also generate limited social returns: consider the fiber-optic cables installed by high-frequency trading firms for the sole purpose of shaving fractions of microseconds off trading times (described vividly by John Kay 2016). And not all money spent on rent-seeking generates an intangible investment, at least not in the main methodologies used to measure intangibles. But it does seem that rent-seeking or zero-sum investments are more common among intangible investments than among tangibles.
This could have a bearing on investment and productivity figures. It is possible that the increase in intangible investment is concealing a rise in rent-seeking investments that do not increase GDP. This would not explain the fall-off in investment that has been observed in the economy, but it would help explain the fall-off in productivity and in TFP. It is conceivable that in a poorly governed economy, the amount of intangibles whose purpose is to attract rents goes up. So for any given level of intangible investment, output would be lower, and TFP would fall. This risk provides a good reason for policymakers to guard against rent-seeking in an increasingly intangible economy.
There is also the possibility that the rise of intangible investment may be encouraging more rent-seeking, which may be increasing the gap between leaders and laggards that we discussed earlier.
A paper by James Bessen specifically asks whether the gap between leaders and laggards among US nonfinancial businesses has been caused by increasing intangible investment or by greater rent-seeking by leading firms. Bessen looks at the relationship between regulation in industries (measured by an index of regulation and by political lobbying expenditures) and the valuations of public companies. He concludes that while a significant portion of the increase in stock prices since 1980 has been caused by intangibles (measured by R&D), spending on regulation and lobbying has an even stronger effect on valuations (Bessen 2016).
Now, perhaps the contestedness of intangible assets that we discussed in chapter 4 encourages firms to spend money asserting or protecting their claims to them. In recent years, an increasing proportion of lobbying in the United States has been carried out by technology firms; typically, these firms are lobbying in relation to valuable intangible assets they own, such as Google’s right to use its valuable data and software in particular ways, or Uber’s and AirBnB’s rights in respect of their valuable networks of drivers and hosts. The rewards for successful lobbying are very high: all these intangible assets are highly scalable and are intrinsic to their owners’ business models. They are also what make their owners leaders rather than laggards—which in itself may discourage laggard competitors from investing in the future.
So, it is not that intangible spending is mismeasured and is really lobbying spending. It is, perhaps, that we have entered a phase where the transition to an intangible economy is requiring a new set of institutions to resolve the inherent contestedness of intangible assets.
An optimistic interpretation of this is that the legal and institutional structures behind a transformation to an intangible-intensive economy are being worked out and that until they are, there will be a disproportionate incentive for firms to spend more on rent-seeking relating to intangible investment. For example, as spillovers and scale effects become more important, existing tax and competition and IP rules get tested to destruction, requiring lobbying, legal arguments, and institutional reboots. This adjustment to a new type of economy will need a lot of spending by firms and governments that is not immediately productive. Thus a given dollar of business intangible spending has less productivity-raising effect. A more troubling interpretation is that these types of rent-seeking are linked to the inherent characteristics of intangibles, in particular their contestedness: this would imply that TFP growth will continue to be low until governments learn to do a much better job of preventing rent-seeking and designing the institutions an intangible economy needs.
Conclusion: An Intangible Role in Secular Stagnation
Secular stagnation is clearly a complex phenomenon, with a wide range of possible causes. We have identified four possible ways that the long-term shift from tangible to intangible investment could be causing or exacerbating it.
First, mismeasurement helps explain a little of the puzzle. The inclusion of intangible investment, which has been rising, shows that the investment drought is not as bad as it seems. It also marginally improves GDP growth. But the bulk of the secular stagnation problem remains.
Second, it looks like the scalability of intangibles is allowing very large and very profitable firms to emerge. These firms may also be better placed to appropriate the spillovers of other firms’ intangible investments. That raises the productivity and profits gap between the leaders and the laggards and simultaneously decreases the incentives to invest for laggard firms. This could help explain how low levels of investment coexist with high rates of return on the investments that do get made.
Third, after the Great Recession, the pace of intangible capital building has slowed. This might throw off fewer spillovers, thus causing firms to scale up by less than beforehand and slowing total factor productivity. There is some evidence to support this: roughly the largest TFP growth slowdowns are in the countries with the largest R&D and intangible capital growth slowdowns.
Last, and more speculatively, lagging firms may be less able to absorb spillovers from leaders, perhaps because leading firms are much more able to exploit the synergies between different intangible types than the laggards. Or perhaps the economy is in a phase where the transition to an intangible economy, which requires a new set of institutions to resolve the inherent contestedness of intangible assets, has skewed investment toward lobbying, legal arguments, and institutional reboots, none of which are immediately productive.
Appendix: Effect of Unmeasured Intangibles on GDP Growth
The effect of unmeasured intangibles on GDP growth is a bit complicated. Since measured GDP levels include measured investment, then GDP growth includes measured investment growth (multiplied by the share of investment in GDP). So mismeasurement only occurs if the omitted investment is growing faster or slower than GDP growth: if they are growing at exactly the same rate, we get the level of GDP wrong, but the growth rate is right. Thus if the omitted intangible investment grows faster than measured GDP growth, measured GDP growth is too low, which can look just like secular stagnation (in the sense of low growth). Figure 5.11 sets out the net effect on growth, for all eleven EU countries and the United States, which turns out to be rather small: GDP growth since 2008 is very slightly higher, but only by fractions of a percentage point per year.
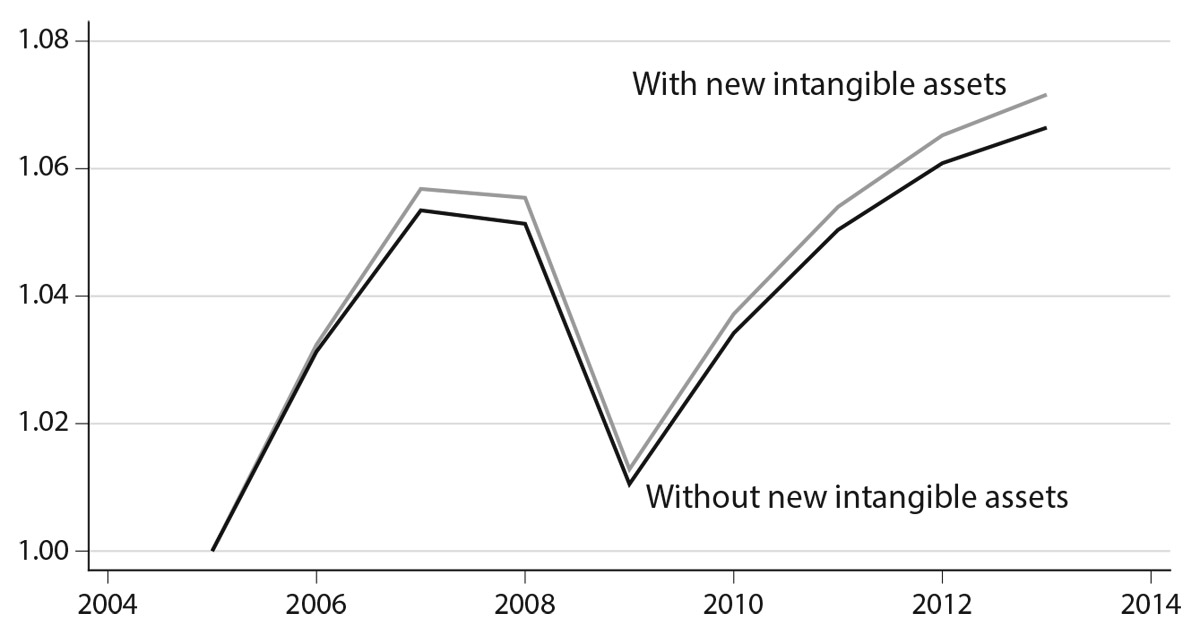
Figure 5.11. Output growth with and without intangibles (all countries; index to 2005 = 1). Source: authors’ calculations from the SPINTAN database (www.spintan.net).
