![]()
AMERICA’S EXISTING INSTITUTIONS and policies aren’t doing well enough in providing economic security, in promoting capabilities and opportunity, and in ensuring rising living standards for households in the lower half. We can do better. In this chapter, I describe how.
Happily, for the most part we aren’t in need of new ideas. We have good programs in place that we can build on, and other rich nations have some that we could adopt. We can go a long way toward a good society via programs already in existence here or abroad.
What can be done to reduce economic insecurity? In chapter 2, I highlighted three sources of insecurity: low income, large income declines, and unexpected large expenses. Let’s consider these in reverse order.
First, unexpected expenses. The most common large unanticipated expense Americans face is a medical bill. The remedy here is simple and straightforward: universal health insurance.
Who should provide this insurance? Currently, more than half of Americans get their health insurance via an employer-based program. Another third are insured through a government program (Medicare, Medicaid, or the Veteran’s Administration), and the remainder purchase health insurance directly or are not insured.1 Our employer-centered health insurance system was a historical accident. It originated in World War II, when wage controls led firms to offer health insurance in order to attract employees. After the war, encouraged by a new tax break, this practice proliferated, and it has remained in place ever since. In a society in which people switch jobs frequently, it makes little sense for insurance against a potentially major and very costly risk such as medical problems to be tied to employment. Moreover, growing numbers of employers have cut back on or dropped their health insurance plans, and that’s likely to continue.2
This is a problem, but it’s also an opportunity. As fewer Americans in coming decades have access to affordable private health insurance, we should allow them to shift into Medicare or Medicaid (and eventually combine these two programs). This will free employers from having to deal with the cost and hassle of health insurance and free employees to move more readily from job to job. And it will give Medicare and Medicaid more leverage to impose cost controls on healthcare providers.3
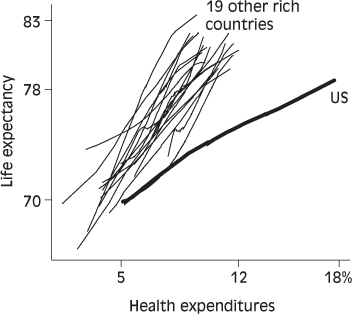
Can the country afford universal health insurance? Containing the growth of health-care costs is vital, and there is disagreement about the best way to do it.4 The good news is that we can go a long way simply by learning from other rich nations.5 As figure 3.1 shows, health expenditures in the United States have risen much faster than in other affluent nations, yet we’ve achieved less improvement in life expectancy. This is a big challenge, but it’s a manageable one.
Next, large involuntary declines in income. Here, four changes are needed. One is sickness insurance. We are the only rich nation without a public sickness insurance program.6 Though many large private-sector firms offer employees some paid sickness days, and a few cities and states have a public program, one in three employed Americans gets zero days of paid sick leave.7
FIGURE 3.1 Health expenditures and life expectancy, 1960–2010
The data points are years. The lines are loess curves. Life expectancy: years at birth. Health expenditures: public plus private, as percent of GDP. The other countries are Australia, Austria, Belgium, Canada, Denmark, Finland, France, Germany, Ireland, Italy, Japan, the Netherlands, New Zealand, Norway, Portugal, Spain, Sweden, Switzerland, and the United Kingdom. Data source: OECD, stats.oecd.org.
A second is paid parental leave. A 1993 law, the Family and Medical Leave Act, requires firms with fifty or more employees to provide twelve weeks of leave to employees having a child or caring for a sick relative. But that isn’t much time, and there is no requirement that the leave be paid. Consequently, many Americans in low-income households take little time off. That’s bad for newborn children. Outcomes for children tend to be best when they are with their parent(s) throughout the first year of life.8 Swedish policy gets it right. Parents of a newborn child have thirteen months of job-protected paid leave, with the benefit level set at approximately 80 percent of earnings. (Two of those months are “use it or lose it” for the father; if he doesn’t use them, the couple gets eleven months instead of thirteen.) In addition, parents can take four months off per year to care for a sick child up to age twelve, paid at the same level as parental leave.9
A third change needed to reduce large income declines is to expand access to unemployment insurance.10 Only about 40 percent of unemployed Americans qualify for compensation.11
Fourth, we should add a new wage insurance program.12 Flexibility is a hallmark of America’s economy. It’s a feature worth preserving and enhancing. Some Americans who get laid off from a job cannot find another one that pays as well and are forced to settle for one that pays less. For a year or two, wage insurance would fill half the gap between the former pay and the new lower wage. This would enhance economic security. It would also ease resistance to globalization and to technological advance, both of which are beneficial for the whole but result in job loss for some.
Finally, we come to the question of low income. For the bulk of working-age Americans, the problem of too-low household income can be addressed via two simple steps. First, increase the statutory minimum wage and index it to inflation. Second, increase the EITC benefit level, particularly for households without children, for whom the EITC currently provides only a small amount. These two steps would boost the incomes of working-age households that have someone employed.13
But this leaves out working-age households in which no one is employed. What to do about such households has long been the thorniest question in American social policy.14 There is no optimal solution. If we are generous, some will cheat the system. If we are stingy, we cause avoidable suffering. Given this tradeoff, the best approach is a policy that vigorously promotes employment for those who are able to work, provides a decent minimum for those who aren’t, and deals on a case-by-case basis with those who can work but don’t.15
Such a policy would require four modifications to what we have now. First, we should alter our approach to caseworkers and the assistance they provide. In theory, caseworkers help TANF recipients find jobs, but in reality many caseworkers are undertrained, overworked, and have limited means to provide real help.16 We need a unified active labor market policy. Let me explain what I mean. For some Americans at the low end of the labor market, adulthood is a series of transitions, in which they move in and out of part-time or full-time employment, off-the-books work, receipt of government benefits, romantic relationships, child rearing, drug or alcohol addiction, and time in jail.17 The best thing we can do is to provide help, support, cajoling, pushing, and the occasional threat. People who struggle to find a job after leaving school (whether at age 22, 18, or earlier) should immediately get individualized help.18 This may include temporary cash support, a push into a training program, and/or a push into counseling. Strugglers should be monitored as they move along in life. For this to be effective, we need caseworkers who are well trained, connected to local labor market needs, committed to their job, and not swamped with clients. They must be able to make realistic judgments about when clients can make it in the workforce and when the best solution is simply to help them survive.
Second, government should act as an employer of last resort. Make-work has a mixed history in the United States. It played a prominent role in the 1930s, and subsequent smaller-scale programs have boosted the employment rates of low-end workers.19 Although these programs don’t tend to provide a ladder to a permanent, high-paying job, that shouldn’t discourage us. The point is to ensure that there is a job for anyone able and willing to work.
Third, restrictions on receipt of TANF should be eased. In bad economic times, such as the 2008–9 recession and its aftermath, the five-year lifetime limit instituted in the mid-1990s has proved too strict, causing needless hardship and suffering.20 We should allow more exemptions to this limit during economic downturns.
Fourth, the benefit amounts should be increased and eligibility criteria eased for our key social assistance programs—TANF, general assistance, food stamps, housing assistance, and energy assistance. Given the time limit on receipt of TANF benefits, a generous benefit level is unlikely to be a deterrent to employment.
Of course, there are a variety of circumstances in which we don’t expect working-age adults to be in a job: unemployment (actively seeking work but unable to find it), disability, sickness, and childbirth. Financial assistance for these people comes from other programs discussed earlier in this section.
What about the elderly? Social Security is a very good program, and one that’s in solid shape. With a few tweaks, it will be solvent and effective for generations to come.21 But we need to shore up retirement income security’s second tier: private pensions. There is no going back to the defined-benefit past; for most Americans, a private pension in the future will be a defined-contribution one. Rather than allow Americans who are employed full-time to contribute to defined-contribution plans if their employer offers one, if they are aware of it, and if they feel they can afford to put some of their earnings in it, we should make contributing the default option and make it available to everyone.22 Employers with an existing plan could continue it, but they would have to automatically enroll all employees and deduct a portion of their earnings unless the employee elects to opt out. Employers without an existing plan could participate in a new universal retirement fund, which would automatically enroll every employee. Workers whose employer does not match their individual contributions would be eligible for matching contributions from the government.
The final piece of the economic security puzzle is public goods, services, spaces, and mandated free time—including childcare, roads and bridges, healthcare, holidays and vacations, and paid parental leave. These increase the sphere of consumption for which the cost to households is zero or minimal. They lift the living standards of households directly and free up income for purchasing other goods and services.23
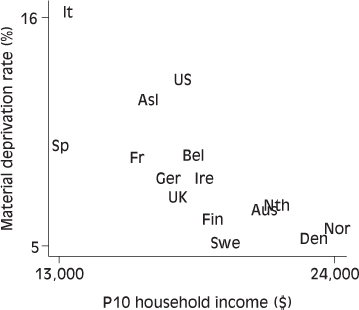
Figure 3.2 displays two measures of material well-being for households at the low end. The horizontal axis shows income for households at the tenth percentile as of the mid-2000s. On the vertical axis is a measure of material deprivation, a more direct indicator of living standards. Two OECD researchers, Romina Boarini and Marco Mira d’Ercole, have compiled material deprivation data from surveys in various nations.24 Each survey asked identical or very similar questions about seven indicators of material hardship: inability to adequately heat one’s home, constrained food choices, overcrowding, poor environmental conditions (noise, pollution), arrears in payment of utility bills, arrears in mortgage or rent payments, and difficulty making ends meet. Boarini and Mira d’Ercole create a summary measure of deprivation by averaging, for each country, the shares of the population reporting deprivation in each of these seven areas.
FIGURE 3.2 Low-end household incomes and material deprivation
P10 household income: posttransfer-posttax income of households at the tenth percentile of the income distribution. Measured in 2005 or as close to that year as possible. Incomes are adjusted for household size (the numbers shown here are for a household with three persons) and converted into US dollars using purchasing power parities (PPPs). Data sources: Luxembourg Income Study, www.lisdatacenter.org, series DPI; OECD, stats. oecd.org. Material deprivation rate: share of households experiencing one or more of the following: inability to adequately heat home, constrained food choices, overcrowding, poor environmental conditions (e.g., noise, pollution), arrears in payment of utility bills, arrears in mortgage or rent payment, difficulty in making ends meet. Measured in 2005. Data sources: OECD, Growing Unequal?, 2008, pp. 186–188, using data from the Survey on Income and Living Conditions (EU-SILC) for European countries, the Household Income and Labour Dynamics in Australia survey (HILDA) for Australia, and the Survey of Income and Program Participation (SIPP) for the United States. “Asl” is Australia; “Aus” is Austria.
The income of a typical low-end household in the United States is similar to that in many rich countries, albeit lower than in Norway, Sweden, Denmark, and Finland. Our rate of material deprivation, by contrast, is higher than in all but one of the other nations, and by a relatively large margin. This difference is most likely due to our limited public provision of services. Services enhance access to medical care, childcare, and housing, and allow poor households to spend their limited income on other necessities.
To reduce economic insecurity, we need to make a number of policy changes. But none are radical, and most build on programs we already have in place. This is quite doable.
Inequality of opportunity is increasing. But all hope is not lost. We know this because many other rich nations do better. The best indicator when comparing countries is relative intergenerational mobility, and data exist for ten of our peer nations. As figure 3.3 shows, the United States has less equality of opportunity than eight of them, and the same amount as the other two.
What can we do to address this problem? Genetics, families, friends, and neighborhoods influence capability development, but we don’t want government intervening directly in family life or telling us where we should live. We therefore rely heavily on schools. School is especially valuable for children from less advantaged circumstances. We know this in two ways. First, children from poor homes tend to have significantly lower cognitive and noncognitive skills than children from affluent homes when they enter kindergarten, and the size of that gap is about the same when they finish high school.25 Given the huge differences in home and neighborhood circumstances, this suggests that schools have an equalizing effect. Second, during summer vacations, when children are out of school, the gap in cognitive ability increases.26
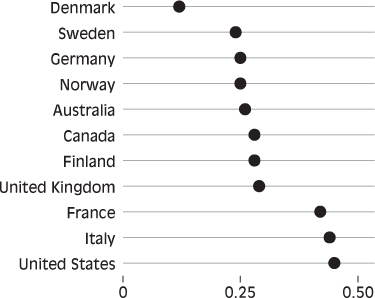
FIGURE 3.3 Inequality of opportunity
Correlation between the earnings of parents and those of their children. A higher score indicates less relative intergenerational mobility and hence more inequality of opportunity. Data source: John Ermisch, Markus Jäntti, and Timothy Smeeding, eds., From Parents to Children: The Intergenerational Transmission of Advantage, Russell Sage Foundation, 2012, figure 1.1.
Let’s begin with college. Figure 3.4 shows rates of college entry and completion by family income for Americans growing up in the 1980s and 1990s. On average, about two-thirds of a typical cohort enter college and about one-third end up with a four-year degree. But both entry and completion vary starkly by family income. For those whose parents’ income is in the bottom quarter, only 30 percent begin college and only 10 percent get a four-year degree. Moreover, the increase over the past generation has been minimal (see figure 2.4).
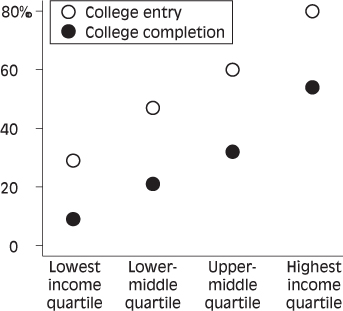
FIGURE 3.4 College entry and completion by parents’ income
Persons born 1979–82. College entry: includes all two-year and four-year postsecondary institutions. College completion: four or more years of college. Data source: Martha Bailey and Susan Dynarski, “Gains and Gaps: A Historical Perspective on Inequality in College Entry and Completion,” in Whither Opportunity? Rising Inequality, Schools, and Children’s Life Chances, edited by Greg J. Duncan and Richard J. Murnane, Russell Sage Foundation, 2011, figures 6.2 and 6.3, using National Longitudinal Survey of Youth data.
How can we help more Americans from low-income families start and finish college?27 One suggestion is to improve prior schooling. Better preparation in elementary and secondary school, in this view, will encourage more low-income kids to go to college and enable them to succeed once there. A second approach stresses improving performance and retention among less advantaged youth who enter college through better instruction, advising, support, and close monitoring. A third emphasizes cost. Now, the actual cost of college sometimes is overstated. If we take into account grants and financial aid, instead of looking simply at the “sticker price” of tuition and room and board, the average cost per year for a public four-year university was $11,500 in 2011–12, and for low-income families the cost often is less than this. But the average income among families in the bottom fifth of incomes is just $18,000 (see chapter 2), and at that income, even $5,000 a year for college may be too much.
All three strategies—improving preparation, enhancing retention, and reducing cost—would help. But where do we start? Christopher Jencks offers the following sensible advice: “Making college a lot more affordable is a challenge governments know how to meet, while making students learn a lot more is a challenge we do not currently know how to meet. Under those circumstances, starting with affordability is probably the best bet.”28
In Denmark, Finland, Norway, and Sweden, attending a four-year public university is free. In those countries the odds that a person whose parents didn’t complete high school will attend college are between 40 percent and 60 percent, compared to just 30 percent in the United States.29
Some feel it makes no sense to try to increase college attendance and completion.30 After all, there is a limited supply of high-skill jobs, so some graduates will end up in jobs that don’t require anything near college-level skills. Yet if our aim is to maximize capabilities, including the ability to make informed preferences, we must help more Americans from low-income families into and through college. In addition to providing a vocational skill and a valuable job-market credential, a college education can aid in the development of general skills, such as complex reasoning, critical thinking, and written and verbal communication.
Moving backward through the education system, what about K-12? After rising steadily for a century, the share of Americans completing secondary school has been stuck at 75 percent for several decades.31 Social and economic shifts are partly to blame: there are more students for whom English is not the principal language at home, more children grow up in unstable families, and the incomes of low-income households have barely budged. Despite these obstacles, or perhaps because of them, we need schools to do better.
A generation ago many blamed the huge inequality of school resources, a product of our decentralized, property-tax-based system of school funding.32 Some of that inequality has been rectified, as state governments now contribute a larger share of funds to schools and distribute them to offset the unequal distribution of local property values.33 While funding inequality across states remains substantial, overall the situation is better.
Some believe the problem lies in lack of competition among public schools. If competition works, it is in one respect an ideal policy strategy: it requires little or no understanding of why some schools perform well while others don’t. Customers (parents) simply choose the effective schools, and the bad ones go out of business. Choice is a good thing in and of itself. We want to be able to choose our doctor, after all, so why not our children’s school? Social democratic Sweden introduced choice into its school systems in the mid-1990s.
But so far our experience in the United States suggests that whatever its intrinsic merit, choice may not improve schooling. Charter schools—publicly funded elementary and secondary schools that are allowed considerable leeway in determining procedures and practices and that compete with regular public schools—have not, on average, boosted student performance.34 In any case, transportation barriers, friendship ties, and other factors cause many children who might benefit from switching to a better school to remain at their nearby school instead.35
The federal government’s 2001 No Child Left Behind reform mandated regular standardized testing in America’s elementary and secondary schools. This is a useful means of improving information about school effectiveness. But it is not in and of itself a strategy for making schools better.
Evidence from a variety of sources—standardized tests in the United States, international tests, quasi-experimental studies, and a host of qualitative analyses—suggests that teachers are a key ingredient in effective K-12 schooling.36 We should do more to attract, retain, and support good teachers. That means more-rigorous training, better efforts to identify effective teachers, higher pay, improved working conditions, and reduced restrictions on firing less effective teachers.37
Of the various things we can do to improve American schooling, the most valuable would be to introduce universal high-quality affordable early education. Here, too, we can learn from the Nordic countries. Beginning in the 1960s, these countries introduced and steadily expanded paid maternity leave and publicly funded childcare and preschool. Today, Danish and Swedish parents can take a paid year off work following the birth of a child. After that, parents can put the child in a public or cooperative early education center. Early education teachers receive training and pay comparable to that of elementary school teachers. Parents pay a fee, but the cost is capped at around 10 percent of household income. In these countries, the influence of parents’ education, income, and parenting practices on their children’s cognitive abilities, likelihood of completing high school and college, and labor market success is weaker than elsewhere.38 Evidence increasingly suggests that the early years of a child’s life are the most important ones for developing cognitive and noncognitive skills, so the Nordic countries’ success in equalizing opportunity very likely owes partly, perhaps largely, to early education.39
Early education also facilitates employment of parents, especially mothers, thereby enhancing women’s economic opportunity and boosting family incomes.40 In a country that values employment, that wants to facilitate and promote work, this is the type of service our government should support. About half of preschool-age American children already are in out-of-home care, but much of it is unregulated and therefore of uneven quality.41 While some parents can pay for excellent care, many cannot. Universal early education would change that.
When someone suggests borrowing a policy or institution from the Nordic countries, skeptics immediately point out that these countries are very different from the United States. They’re small, they’re more ethnically and racially homogenous, and their cultures and histories are quite distinct from ours. What works there, in other words, won’t necessarily work here.
That’s true. But it doesn’t justify blanket skepticism about borrowing. We have to consider the particulars of the policy in question. There is no reason to think a system of public, or at least publicly funded, early-education centers (schools) can function effectively only in a small homogenous country. France has this kind of system, even though it’s a pretty large nation. Belgium does, too, despite its diversity. And we do a reasonably good job with our kindergartens and elementary schools. Education experts and ordinary Americans routinely profess dissatisfaction with our K-12 public schools. But recall the evidence from summer vacations: children from less advantaged homes lose substantial ground when they aren’t in school. American schools could be better, to be sure, but for less advantaged children they are, even in their current condition, far better than the likely alternative.
Why should early education be universal? Why not just expand Head Start, our existing public pre-K program for low-income children? The reason is that development of both cognitive and, especially, noncognitive skills is helped by peer interaction. Children from less advantaged homes gain by mixing with kids from middle-class homes, which doesn’t happen in a program that exclusively serves the poor.42
I’ve focused on schools because they are our principal lever for enhancing opportunity. But they aren’t the only one. Three other strategies are worth pursuing.43 First, we could get more money into the hands of low-income families with children. Greg Duncan, Ariel Kalil, and Kathleen Ziol-Guest have found that for American children growing up in the 1970s and 1980s, an increase in family income of a mere $3,000 during a person’s first five years of life was associated with nearly 20 percent higher earnings later in life.44 Most other affluent countries, including those that do better on equality of opportunity, offer a universal “child allowance.” In Canada, for instance, a family with two children receives an annual allowance of around $3,000, and low-income families with two children might receive more than $6,000.45 We have a weaker version, the Child Tax Credit, which doles out a maximum of $1,000 a year per child. Moreover, receipt of the money is contingent on filing a federal tax return, which not all low-income families do.
Second, in the 1970s and 1980s, the United States began incarcerating more young men, including many for minor offenses. Having a criminal record makes it difficult to get a stable job with decent pay, dooming many offenders to a life of low income.46 We should rethink our approach to punishment for nonviolent drug offenders. States that have reduced imprisonment, turning to alternative punishments such as fines and community corrections programs, have experienced drops in crime similar to those in states that have increased imprisonment.47 If more states followed suit, we could avoid needlessly undermining the employment opportunities of a significant number of young men from less advantaged homes.
Third, since the late 1960s, affirmative action programs for university admissions and hiring have promoted opportunity for women and members of racial and ethnic minority groups.48 Affirmative action should continue, but with family background as the focal criterion.49
In chapter 2, I described the slow growth of income among lower-half American households since the 1970s. But what if there is no alternative? Do globalization, heightened competition, computerization, and manufacturing decline make it impossible for more than a little of our economic growth to trickle down to households on the middle and lower rungs of the income ladder? To assess this hypothesis, we can look at the experiences of other rich nations. Have they suffered the same decoupling of household income growth from economic growth?
Some have, but many haven’t. In fact, in quite a few other affluent countries we see a healthy relationship between economic growth and household income growth since the 1970s. Figure 3.5 shows the pattern in the United States and fourteen other nations. The horizontal axis shows change in GDP per capita, and the vertical axis shows change in average income among households on the lower half of the income ladder. The United States is one of the lowest on the vertical axis; the incomes of lower-half American households increased less than in most of the other nations. In some cases, such as Finland and Austria, that’s because their economy grew more rapidly than ours did. But a number of countries, including Denmark and Sweden, achieved larger increases in household incomes despite increases in GDP per capita very similar to America’s. Too little of our economic growth trickled down.50
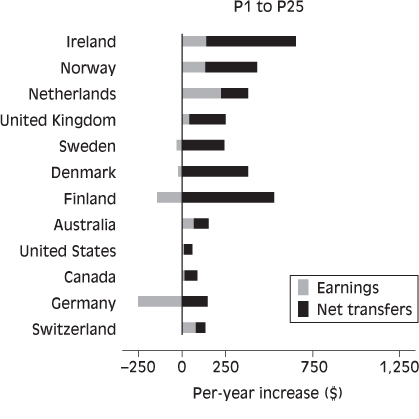
Why did some countries do better than others? Lower-half households have two principal sources of income: earnings and net government transfers. Earnings are wage or salary income from employment. Net government transfers are cash and near-cash benefits a household receives from government programs minus taxes it pays. Figure 3.6 shows the contribution to household income growth from each of these two sources. Data are available for twelve countries. Here I separate households in the bottom quarter of incomes from those in the lower-middle quarter (together these make up the lower half). Among households in the bottom quarter, rising income came mostly from increases in net government transfers. Among those in the lower-middle quarter, rising income stemmed from improvement in both earnings and net government transfers.51 In America, neither earnings nor net government transfers increased much. That’s why we observe the decoupling of economic growth and lower-half household income growth in the United States in figure 3.5 (also figure 2.5).
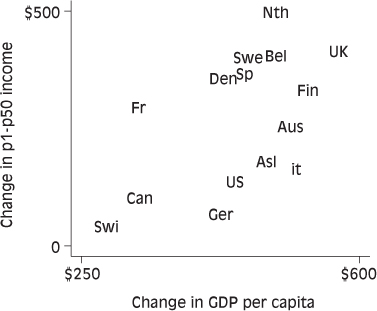
FIGURE 3.5 Economic growth and lower-half households’ income growth, 1979–2005
Change is per year on both axes. The actual years vary somewhat depending on the country. Household incomes are posttransfer-posttax, adjusted for household size (the amounts shown are for a household with four persons). The income data are averages for households in the lower half of the income distribution. Household incomes and GDP per capita are adjusted for inflation using the CPI and converted to US dollars using purchasing power parities. “Asl” is Australia; “Aus” is Austria. Ireland and Norway are omitted; both would be far off the plot in the upper-right corner. Data sources: OECD, stats.oecd.org; Luxembourg Income Study, www.lisdatacenter.org.
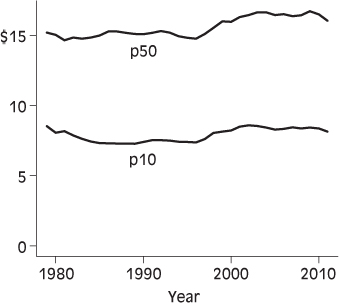
What are the prospects for earnings going forward? Household earnings can rise in two ways: higher wages and more employment. From the 1940s through the mid- to late-1970s, much of the growth in household incomes for working-age Americans came from rising wages.52 But as figure 3.7 shows, since the late 1970s inflation-adjusted wages in the bottom half have barely budged.
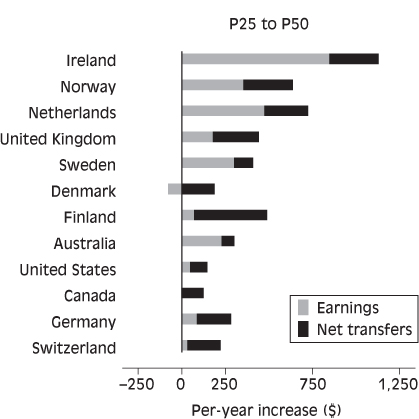
FIGURE 3.6 Change in lower-half households’ earnings and net government transfers, 1979–2005
Earnings and net transfers are adjusted for inflation using the CPI and converted to US dollars using purchasing power parities. Data source: Luxembourg Income Study, www.lisdatacenter.org.
FIGURE 3.7 Wages
Hourly wage at the fiftieth (median) and tenth percentiles of the wage distribution. 2011 dollars; inflation adjustment is via the CPI-U-RS. Data source: Lawrence Mishel et al., The State of Working America, stateofworkingamerica.org, “Hourly wages of all workers, by wage percentile,” using Current Population Survey (CPS) data.
In the post-World War II golden age, many American firms faced limited product market competition, limited pressure from shareholders to maximize short-term profits, and significant pressure from unions (or the threat of unions) to pass on a “fair” share of profit growth to employees. These three institutional features are gone, and it’s unlikely that they will return. Moreover, a host of additional developments now push against wage growth: technological advances (computers and robots), the continuing decline of manufacturing jobs, new opportunities to offshore mid-level service jobs, an increase in less-skilled immigrant workers, the growing prevalence of winner-take-all labor markets, a shift toward pay for performance, and minimum wage decline.
In the one brief period of nontrivial wage growth in the past generation, the late 1990s, the key seems to have been a tight labor market.53 The unemployment rate dipped below 4 percent, the lowest since the 1960s. It would be good to repeat this, but I suspect it won’t happen. The next time our unemployment rate gets near 4 percent, the Federal Reserve is more likely to slam on the brakes by raising interest rates. In the late 1990s, Fed chair Alan Greenspan held interest rates low despite opposition from other Fed board members who worried about potential inflationary consequences of rapid growth, rising wages, and the Internet stock market bubble. Greenspan’s belief in the self-correcting nature of markets led him to worry less than others. Given the painful consequences of the 2000s housing bubble, the Fed is highly unlikely to repeat that approach.
So for Americans in middle- and lower-paying jobs, prospects for rising wages going forward are slim.
Employment is the other potential source of rising earnings. Indeed, as I noted in chapter 2, it’s the chief reason there has been any increase at all in household incomes since the 1970s. We also need employment to fund generous social programs. Tax rates need to increase, as I discuss in chapter 4, but we also need a larger tax base, in the form of more people employed.54 About 85 percent of prime-working-age males and 70 percent of prime-working-age females were employed as of 2010. We may see no further increase among prime-age men, but among women and the near elderly (aged 55–64) there is substantial room for growth.
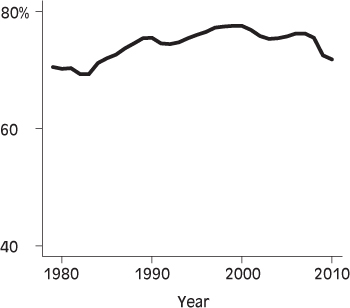
The United States has a set of institutions and policies that in theory should be conducive to rapid employment growth: a low wage floor, limited labor market regulation, relatively stingy government benefits, and low taxes. Up to the turn of the century, we were comparatively successful. As figure 3.8 shows, during the 1980s and 1990s the employment rate among 25- to 64-year-olds rose by seven percentage points—better than most other rich nations.55 Some commentators labeled our economy the “great American jobs machine.”
But in the 2000s the bloom fell off the rose.56 The early years of recovery after the 2001 recession featured feeble job growth, and things didn’t improve much after that. By the peak year of the 2000s business cycle, 2007, the employment rate had not yet reached its prior peak.57 And during the subsequent economic crash nearly all the progress of the 1980s and 1990s was erased.
What happened? We don’t know. It may be that economic and institutional forces—strong competition, the shareholder value orientation in corporate governance, Wall Street’s appetite for downsizing, weakened unions—have made management reluctant to hire.58 Perhaps it was manufacturing jobs fleeing to China and service jobs shifting to India.59 Or perhaps the computer-robotics revolution finally began to hit full force.60 Maybe it was a combination of these and other factors. Whatever the cause, it doesn’t bode well for employment going forward.
FIGURE 3.8 Employment rate
Employed share of persons aged 25 to 64. The vertical axis does not begin at zero. Data source: OECD, stats.oecd.org.
So there is reason to worry about both wages and jobs. What can we do? Let’s begin with employment.61 First, adequate demand is essential. When our economy finally emerges from the aftermath of the great recession, it may struggle in the absence of a 1990s- or 2000s-style stock market or housing bubble to fuel consumer spending. Rising living standards in developing nations should help by boosting American exports, and government job creation can enhance domestic spending. But demand is a significant question mark going forward. Second, as I suggested earlier, high-quality, affordable early education would help by facilitating mothers’ employment. Third, we would do well to expand provision of individualized assistance for those who struggle in the labor market. This is expensive, but it helps.62 Fourth, government can directly promote job creation by subsidizing private-sector job growth and creating public-sector jobs.63
The better our educational system, the more Americans are likely to work in professional analytical jobs. But a nontrivial share of the jobs in our future economy will be low-end ones.64 Rather than fight this, we should embrace it. As we get richer, most of us are willing to outsource more tasks we don’t have the time or expertise or desire to do ourselves—changing the oil in the car, mowing the lawn, cleaning, cooking, caring for children and other family members, and much more. This can be a win-win proposition if we approach it properly. We need more Americans teaching preschool children, helping people find their way in the labor market and transition to a new career in midlife, and caring for the elderly.65 Improved productivity and lower wage costs abroad reduce the price we pay for manufactured goods and some services. This enables us to purchase more helping-caring services and more of us to work in helping-caring service jobs.66
But some of these jobs, perhaps many of them, won’t pay enough to ensure a good standard of living. And as I’ve noted, the experience of the past several decades suggests that pay likely won’t improve over time.
The solution has two parts. First, we should increase the minimum wage a bit and, more important, index it to prices so that it keeps pace with the cost of living.
The second element is a government program that can compensate for stagnant or slowly-rising wages in a context of robust economic growth—insurance against decoupling, if you will.67 We could do this by building on the EITC. The ideal, in my view, would be to give it to individuals rather than households, increase the benefit amount for those with no children, give it to everyone with earnings rather than only to those with low income, and tax it if household income is relatively high. Most important, we could index it to average compensation or to GDP per capita.68 This would help restore the link between growth of the economy and growth of household incomes.69
The real value of the minimum wage and the restructured EITC will need to be adjusted periodically. Rather than relying on Congress and the president to come to agreement, I recommend delegating this task to an independent board, similar to the Federal Reserve board and the new Independent Payment Advisory Board for Medicare in that its members would be nominated by the president and confirmed by the Senate but it would have independent decision-making authority.
I’ve outlined a number of new programs and some expansions of existing ones that would enhance economic security, expand opportunity, and ensure rising living standards for Americans. They include the following:
• Universal health insurance
• One year of paid parental leave
• Universal early education
• Increased Child Tax Credit
• Sickness insurance
• Eased eligibility criteria for unemployment insurance
• Wage insurance
• Supplemental defined-contribution pension plans with automatic enrollment
• Extensive, personalized job search and (re)training support
• Government as employer of last resort
• Minimum wage increased modestly and indexed to prices
• EITC extended farther up the income ladder and indexed to average compensation or GDP per capita
• Social assistance with a higher benefit level and more support for employment
• Reduced incarceration of low-level drug offenders
• Affirmative action shifted to focus on family background rather than race
• Expanded government investment in infrastructure and public spaces
• More paid holidays and vacation time
The American economy’s performance in coming decades is likely to be similar to what we’ve experienced since the 1970s: reasonably healthy economic growth, a modest increase in the employment rate, a rise in the likelihood of losing a job, little or no improvement in inflation-adjusted wages for earners in the lower half, growing inequality of market household incomes, and little rise in wealth for middle- and low-income households. Economic pressures will continue to intensify. Risks will continue to grow. Families, civic organizations, and unions will remain weak. In this context, the policies I’ve recommended here won’t eliminate the problems of economic insecurity, inadequate opportunity, or slow income growth. In fact, they might not fully compensate for these adverse shifts in our economy and society. Better policies won’t guarantee better outcomes.
But these policies will help. Americans from less advantaged homes will have cognitive skills and noncognitive traits that give them a better shot at successfully entering and staying in the labor market and at having a long-lasting family relationship. Those who lose a job will have a stronger incentive to take another job even if it pays less, and they will have more help in finding one. Individuals unable to function effectively or continuously in the labor market, whether working age or elderly, will have a higher income. No one will have to fear lack of access to medical care, and fewer will face a massive out-of-pocket expense resulting from such care. Expanded provision of public goods and services will enhance economic security and take the edge off rising income inequality for those at the low end of the scale. A steady rise in the EITC will ensure that more of our economic growth reaches households in the middle and below.
How much will all this cost? That depends on the structure and generosity of the policies, and it isn’t my aim to offer recommendations at that level of specificity. As a ballpark estimate, I suggest we think in terms of 10 percent of GDP to cover the cost of new programs, the expansion of existing ones, and the rise in the cost of Social Security and Medicare that will come from population aging.
Can we afford it? Will this “social democratic” approach require sacrificing other elements of a good society? Are there attractive alternatives? Can these proposals get passed in our political system? I answer these questions in chapters 4 and 5.