Users with Power BI Pro licenses can connect to datasets hosted in the Power BI service from both Power BI Desktop and Microsoft Excel. Either of these tools will display the fields list of tables and measures for the dataset and, based on the report visuals created (for example, pivot tables), send queries to Power BI for execution by the source dataset. In the case of Power BI Desktop, these reports can be published back to the Power BI service and will retain their connection to the dataset, as recommended in the Live connections to Power BI datasets section of Chapter 11, Creating and Formatting Power BI Reports.
Excel reports based on these connections, however, currently do not retain their connection and thus cannot be refreshed or interacted with in the Power BI service. Despite this limitation, and the many additional analytical and visualization features of Power BI Desktop, Excel remains a very popular tool given its inherent flexibility and its mature, familiar features. Power BI's deep support for Excel, including both Analyze in Excel and the Power BI publisher for Excel, is an advantage over other BI platforms.
Additionally, the limitation of external data connections from Excel in the Power BI service is expected to be removed in 2018. The Power BI Report Server, for example, already supports Excel workbooks with Live connections as described in the Office Online Server for Excel workbooks section in Chapter 16, Deploying the Power BI Report Server.
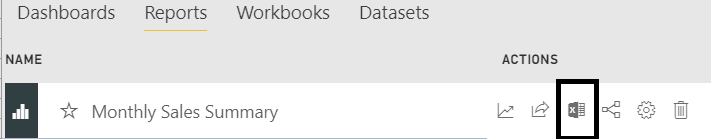
The Analyze in Excel feature is exposed as an action for Power BI reports via an Excel workbook icon in the Power BI service. The action is accessible in both app workspaces and in published apps for Power BI Pro users. In the following example from an app workspace, the option to analyze the Monthly Sales Summary report in Excel is available on the right:
Clicking the Analyze in Excel icon provides a Microsoft Office Data Connection (ODC) file that can be saved to the local machine. By default, opening this file launches Excel with a connection to the source dataset of the Power BI report. For example, even though the Monthly Sales Summary may only utilize a few measures and columns of the dataset, the entire fields list of the dataset will be exposed with a pivot table connection in Excel, as shown in the following screenshot:
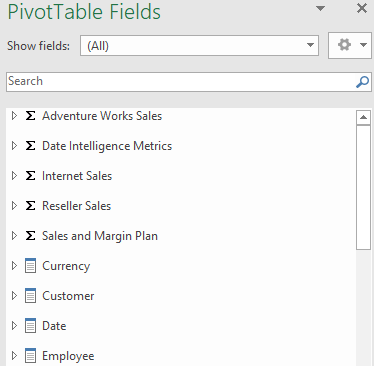
Similar to the fields list in Power BI Desktop, Excel positions tables with only measures visible at the top of the list preceding the dimension tables. Just like standard Excel pivot tables, users can drag measures and columns to the field wells to structure each pivot table report. Right-clicking a column name, such as Employee department, presents the option to add the column as a slicer.
Just like interacting with a Power BI report, any RLS roles applied on the source dataset will be enforced on the user's report queries generated from Excel. The Excel workbook and any reports created based on the connection can be saved and shared like other Excel workbooks. However, for other users to refresh and query the source dataset from Excel, they will need access to the app or app workspace, a Power BI Pro license, and will need to be mapped to a security role if RLS has been configured.