Between 1932 and 1936, Franklin Delano Roosevelt forged an electoral coalition that dominated American politics for more than half a century. In response to the Great Depression, and backed by huge Democratic majorities in the Senate and the House of Representatives, Roosevelt pushed through an ambitious legislative agenda that greatly enlarged the scope and power of the federal government. The New Deal did not end the economic crisis. That did not happen until the outbreak of World War II in Europe prompted the federal government to undertake a massive program of military mobilization and deficit spending, which it expanded after the U.S. entry into the war in late 1941. Yet even though it did not end the Great Depression, the New Deal alleviated the suffering of millions of Americans and gave them hope for a better future.1
At its core, Roosevelt’s electoral coalition consisted of three groups that bore the brunt of the Great Depression—white southerners, northern white ethnics, and the northern white working class. His policies also appealed to another group that was very hard hit: African-Americans.2 During the 1930s, for the first time since the Civil War, African-Americans began to switch their party allegiance from the Republican Party to the Democrats. For many years, however, the impact of this shift was limited because most African-Americans still resided in the states of the old Confederacy, where a combination of legal obstacles, economic pressures, and physical intimidation prevented most of them from voting.
The New Deal coalition gave Democrats the upper hand in American politics for more than fifty years. After Roosevelt’s death, while the Democrats’ dominance faded at the presidential level, it persisted for decades in Congress. Between 1949 and 1991, Democrats controlled the U.S. Senate for thirty-four of forty-two years and the House of Representatives for an astonishing forty of forty-two years. They also controlled most of the nation’s governorships and state legislatures. Still, between 1949 and 1989, Republicans won seven of eleven presidential elections, and four of those seven victories—1952, 1956, 1972, and 1984—were double-digit landslides. Only one Democratic victory—Lyndon Johnson’s defeat of Barry Goldwater in 1964—was a double-digit landslide.
The Democrats’ weakness in presidential elections, a defining feature of the postwar era in American politics, led some observers to speculate that Republicans had developed a lock on the Electoral College.3 Others saw an “emerging Republican majority,” based on the movement of Americans from the cities to the suburbs and from the Frost Belt to the Sunbelt that would eventually make the GOP into the dominant party in congressional as well as presidential elections.4
Elections after 1988 showed that there was no emerging Republican majority and no GOP lock on the Electoral College. However, the difficulties Democratic presidential candidates had between the 1950s and the 1980s were an important indicator of the fragility of the New Deal coalition. The Democrats’ major problem during this era, and especially after 1965, was finding a candidate who could hold together the disparate elements of the coalition. Once the immediate crisis of the Depression was over, conservative white southerners and ethnics began to realize that they had little in common with one another, or with the trade unionists and liberals who dominated the northern wing of the party.
To some extent, the Democrats were victims of their own success. The nation’s rising affluence after World War II meant that many who had benefited from the New Deal began to see themselves less as beneficiaries of public spending than as taxpayers supporting programs that benefited others—others who increasingly looked different from themselves and whose lifestyles many found disturbing. For many members of the new white middle class, the issue behind much of the unease was race.
The movement of millions of African-Americans from the South to the major cities of the Northeast and Midwest between the 1930s and 1950s, and the rapid enfranchisement of millions of African-Americans in the South after the passage of the Voting Rights Act in 1965, fundamentally changed the Democratic electoral base. The presidential election of 1964 marked a major turning point in American politics when, for the first time, a Democratic president, Lyndon Johnson, promised to use the power of the federal government to advance the cause of civil rights for African-Americans. His Republican challenger, Barry Goldwater, strongly opposed any effort by the federal government to alter the racial status quo in the South.
Johnson benefited from a booming economy and widespread public sympathy following the assassination of President John F. Kennedy, winning a landslide victory and carrying forty-four of the fifty states. But of the six states that voted for Goldwater, five—Alabama, Mississippi, Georgia, South Carolina, and Louisiana—were in the South. (The sixth was his home state of Arizona.) It was the first time since the end of Reconstruction that a Republican presidential candidate carried the old Confederacy.5 After 1964, African-American voters became the most reliably Democratic voting bloc in the nation and an increasingly important component of the party’s electoral coalition. Meanwhile, southern whites, though they did not immediately abandon the Democrats below the presidential level, showed a growing inclination to vote Republican in presidential elections, especially when the Democratic candidate came from the party’s liberal, northern wing. While it would take several decades for the South to become a Republican stronghold at all levels, the 1964 election clearly marked the end of the one-party Democratic South.6
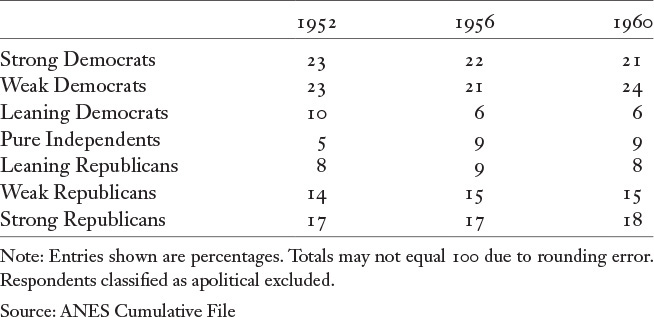
In spite of Dwight D. Eisenhower’s landslide victories over Adlai Stevenson in the presidential elections of 1952 and 1956, the data from the ANES surveys of 1952–1960 show that throughout this era, Democrats enjoyed a large and stable advantage over Republicans in party identification (table 2.1). In all three surveys, between 43 and 46 percent of voters identified with the Democratic Party, while 31 to 33 percent identified with the Republican Party. About 40 percent of voters identified strongly with a party, slightly fewer identified weakly with a party, and fewer than 25 percent of voters considered themselves independents. About the only things that changed between 1952 and 1960 were a small decline in the percentage of independents leaning toward the Democratic Party and a small increase in pure independents—voters with no party preference. These swings were much too small to change the overall picture of the electorate. Most voters readily identified with one of the two major parties, and the persistent effect of the New Deal realignment meant that many more identified as Democrats than as Republicans.
TABLE 2.1. PARTY IDENTIFICATION OF VOTERS IN 1952, 1956, AND 1960 ELECTIONS
The lasting effects of the New Deal realignment can also be clearly seen in the size and party identification of several major demographic groups in the 1952–1960 ANES surveys (table 2.2). The most dramatic difference between the electorate of the 1950s and today’s is its racial composition: the electorate of the 1950s was overwhelmingly white. The only significant nonwhite group was African-Americans—the ANES survey did not even count other racial groups until 1972. But while African-Americans made up about 9 percent of the voting-age population in these three elections, they were only 5 percent of the actual voters. Moreover, there was little difference between the Democratic and Republican coalitions. Both were overwhelmingly white: African-Americans made up only 6 percent of Democratic voters and just 2 percent of Republican voters.
During these years, despite the migration of millions of African-Americans from the South to the industrial states of the North, the greatest concentration of black citizens still lived in the southern states. According to the 1952–1960 ANES surveys, African-Americans made up almost one-fifth of the voting-age population in the South during the 1950s compared with only 6 percent in the North. Even so, they constituted only 5 percent of actual voters in the eleven states of the old Confederacy. Before the Voting Rights Act of 1965, only 16 percent of southern blacks were able to overcome the numerous obstacles to registration and voting, and actually cast ballots.
TABLE 2.2. PARTY IDENTIFICATION OF VOTING GROUPS, 1952–1960
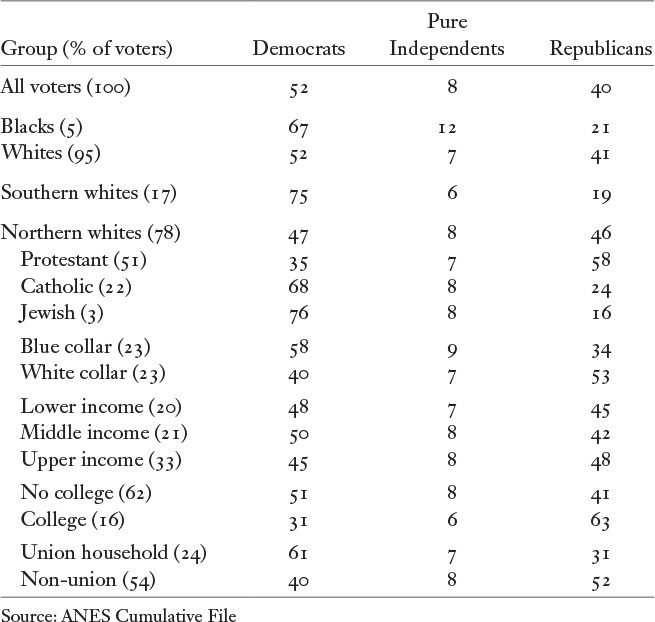
That figure of 16 percent, however, conceals a dramatic difference in black voter participation between the Rim South and the Deep South.7 In the Rim South states of Arkansas, Florida, North Carolina, Tennessee, Texas, and Virginia, where blacks made up only 13 percent of the voting-age population, 31 percent of African-Americans reported voting in presidential elections. Blacks made up about 6 percent of the electorate in these states. Things were very different in the Deep South states of Alabama, Mississippi, Georgia, South Carolina, and Louisiana. In these five states, where blacks made up a third of the voting-age population and were therefore a much greater potential threat to white political domination, they were almost completely disenfranchised. A combination of poll taxes, literacy tests, economic pressure, and physical intimidation kept almost all black citizens out of the voting booth. In these five states, only 4 percent of African-Americans reported voting in presidential elections in the 1950s, and blacks made up just 3 percent of voters. The region of the United States with by far the greatest concentration of African-American citizens had a nearly lily-white electorate.8
White southerners were the most Democratic voting group in the American electorate during this era: only 19 percent of southern whites identified with or leaned toward the Republican Party, while 75 percent identified with or leaned toward the Democrats. White southerners formed one of the largest components of the Democratic electoral coalition during the 1950s, making up almost one-fourth of all Democratic voters and outnumbering African-American voters by a four-to-one margin. It is easy to see why Democratic presidents and congressional leaders, fearful of alienating a core constituency, were reluctant to embrace the cause of civil rights.
The other major pillars of Roosevelt’s New Deal coalition were northern white ethnics and northern white working-class voters, and both of these groups continued to identify with the Democratic Party by a wide margin during the 1950s. Democrats outnumbered Republicans among northern white Catholics and Jews by 44 points and 60 points, respectively. White blue-collar workers in the North backed Democrats by a 24-point margin, and members of white union households in the North backed them by a 30-point margin. On the other side, the most Republican voting groups in the nation were college-educated northern whites, a rather small group during that era, and the much larger group of northern white Protestants. Among northern white Protestants, Republicans outnumbered Democrats by 58 percent to 35 percent. Even so, northern white Protestants who were members of union households leaned Democratic by a margin of 49 percent to 43 percent. Among northern white Protestants who were not members of union households, Republicans outnumbered Democrats by 63 percent to 30 percent. White-collar workers in the North also favored Republicans during the 1950s, but by a narrower margin, 53 percent to 40.
During this era, northern white voters showed very little difference in party support based on family income. Republicans outnumbered Democrats by a margin of 51 percent to 43 percent among northern white voters with family incomes in the bottom sixth of the national income distribution. The only more Republican category was the very small group of voters in the top five percent of the income distribution, where Republicans outnumbered Democrats by 68 percent to 25 percent. The Democratic advantage among lower-middle- to upper-middle-income northern whites during this period may reflect the fact that many working-class voters, especially those who were unionized, enjoyed strong income gains during the postwar years. Only 15 percent of northern white voters in union households had family incomes in the bottom third of the national income distribution during the 1950s, compared with 32 percent of northern white voters who were not in union households.
The characteristics that did not divide Democrats and Republicans during the 1950s are just as revealing as those that did divide them. Democrats and Republicans in the 1950s were not divided by gender, marital status, or religiosity. The gender gap of the late twentieth and early twenty-first centuries, in which women were markedly more Democratic than men, did not exist in the ’50s. In fact, women were slightly more Republican. Among men, Democrats outnumbered Republicans by 54 percent to 37 percent; among women, 51 percent to 42 percent.
There was also no marriage gap. The percentage of voters who were unmarried was much smaller than today—only 19 percent compared with 43 percent in the 2004–2012 elections. Moreover, instead of tilting Democratic, unmarried voters were somewhat more likely to identify as Republicans than married voters. Among married voters, Democrats outnumbered Republicans by 53 percent to 39 percent; among unmarried voters, 51 percent to 42 percent.
Finally, the “God gap” was also practically nonexistent. Very religious voters, unlike those today, did not tilt more toward the Republican Party than those who were less religious. Among voters who reported attending religious services regularly, Democrats outnumbered Republicans by 54 percent to 39 percent; among those who reported seldom or never attending religious services, the figures were 54 percent and 38 percent. The absence of a religiosity divide reflects the fact that issues such as abortion and gay rights had not yet emerged on the political scene.9
The most important difference between the American party system during the 1950s and that of today is that the parties in the fifties were much less ideologically aligned: liberals and conservatives were found in considerable numbers in both parties. Because of southern whites’ traditional attachment to the Democratic Party and the exclusion of most African-Americans from the electorate, the Democratic coalition must have included a large proportion of conservative voters. Unfortunately, the ANES surveys did not yet ask voters their ideological leanings, mainly because the researchers who conducted these surveys assumed that few voters had them. In 1972, when the ANES did begin asking voters whether they called themselves conservative or liberal, the ideological divide between Democrats and Republicans turned out to be rather modest. It seems likely that it would have been even smaller in the 1950s.
Based on the distribution of party identification, the New Deal coalition seemed to be alive and well during the 1950s. All of the major voting groups that had supported Roosevelt during the 1930s and ’40s continued to identify strongly with the Democratic Party, giving the Democrats a substantial advantage in party identification over Republicans. However, when it came to the actual election results, the picture was quite different. The regional and ideological diversity of the Democratic coalition made it hard for Democratic presidential candidates to hold them all together.
In both 1952 and 1956, massive Democratic defections enabled the Republican Eisenhower to defeat the Democrat Stevenson by landslide margins. In these two elections, according to the ANES data, between 25 and 30 percent of Democrats voted for Eisenhower, while fewer than 5 percent of Republicans voted for Stevenson. Even in 1960, when John F. Kennedy narrowly defeated Richard Nixon to take back the White House for the Democrats, 18 percent of Democrats defected to Nixon while only 8 percent of Republicans went to Kennedy.
In these three elections, Democrats suffered large-scale defections in almost every major voter group that made up Roosevelt’s New Deal coalition. The only exception was Roman Catholics in 1960, who voted overwhelmingly for Kennedy, the first Catholic presidential candidate since 1928. The largest crack in the New Deal coalition during this era was found in the white South. In all three elections, southern whites defected at a noticeably higher rate than northern whites: the average defection rate in the two Eisenhower-Stevenson elections was 36 percent for southern whites versus 27 percent for northern whites. The difference was even greater in the 1960 Kennedy-Nixon contest: 32 percent for southern whites versus 14 percent for northern whites. The higher defection rate of southern whites suggests that there was an ideological component to Democratic defections, and even though ideological differences between the parties were muted, conservative Democrats were more likely to defect to Republican presidential candidates than liberal Democrats.
TABLE 2.3. VOTING PATTERNS FOR PRESIDENT AND U.S. HOUSE, 1952–1960
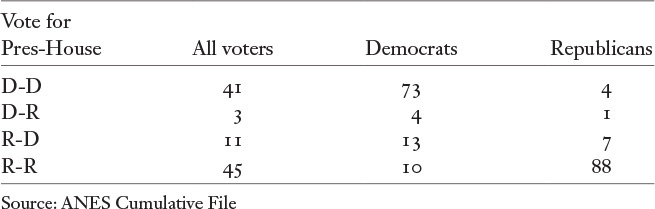
Despite the massive defections they suffered in these presidential elections, Democrats were able to win majorities in the U.S. Senate and House of Representatives in four of the five elections between 1952 and 1960, including the Eisenhower landslide of 1956. Looking at voting patterns for president and the House by party identification in the three presidential elections between 1952 and 1960 shows a trend toward asymmetric ticket splitting that would become even more pronounced in later elections (table 2.3). Only 14 percent of voters cast split-ticket ballots in the presidential and House contests during these years, but while 11 percent of voters chose a Republican presidential candidate and a Democratic House candidate, only 3 percent did the opposite. As a result, Democratic House candidates won an average of 52 percent of the vote in these elections, while Democratic presidential candidates won just 44 percent.
During the 1950s, Republicans displayed strong loyalty in both presidential and House elections, but they were somewhat more loyal in presidential elections—on average, 95 percent voted for Republican presidential candidates while 89 percent voted for Republican House candidates. Democrats, meanwhile, showed much greater loyalty in House elections than in presidential elections—an average of 86 percent voted for Democratic House candidates while only 77 percent voted for Democratic presidential candidates.
In congressional elections, Democrats could nominate candidates whose ideologies reflected the preferences of voters in each region. Democratic candidates in the South thus tended to be much more conservative than their counterparts in the North. This enabled Democrats to hold on to a majority of southern House and Senate seats until 1994. In presidential elections, however, Democrats could seldom find a single candidate who could appeal to their entire coalition. These difficulties became even greater after the passage of the Voting Rights Act in 1965, as the African-American electorate grew and Democratic candidates began openly courting the black vote.
In 1964, Lyndon Johnson put almost all of the pieces of FDR’s coalition back together and won a landslide victory over Arizona senator Barry Goldwater. Aided by a booming economy and an opponent who frightened both Republicans and Democrats with his bellicose statements on foreign policy and his attacks on New Deal programs, Johnson carried forty-four states and led Democrats to major gains in the congressional elections. Republicans were reduced to their smallest numbers in the House and Senate since Roosevelt’s 1936 landslide.10
For the first time in any ANES survey, Democrats in 1964 were more loyal to their party’s presidential candidate than Republicans: 88 percent of Democrats voted for Johnson while only 75 percent of Republicans voted for Goldwater. Johnson’s support was even greater among Democrats belonging to many of the core New Deal coalition groups: 93 percent of northern white Catholics, 95 percent of northern blue-collar workers, and 94 percent of northern whites in union households voted for him.
Only one major group from the New Deal coalition did not overwhelmingly support Johnson in 1964: white southerners. He won a majority of the vote among white southerners and carried six of the eleven states of the old Confederacy. However, according to the ANES survey, white southern Republicans were much more loyal to their party’s nominee than white southern Democrats: 76 percent of the latter voted for Johnson while 93 percent of the former voted for Goldwater, whose inroads among white Democrats in the South were one of the few bright spots for Republicans in an otherwise disastrous election.
The size and breadth of Johnson’s victory led some political observers to speculate about a new era of Democratic domination, and perhaps even the demise of the GOP as a nationally competitive party. Such speculation proved to be premature. Only two years later, in the 1966 midterm election, Republicans gained forty-seven seats in the House and three seats in the Senate. Four years later, they took back the White House as the New Deal coalition splintered badly. In 1968, according to ANES data, 20 percent of Democrats voted for the Republican Richard Nixon and 12 percent voted for former Alabama governor George Wallace, a staunch opponent of federal civil rights laws who ran as an independent. Among white northern Democrats, 23 percent voted for Nixon and 7 percent for Wallace; among white southern Democrats, 20 percent voted for Nixon and an astonishing 40 percent for Wallace.11 The Democrats did maintain control of both chambers of Congress, losing only five seats in the House and five seats in the Senate.
TABLE 2.4. VOTING PATTERNS FOR PRESIDENT AND U.S. HOUSE, 1968–1988
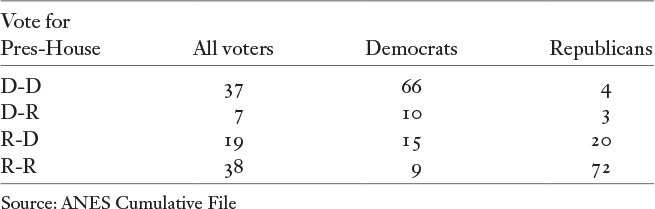
From 1968 to 1988, Jimmy Carter was the only Democrat to win a presidential election—which he did once, in 1976. Of the other five presidential elections, four were Republican landslides. Yet Democrats controlled the House of Representatives throughout this period and the Senate for fourteen out of twenty years. As these results suggest, these two decades were the heyday of ticket splitting, as seen in the patterns of presidential and House voting during this era. On average, 26 percent of voters split their ticket for president and the House, almost double the 14 percent rate that prevailed between 1952 and 1960 (table 2.4). Moreover, the degree of asymmetry in ticket splitting was even more striking than during the fifties. Almost three times as many voters chose a Republican presidential candidate and a Democratic House candidate as did the reverse.
When we compare the voting patterns of Democrats and Republicans during this era, we see that Republicans were much more loyal than Democrats in presidential elections while Democrats were somewhat more loyal than Republicans in House elections. In presidential elections, Democrats defected at three times the rate of Republicans. On average, 92 percent of Republicans voted for Republican presidential candidates while only 76 percent of Democrats voted for Democratic presidential candidates. But in House elections, Republicans defected more frequently: 81 percent of Democrats voted for Democratic candidates but only 75 percent of Republicans voted for Republican candidates.
TABLE 2.5. PERCENTAGE OF VOTERS LOYAL TO PARTY IN PRESIDENTIAL ELECTIONS, 1968–1988
Group |
Democrats |
Republicans |
All voters |
75 |
91 |
African-Americans |
94 |
53 |
Whites |
70 |
92 |
South |
58 |
96 |
North |
74 |
91 |
College |
73 |
93 |
No college |
69 |
91 |
Blue collar |
70 |
89 |
White collar |
72 |
93 |
Union household |
75 |
90 |
Non-union household |
68 |
92 |
Protestant |
70 |
91 |
Catholic |
74 |
90 |
Jewish |
87 |
75 |
Liberal |
87 |
80 |
Moderate, none |
66 |
89 |
Conservative |
53 |
96 |
Note: Based on votes for the two major parties. Data on ideology are for 1972–1988 elections only. Source: ANES Cumulative File |
||
We can also compare the loyalty rates of various groups of Democratic and Republican voters in presidential elections between 1968 and 1988 (table 2.5). There were only three groups in which Democrats were more loyal than Republicans: African-Americans, Jews, and white self-identified liberals. These groups made up only a tiny fraction of the Republican electoral coalition because all three overwhelmingly identified with the Democratic Party. In sharp contrast, Republican loyalty greatly exceeded Democratic loyalty among voters in several groups that were major parts of the New Deal coalition, including white blue-collar voters, white members of union households, white Catholics and, most dramatically, white southerners. Between 1968 and 1988, only 58 percent of white southern Democrats, on average, voted for their party’s presidential candidates, while 96 percent of white southern Republicans voted for their party’s presidential candidates.
Democratic presidential candidates’ difficulty in holding together the New Deal coalition was largely due to the coalition’s ideological diversity. This can be seen very clearly in the rates of party loyalty among voters. Almost half of conservative Democrats and over a third of moderate Democrats in these elections voted for Republican presidential candidates. In contrast, the defection rate among liberal Democrats was only 13 percent. And while liberal Republicans also defected at a higher rate than moderate or conservative Republicans, they were a much smaller part of the Republican coalition—only 7 percent of Republican voters identified as liberals, while 18 percent of Democratic voters identified as conservatives—and liberal Republicans’ defection rate was much lower than that of conservative Democrats.
Ideology largely explains the extraordinarily high defection rate among white southern Democrats in presidential elections. During this era, conservatives outnumbered liberals by 26 percent to 17 percent among white southern Democrats, while liberals outnumbered conservatives by 33 percent to 17 percent among white northern Democrats. Among the southerners, the defection rate in presidential elections between 1968 and 1988 averaged 58 percent among conservatives, 44 percent for moderates, and only 16 percent for liberals.
One of the most striking features of elections in the United States between 1968 and 1988 was the disconnect between presidential and congressional elections. Despite their difficulties in gaining the presidency, Democrats continued to enjoy considerable success in congressional elections. In eleven elections between 1968 and 1988, Democrats won an average of 60 percent of all House seats and 70 percent of southern House seats. They won an average of 57 percent of the vote in House elections during this era. However, that average conceals a wide variation: they won 70 percent of the vote in House elections in the South, but only 53 percent in House elections in the North. Thirty-eight percent of southern Republicans voted for Democratic House candidates, while only 14 percent of southern Democrats voted for Republican House candidates. In the North, Democratic and Republican defection rates were almost identical: 22 percent of Republicans voted for Democratic House candidates, and 20 percent of Democrats voted for Republican House candidates.
The explanation for southern Republicans’ extraordinarily high defection rates during this era is very simple: incumbency. Comparing the defection rates of Democrats and Republicans in House elections between 1972 and 1988 by region and incumbency status shows that the higher loyalty rate of Democratic voters in the South was due entirely to the advantage of incumbency (table 2.6).12 Democratic and Republican voters in both the South and the North were equally loyal in contests involving incumbents from their own party, open-seat contests, and contests involving the opposing party’s incumbents. However, the proportion of Republican voters in districts with Democratic incumbents was much greater than the proportion of Democratic voters in districts with Republican incumbents, and this disparity was especially large in the South. Fifty-nine percent of southern voters lived in districts with Democratic incumbents, compared with only 51 percent of voters in the North; only 29 percent of voters in the South were in districts with Republican incumbents compared with 37 percent in the North.
TABLE 2.6. PERCENTAGE OF VOTERS LOYAL TO PARTY IN U.S. HOUSE ELECTIONS BY REGION AND INCUMBENCY STATUS OF CANDIDATES, 1972–1990
Group |
Democrats |
Republicans |
All voters |
82 |
73 |
Own party incumbent |
94 |
94 |
Open seat |
81 |
83 |
Opposing party incumbent |
52 |
51 |
North |
|
|
Own party incumbent |
93 |
94 |
Open seat |
79 |
81 |
Opposing party incumbent |
57 |
60 |
South |
|
|
Own party incumbent |
94 |
90 |
Open seat |
85 |
93 |
Opposing party incumbent |
46 |
50 |
Note: Incumbency status of House candidates not available in ANES data before 1972 Source: ANES Cumulative File |
||
Democratic control of the House of Representatives during this era was based on the ability of Democratic incumbents, especially southern Democratic incumbents, to win the support of Republican presidential voters. Between 1972 and 1988, an average of 30 percent of Republican presidential voters cast their ballots for Democratic House candidates; in districts with Democratic incumbents, 47 percent did so. In the North, an average of 28 percent of all Republican presidential voters and 43 percent of Republican presidential voters in districts with Democratic incumbents cast their ballots for Democratic House candidates. In the South, an average of 38 percent of all Republican presidential voters and 61 percent of Republican presidential voters in districts with Democratic incumbents cast their ballots for Democratic House candidates.
A key feature of the era of dealignment was voters’ willingness to cross party lines to support incumbents from the opposing party in congressional elections. About half of voters in both parties defected to opposing-party incumbents in House elections during this era. However, the main beneficiaries of these defections were Democratic incumbents, who greatly outnumbered Republicans.
Many of these Democrats, especially in the South, were able to hold on to their seats even though the voters in their districts regularly supported Republican presidential candidates. In 1988, an astonishing 99 percent of incumbent Democrats in House districts carried by the Republican presidential candidate George H. W. Bush won reelection, including 54 of 55 incumbent Democrats in southern House districts carried by Bush. In the 101st Congress (1989–1991), 135 of 260 House Democrats, including 60 of 77 from the South, represented districts carried by the Republican presidential candidate in 1988.
As the 1980s ended, there was little reason to believe that the Democrats’ domination of Congress was in danger. They had controlled the House for forty-five consecutive years and the Senate for thirty-nine of those forty-five years. In the 101st Congress, which was elected in 1988, they held 260 of 435 seats in the House and 55 of 100 seats in the Senate. Within a few years, however, two developments would bring the era of Democratic domination to an end—secular realignment within the electorate, and the nationalization of congressional elections.
Democrats continued to outnumber Republicans in the American electorate during the 1980s. By the end of the decade, however, the Democratic advantage had decreased considerably. With leaning independents included with regular party identifiers, Democrats outnumbered Republicans by only three percentage points in 1984 and by two points in 1988. These were the first two surveys in the history of the ANES in which the Democratic advantage fell into the single digits.
Large as it was, the decline in the Democratic advantage in party identification between 1952 and 1988 does not show the true significance of changes in partisanship over these decades. For that, it is necessary to look at changes below the level of the entire electorate. There were dramatic differences in the direction and magnitude of change in party identification among major groups within the electorate, including some key parts of the New Deal coalition. The Democratic and Republican electoral coalitions of the late 1980s looked very different from the Democratic and Republican electoral coalitions of the 1950s (table 2.7).
By far the most important shift in the composition of the party coalitions involved race. Among white voters over these three decades, an 11-point Democratic advantage became a 10-point Republican advantage. Among African-American voters, a 46-point Democratic advantage became an 80-point Democratic advantage. At the same time, the nonwhite share of the electorate was growing steadily: African-Americans and other nonwhites went from only 5 percent of the electorate in the 1952–1960 elections to 18 percent in the 1984–1988 elections.
The result of these combined trends was a sharp increase in the racial divide between the parties. According to the ANES data, in the 1952–1960 elections, both parties’ supporters were overwhelmingly white: nonwhites made up only 7 percent of Democratic voters and only 2 percent of Republican voters. By the 1984–1988 elections, nonwhites made up 29 percent of Democratic voters and 7 percent of Republican voters. During these years, nonwhite voters went from being a minor part of the Democratic electoral coalition to a large and important one.
TABLE 2.7. CHANGE IN PARTY IDENTIFICATION OF VOTER GROUPS BETWEEN 1950s AND 1980s
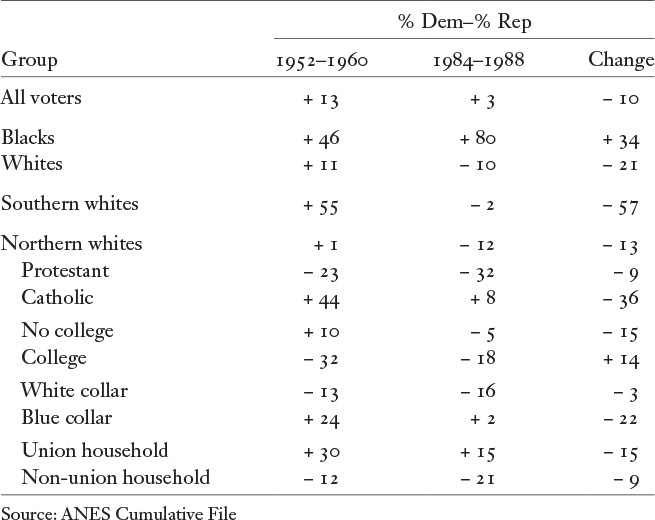
Between the 1952–1960 elections and those of 1984–1988, the Democratic advantage in party identification declined in every major white group of the traditional New Deal coalition, including northern white Catholics and blue-collar workers. By far the most dramatic change, however, involved the loyalties of southern whites. At the same time that nonwhites were becoming a much larger part of the Democratic electoral coalition, white southerners were leaving it.
Among white southerners, over these three decades, a 55-point Democratic advantage in party identification turned into a two-point Republican advantage: among all southern white voters in the 1984–1988 elections, Republicans outnumbered Democrats by 46 percent to 44 percent. Moreover, there was a large generational divide. Among white southerners aged forty-five and older, Democrats outnumbered Republicans by 52 percent to 38 percent. However, among those under forty-five, Republicans outnumbered Democrats by 53 percent to 37 percent. This age gap made the realignment of the white South almost certain to continue.
Between the 1952–1960 elections and the 1984–1988 elections, the southern white share of Democratic voters in the nation fell from 24 percent to 16 percent, while the nonwhite share rose from 7 percent to 29 percent. In the 1952–1960 elections, white southerners outnumbered nonwhites among Democratic voters by more than a three-to-one margin; among Democratic voters in the 1984–1988 elections, nonwhites outnumbered white southerners by nearly two to one. The consequences of this shift for Democratic Party leaders and candidates would eventually be profound. A combination of demographic shifts in the voting-age population and secular realignment within the electorate meant that the influence of the most conservative element of the Democratic coalition was clearly waning, while the influence of the most progressive element, at least on racial and social welfare issues, was growing.
The consequences of secular realignment become even more apparent when we break down the shifts in white voters’ party identification by ideology between 1972 and 1988, among all white voters in general and among northern and southern white voters in particular. We begin in 1972 because the ANES survey of that year was the first one to ask about ideological identification. The shifts in party identification among white voters over this sixteen-year period were strongly related to ideology (table 2.8). Among both northern and southern whites, Republican gains were concentrated very heavily among self-identified conservatives. The change was especially dramatic among conservative southern whites: in 1972, they favored the Democratic Party by a five-point margin, but by 1988, they favored the Republicans by 41 points. The shift among northern white conservatives was smaller because they were already solidly in the GOP camp in 1972. Nevertheless, the Republican advantage among this group grew from 40 points to 62 points over these sixteen years.
TABLE 2.8. CHANGE IN PARTY IDENTIFICATION OF IDEOLOGICAL GROUPS AMONG WHITE VOTERS, 1972–1988
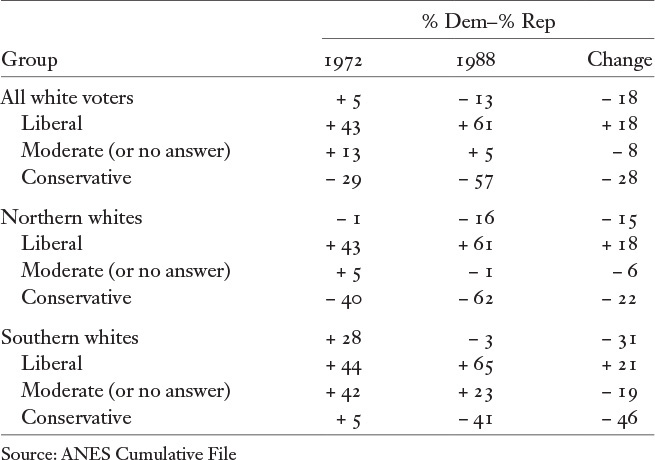
These figures show that while conservative whites were moving decisively toward the Republican Party, moderate whites shifted in the same direction, but much less dramatically. What really stands out, though, is that liberal whites in both North and South were moving in the opposite direction. Among liberal northern whites, the Democratic advantage in party identification grew from 43 points to 61 points, and among liberal southern whites, it grew from 44 points to 65 points. The result of these shifts was that the relationship between ideology and party identification was considerably stronger in 1988 than in 1972, especially in the South. In terms of shared variance, the relationship between ideology and party identification was about twice as strong in 1988 as in 1972 among northern whites, but about seven times as strong among southern whites.
As the Democratic Party grew increasingly dependent on votes from nonwhites during the 1970s and 1980s, large numbers of white voters fled to the GOP. This white flight had a clear ideological component: it was heavily concentrated among conservatives. This shift occurred in both the North and the South, but it was especially dramatic in the South because the residual loyalty of many conservative whites there meant that the party had more of them to lose.
As late as 1972, eight years after Lyndon Johnson’s election on a pro–civil rights platform and seven years after the passage of the Voting Rights Act, the large majority of southern white voters and a plurality of southern white conservatives still identified with the Democratic Party. By 1988, however, a plurality of all southern white voters and the large majority of southern white conservatives had abandoned their parents’ and grandparents’ party and moved into the Republican camp. However, even as the Republican presidential candidate, George Bush of Texas, swept every southern state in 1988, Democrats retained an overwhelming majority of U.S. House and Senate seats along with every governorship, every state legislative chamber, and almost every state and local elected office in the South. Democratic dominance of southern congressional seats was the key to their control of the House and Senate. For that dominance to end, Republicans had to develop a strategy for converting their advantages in party identification and presidential voting into victories below the presidential level. They had to find a way to nationalize down-ballot elections. Starting in 1994, they did just that.