Electoral competition in the United States has changed dramatically in recent years. Patterns of competition between the two major parties in the twenty-first century are very different from those that prevailed as recently as the 1990s. Compared with the patterns of competition that prevailed for half a century following World War II, the present era is distinguished by three main characteristics. First, at the national level, there is a close balance of support for the two major political parties, resulting in intense competition for control of Congress and the White House. Second, despite the close balance at the national level, there is widespread one-party domination of elections at the state and local level. Third, election outcomes show a very high degree of consistency over time and across different types of races. State and local elections have been increasingly nationalized: their outcomes now closely reflect the outcome of the presidential election. These characteristics are closely related. All of them reflect the central underlying reality of American electoral politics: today’s electorate is strongly partisan because it is deeply divided along racial, ideological, and cultural lines.1
Recent national elections in the United States have been highly competitive. There have been regular shifts in party control of both chambers of Congress and the White House, and popular vote margins in presidential elections have been relatively close. Frequent changes in party control of the presidency are not a new phenomenon. Between 1948 and 1992, the White House changed hands in 1952, 1960, 1968, 1976, 1980, and 1992. However, party control of the House of Representatives and the Senate was much more stable, shifting only in 1952 and 1954 in the case of the House, and only in 1952, 1954, 1980, and 1986 in the Senate. Democrats controlled the House of Representatives for forty consecutive years between 1954 and 1994, and the Senate for thirty-four of those years. Since then, however, the House has changed hands three times—in 1994, 2006, and 2010—and the Senate has changed hands five times, in 1994, 2001 (because of a party switch by one Republican senator), 2002, 2006, and 2014.
Majorities in both chambers have generally been smaller than they were during the four decades when Democrats enjoyed almost continuous control of the legislative branch. During the heyday of Democratic domination, between the 84th Congress (1955–1957) and the 103rd (1993–1995), the average Senate majority was 58 seats and the average House majority was 261 seats. In contrast, between the 104th Congress (1995–1997) and the 113th Congress (2013–2015), the average Senate majority was only 54 seats and the average House majority only 232 seats. These smaller majorities meant that party control of both chambers was at stake in almost every election.
While changes in party control of the White House occurred frequently between the 1950s and 1990s, many elections during those years were decided by very large popular vote margins. The popular vote margins in recent presidential elections have been narrower. Of course, there have been closely contested presidential elections throughout American history, but there have also been many landslides in which one candidate defeated his opponent by ten percentage points or more in the popular vote. During most of the twentieth century, landslide elections were the rule and not the exception. Ten of the seventeen presidential elections between 1920 and 1984 were won by a double-digit margin. However, since Ronald Reagan’s 18-point drubbing of Walter Mondale in 1984, there has not been a landslide presidential election. The average popular vote margin in presidential elections fell from 13.9 percentage points between 1920 and 1984 to only 5.1 percentage points between 1988 and 2012. Not since the late nineteenth century has the United States had such a long series of closely contested presidential elections.
Recent presidential elections have not only been considerably closer on average than earlier ones but also more stable. Through most of the twentieth century, it was not unusual for the popular vote margin between the Democratic and Republican candidates to fluctuate widely from one election to the next. Between 1928 and 1932, for example, the Republican share of the national popular vote fell from over 58 percent to less than 40 percent. The five elections between 1956 and 1972 included Republican landslides in ’56 and ’72, a Democratic landslide in ’64, and closely contested elections in ’60 and ’68. The party vote shares in recent presidential contests have varied a good deal less.
In order to examine trends in competition in the sixteen presidential elections between 1952 and 2012, I divided them into four eras of four elections each: 1952–1964, 1968–1980, 1984–1996, and 2000–2012. For each era, I calculated the average popular vote margin of the winning candidate and the standard deviation of the margin of victory or defeat of the Democratic candidate (table 5.1). The data show a striking pattern. The elections during the first era, between 1952 and 1964, show both the largest average margin of victory and the largest standard deviation. Average margins of victory and standard deviations were somewhat smaller in the second and third eras, but the most dramatic change occurs in the most recent era. The four presidential elections between 2000 and 2012 have had by far the closest average margins of victory and by far the smallest variability from election to election of any of the four eras. In fact, the four most recent presidential elections had the closest popular vote margins and the least election-to-election variability of any set of four consecutive presidential elections in the past century. To find a series of presidential elections with outcomes as close and as stable as these, you have to go back to the last quarter of the nineteenth century.
TABLE 5.1. COMPETITION IN U.S. PRESIDENTIAL ELECTIONS SINCE 1952
Elections |
Average winning margin |
Standard deviation |
1952–1964 |
12.5 |
17.3 |
1968–1980 |
9.0 |
11.9 |
1984–1996 |
9.8 |
12.1 |
2000–2012 |
3.5 |
4.4 |
Note: Entries shown are percentages. Source: uselectionsatlas.org |
||
Despite the competitiveness of presidential and congressional elections, there has been a marked decline in the competitiveness of elections at the state and local levels. There are far fewer swing states and congressional districts, and far more strongly Democratic and Republican states and districts now than in the 1960s and ’70s. What is striking about the presidential election of 2012 is that despite the closeness of the national popular vote, there were very few closely contested states. Only four states were decided by a margin of less than 5 percentage points—Florida, Ohio, Virginia, and North Carolina. Twenty-seven states, as well as the District of Columbia, were decided by at least 15 percentage points. Mitt Romney actually carried more states by landslide and near-landslide margins than Barack Obama, but the states Obama carried had far more electoral votes.
The 2012 results continued the recent pattern of presidential elections that are decided by narrow margins at the national level but by landslide or near-landslide margins in many states, including some of the most populous and electoral-vote-rich states in the country. Thus, President Obama carried California with its 55 electoral votes by 23 points, New York (29 electoral votes) by 28 points, and Illinois (20 electoral votes) by 17. Mitt Romney won Texas’s 38 electoral votes by a margin of 16 points.
This pattern of many deep red and blue states, including several of the nation’s most populous, represents a dramatic change from the pattern seen in close presidential elections during the 1960s and 1970s. In 1960 and 1976, when John F. Kennedy and Jimmy Carter won close, hard-fought battles for the White House, twenty states were decided by a margin of less than 5 percentage points. Moreover, in those elections almost all of the nation’s most populous states were closely contested. In 1976, states decided by less than 5 points accounted for 299 electoral votes, while states decided by 15 points or more accounted for only 66 electoral votes. In 2012, in contrast, states decided by less than 5 points accounted for only 75 electoral votes while states decided by 15 points or more accounted for 289.
Because there are so many deep red and blue states, it is easy to predict which party’s candidate will carry the large majority of states long before Election Day. Long before the Republican candidate in 2012 was known, there was very little doubt about how at least thirty-five states would cast their electoral votes. In the end, forty-eight of the fifty states along with the District of Columbia supported the same party in 2012 as in 2008. Only Indiana and North Carolina switched sides—both from the Democratic column to the Republican—between the two elections.
The decline in the number of competitive states has been paralleled by a similar trend at the congressional district level. Far more House districts today are dominated by one party and far fewer are closely divided. We can compare, for instance, presidential election results at the House district level in 1976 and 2012. Although the national margins of victory were similar, the results at the congressional district level were very different. In 1976, out of 435 House districts, one of the presidential candidates won by at least 20 percentage points in only 26 districts, while 187 districts were won by a margin of less than 5 percentage points. In 2012, a majority of House districts, 232 out of 435, were won by a margin of at least 20 percentage points in the presidential election, and only 47 were won by a margin of less than 5 percentage points. This change means that in the current Congress, unlike earlier Congresses, the majority of House members from both parties represent safe districts. These representatives have little need to be concerned about the views of voters from the opposing party. Instead, they worry about their own party’s primary voters, because the dominant party’s primary is the only election that matters in these districts—the winner is almost certain to win the general election.
Some political observers have attributed the recent decline in competitive districts to partisan gerrymandering. But a comparison of the partisan composition of House districts before and after redistricting in 1980–1982, 1990–1992, and 2000–2002 did not reveal significant differences in the districts’ competitiveness. Most of the decline in competitiveness actually occurred between redistricting cycles.2 An examination of redistricting at the state legislative level as well found that partisan gerrymandering had little impact on either competition or polarization.3 Moreover, as we have seen, competitiveness has also declined in statewide elections, even though state boundaries are fixed, and in county elections. The proportion of Americans living in “landslide counties,” those that one party’s presidential candidate carried by at least 20 percentage points, has been growing, while the proportion living in highly competitive counties has been shrinking.4 These trends clearly cannot be explained by clever line-drawing to protect incumbents. We have to look to deeper trends in American society.
The third major feature of recent electoral competition in the United States is a very high degree of consistency in voters’ preferences, and therefore in the outcomes of elections at the state and local levels as well as at the national level. Not only have the election-to-election swings in the national popular vote been much smaller than in earlier decades, they have also been exceptionally stable. Only two states, Indiana and North Carolina, switched sides between the 2008 and 2012 presidential elections—the smallest number of states to do so in consecutive presidential elections since the end of World War II. Moreover, the correlation between the Democratic share of the vote in 2008 and the Democratic share of the vote in 2012 across all fifty states and the District of Columbia was a remarkable .98. This was the strongest correlation between two consecutive elections in the postwar era. The Democratic share of the vote in 2008 almost perfectly predicted the Democratic share of the vote in 2012. And the correlation between the Democratic share of the vote in 2004 and the Democratic share of the vote in 2012, two elections eight years apart with totally different sets of candidates, was almost as large at .95. The correlations were just as strong at the congressional district and county levels.
Recent elections have also been marked by an extraordinary degree of consistency in electoral outcomes at different levels.5 The correlation between the Democratic share of the presidential vote and the Democratic share of the vote for U.S. House of Representatives across all districts with contested House races in 2012 was .95. This was the highest correlation between presidential and U.S. House election results in the post–World War II era. Only 25 out of 435 House districts were won by a candidate from the opposite party from the presidential candidate who carried that district. In the 113th Congress, only 16 Republicans represented districts carried by Barack Obama, and only 9 Democrats represented districts carried by Mitt Romney. And this pattern continued to hold in the 115th Congress, which was elected in 2016. In 2017, only 23 Republicans represented districts carried by Hillary Clinton, while only 12 Democrats represented districts carried by Donald Trump.
Although results of Senate elections have not been quite so consistent with presidential voting, there has been a marked increase in the relationship between presidential and Senate election outcomes. The vast majority of U.S. senators now come from the same party as the winner of the most recent presidential election in their state. The 26 states carried by Barack Obama in 2012 were represented by 43 Democrats and 9 Republicans in the 113th Congress, while the 24 states carried by Mitt Romney were represented by 12 Democrats and 36 Republicans.
As in the case of the House, this pattern continued to hold in the 115th Congress, which was elected in 2016. In 2017, the 20 states carried by Hillary Clinton in 2016 were represented by 37 Democrats and 3 Republicans, while the 30 states carried by Donald Trump were represented by 11 Democrats and 49 Republicans. There has also been a decline in the number of states with split-party Senate delegations over the past forty years. In the 93rd Congress (1973–1975), 24 states had split-party delegations. In the 115th Congress (2017–2019), only 12 states had split-party delegations. Most were swing states like Ohio, Florida, Wisconsin, and Pennsylvania.
The growing consistency of election results extends all the way down to state legislative races. The party composition of state legislatures is now strongly related to the results of presidential elections. The correlation between the Democratic share of the presidential vote in 2012 and the Democratic share of state legislative seats in 2012 was .85, the strongest correlation between presidential and state legislative election results for any year since at least 1956. Since the midterm election of 2010, Republicans have controlled most of the nation’s state legislative chambers. Nevertheless, in the 26 states carried by Barack Obama in 2012, Democrats controlled 37 out of 52 legislative chambers following that year’s elections. In the 23 states with partisan legislatures (Nebraska has a nonpartisan unicameral legislature) carried by Mitt Romney, Republicans controlled 43 out of 46 legislative chambers following the 2012 elections. Altogether, over 80 percent of partisan state legislative chambers in 2013 were controlled by the party whose presidential candidate carried the state in 2012. And this pattern was even stronger in 2017, with 89 of 98 chambers, or 91 percent, controlled by the party whose presidential candidate carried the state in 2016.
The remarkable consistency in the results of recent presidential elections, and between the results of presidential, congressional, and state legislative elections, can be explained by the sharp division in today’s American electorate. All of these election results closely reflected the underlying strength of the parties in the states and districts and the fact that, although the nation as a whole is closely divided, the large majority of states and congressional districts now clearly favor one party or the other. As a result, the outcomes of presidential elections and control of the House and Senate are determined by the few swing states and districts where the outcome is in doubt—a group whose number has been steadily decreasing.
In 2012, the partisan divide was clearly evident at the individual level as well. According to the national exit poll, 93 percent of Republican identifiers voted for Romney while 92 percent of Democratic identifiers voted for Obama. This was the highest level of party loyalty in any presidential election since the beginning of exit polls in 1972, and it continued a pattern of strong partisan voting in recent presidential elections. Data from the 2012 American National Election Study confirm this pattern: 91 percent of party identifiers, including leaning independents, voted for their own party’s presidential candidate, while only 7 percent defected to the opposing party’s candidate. This was the highest level of party loyalty in any presidential election since the ANES began asking about party identification in 1952.
Data from the 2012 survey also show a very high degree of stability in presidential voting between 2008 and 2012. Among those who reported voting in both elections, 92 percent supported the same party both times. Over 93 percent of McCain supporters in 2008 voted for Mitt Romney in 2012, while over 90 percent of Obama supporters in 2008 voted for him again in 2012. Ninety-eight percent of strong Democrats, 81 percent of weak Democrats, and 85 percent of independent Democrats reported voting for Obama in both elections. Likewise, 95 percent of strong Republicans, 81 percent of weak Republicans, and 81 percent of independent Republicans said they voted for McCain in 2008 and Romney in 2012.
The 92 percent who voted for the same party in 2008 and 2012 was the highest for any pair of consecutive elections for which data are available. Although the ANES has not generally asked respondents about their presidential vote in the previous election, national exit polls have included such a question for some time. These data suggest that the proportion of swing voters has been declining since the 1970s.
The record for stability of party voting in elections without a significant third party or independent candidate was set in 2000–2004, two elections in which George W. Bush was on the ballot. According to the 2004 national exit poll, 91 percent of those voting in both elections cast their ballots for the same party—90 percent of 2000 Gore voters chose John Kerry in 2004 and 91 percent of 2000 Bush voters chose Bush again in 2004. Partisan consistency was slightly lower between 2004 and 2008—at 86 percent—and between 1984 and 1988, when it was 85 percent. However, it was only 76 percent between 1972 and 1976. Almost one in four voters switched parties between those two elections, and the switches went in both directions—26 percent of those voting for Richard Nixon in 1972 switched to Jimmy Carter in 1976, and 18 percent of those voting for George McGovern in 1972 switched to Gerald Ford in 1976. This high rate of instability between consecutive elections suggests that even though the proportion of voters identifying with a party hardly changed from the 1970s to the 2000s, the influence of partisanship was much weaker.
Party loyalty is by no means confined to presidential voting. According to the 2012 national exit poll, 94 percent of Democrats voted for the Democratic candidate for the House of Representatives and 94 percent of Republicans voted for the Republican candidate. Ticket splitting was rare. According to the 2012 national exit poll, 91 percent of voters cast a straight-party vote in the presidential and U.S. House elections. Again, results from the 2012 ANES were similar: 89 percent of Democrats and 93 percent of Republicans voted for their party’s House candidate, and 90 percent of all voters cast a straight-party ballot in the presidential and House elections.
The results of recent elections at all levels of American government show that the U.S. electorate is sharply divided along racial, cultural, and ideological lines. These divisions explain the record levels of party loyalty and straight-ticket voting in these contests. But does this mean that the parties in the electorate are also polarized? Could these trends just reflect, as some scholars have argued, that the two major parties’ supporters are better sorted along ideological lines?
According to Morris Fiorina and others, Americans today are better sorted by party than they were thirty or forty years ago, but they are no more polarized. By this, Fiorina means that party identification today is more closely related to ideology, values, and specific issue positions than it was in the past. Democrats and Republicans are more likely to be found on the opposite sides of these divides, but the distribution of opinion is still a bell-shaped curve, with most of us near the center where we have always been. The large majority of Americans, according to Fiorina, hold moderate views. It is the elites and activists who are divided into polarized camps with few centrists, not the voters.6
It is certainly possible for voters to become increasingly sorted but not increasingly polarized. But the evidence from the ANES does not support this conclusion. Instead it shows that in practice, sorting and polarization are almost indistinguishable. As the American electorate has become increasingly sorted by party, the distributions of ideological positions, policy preferences, and even candidate evaluations have become increasingly polarized, with fewer Democrats and Republicans found near the center and more near the opposing attitudinal poles. But this shift toward the extremes has not always affected supporters of both parties equally. On some questions, Republicans have moved further to the right than Democrats have moved to the left.
Between 1972, the first time the ANES survey included a question on ideology, and 2012, there was a gradual but ultimately quite dramatic change in the relative positions of Democratic and Republican voters on the seven-point ideology scale, where 1 represents the extreme left, 7 the extreme right, and 4 the exact center. The average Democratic voter moved from a mean location of 3.8, or just left of center, to 3.4. Over the same period, the average Republican voter moved from a mean location of 4.6 to 5.3. As a result of these shifts, the distance between the average Democratic voter and the average Republican voter more than doubled, going from 0.8 units in 1972 to 2.0 units in 2012, but 64 percent of this increase was due to the rightward movement of Republican voters.
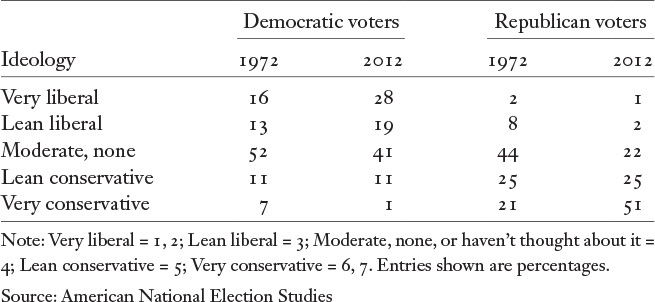
The significance of these changes can be seen by directly comparing the distributions of Democratic and Republican voters on the ideology scale in these two years (table 5.2). Between 1972 and 2012, the proportion of Democratic voters placing themselves in the center of the scale (or unable to place themselves) fell from 52 percent to 41 percent, while the proportion placing themselves on the left side of the scale increased from 29 percent to 47 percent. The change among Republican voters was considerably greater. Between 1972 and 2012, the proportion of Republican voters placing themselves in the center or unable to place themselves fell from 44 percent to 22 percent, while the proportion placing themselves on the right side of the scale increased from 46 percent to 75 percent.
As the two parties’ supporters were moving apart over these forty years, the shape of the distribution was also changing. The proportion of all voters placing themselves in the center of the scale or unable to place themselves fell from 49 percent in 1972 to 35 percent in 2012. At the same time, the proportion placing themselves at or close to the left or right poles of the scale—at 1, 2, 6, or 7—increased from 23 percent in 1972 to 39 percent in 2012. In 1972, more than twice as many voters placed themselves in the center or could not place themselves than called themselves strong ideologues. By 2012, strong ideologues outnumbered those in the center or unable to place themselves.
TABLE 5.2. DISTRIBUTIONS OF DEMOCRATIC AND REPUBLICAN VOTERS ON IDEOLOGY SCALE IN 1972 AND 2012
The changing distribution of voters on the ideology scale can also be seen when we compare the standard deviation of the scale in 1972 with that of 2012. The standard deviation of the scale is a direct measure of the intensity of disagreement within the electorate over ideology: the larger it is, the more intense the disagreement. Like the distance between the parties, the standard deviation of the ideology scale grew gradually but steadily over these forty years. In 1972, it was 1.15 units for all voters. By 2012, it had increased to 1.46 units, an increase of 27 percent.
The changes in the locations of Democratic and Republican voters and the change in the overall distribution of voters on the seven-point ideology scale show that party sorting and polarization have occurred simultaneously. Since the early 1970s, Democrats have shifted to the left, Republicans have shifted even further to the right, and the overall distribution has shifted away from the center and toward the two ends. These shifts are very similar to those seen among members of the U.S. Senate and House of Representatives during the same period, although the shifts in Congress have been somewhat larger. Nevertheless, the evidence shows very clearly that for both groups, sorting and polarization are very closely connected. As Democrats and Republicans in the electorate and in Congress have sorted themselves across the ideological divide, they have simultaneously moved away from the center.
The significance of increased sorting and polarization depends on how strongly voters’ positions on the ANES scale correlate with their positions on specific policy issues. Some early research on ideological identification suggested that this scale measured largely symbolic attitudes and was only weakly related to actual policy preferences.7 Today, however, ideological identification is strongly related to positions on a wide range of issues, especially social welfare issues. Moreover, opinions on these issues have themselves become much more closely connected over time. In other words, to use the term coined by Philip Converse in “The Nature of Belief Systems in Mass Publics,” his classic study of ideological thinking, voters’ opinions on these issues have become more constrained.8
According to Converse, issue constraint is a key characteristic of ideological thinking: to the extent that opinions on different issues are shaped by an underlying worldview or ideology, they should be related. He found that constraint was very weak in the American mass public in the 1950s and concluded that ideology was largely confined to political elites and activists. The question for us is whether this has changed since Converse conducted his pioneering research.
Unfortunately, we do not have public opinion data on issue questions that have been asked consistently since the 1950s. In fact, the questions Converse used to measure issue constraint in the electorate were considered so flawed that they were abandoned shortly after his study was published. However, we do have data on a series of four social welfare policy issues, which, along with the ideology question, have been asked consistently in every presidential election survey since 1984. These issue questions, like the ideology question, ask respondents to place themselves on seven-point scales. They ask about government aid to improve the condition of black Americans, government versus individual responsibility for jobs and living standards, reliance on government versus private companies for health insurance, and the trade-off between government services and spending and taxes. As with the ideology question, I have assigned respondents who declined to place themselves on each of these questions to the middle position.
An analysis of the responses to these four questions shows that even over the fairly short span of twenty-eight years, issue constraint increased substantially. The average correlation among the four social welfare questions increased from .29 in 1984 to .50 in 2012, while the average correlation between the social welfare issue questions and the ideology question increasing from .25 in 1984 to .47 in 2012. In terms of shared variance, the relationships among opinions on these questions were about three times stronger in 2012 than in 1984.
These findings indicate that ideological thinking was much more prevalent in the American electorate in 2012 than in 1984. Moreover, issue constraint is an important indicator of ideological polarization. Higher levels of constraint mean that a larger proportion of voters hold consistently liberal or consistently conservative opinions, and a smaller proportion have a mixture of liberal and conservative opinions. The magnitude of the increase in ideological polarization can be seen by comparing the distributions of Democratic and Republican voters on a social welfare issues scale based on responses to the four questions described above (table 5.3).
TABLE 5.3. DISTRIBUTIONS OF DEMOCRATIC AND REPUBLICAN VOTERS ON SOCIAL WELFARE ATTITUDES SCALE IN 1984 AND 2012
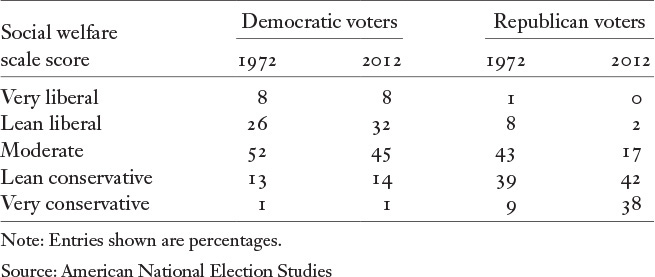
The results show that, like ideology, opinions on social welfare issues have become asymmetrically polarized. Between 1984 and 2012, the proportion of voters in the center of the social welfare issues scale fell from 48 percent to 32 percent, while the proportion located close to the poles rose from 10 percent to 23 percent. Almost all of the increase, however, was due to the growing conservatism of Republican voters. Democratic voters shifted only slightly to the left between 1984 and 2012—the proportion of moderates fell from 52 percent to 45 percent while the proportion of liberals rose from 33 percent to 40 percent. And the proportion of strong liberals among Democratic voters did not increase at all. They made up only 8 percent of Democratic voters in both 2012 and 1984. Republicans, meanwhile, shifted dramatically to the right on social welfare issues during these years. The proportion of moderates and liberals combined fell from 52 percent to 20 percent, while the proportion of conservatives rose from 48 percent to 80 percent, and of strong conservatives from 9 percent to 38 percent.
A similar pattern of asymmetrical polarization is found in Congress. Since the 1970s, analyses of roll-call votes have shown that Republicans in both the Senate and the House have moved much further to the right than Democrats in either chamber have moved to the left. In both Congress and the electorate, conservatives now greatly outnumber moderates and liberals among Republicans. Liberals do not greatly outnumber moderates and conservatives among Democrats. However, this pattern does not hold for all issues. When it comes to cultural issues such as abortion and gay rights, Democratic voters now appear to be at least as far to the left as Republican voters are to the right.
To measure opinions on cultural issues, I created a scale combining two questions on abortion policy and two questions on gay rights in the 2012 ANES. The abortion questions were the traditional four-point ANES abortion policy scale and a nine-point scale measuring support or opposition to abortion as a woman’s choice. The gay rights questions asked about same-sex marriage and adoption rights. Opinions on these questions were rather closely connected, with correlations ranging from .42 to .71 and an average correlation of .53.
When we compare the distributions of Democratic and Republican voters on the five-point cultural issues scale, it is clear that opinions were quite polarized in 2012 (figure 5.1). Over half of all voters were classified as either strong liberals (34 percent) or strong conservatives (22 percent). Only 12 percent were classified as moderates. There was also a sharp divide between the parties. However, on cultural issues, unlike social welfare issues, Democratic voters were somewhat further to the left of center than Republican voters were to the right of center. Sixty-six percent of Democratic voters were classified as liberals and 48 percent as strong liberals on cultural issues, while 60 percent of Republican voters were classified as conservatives and 40 percent as strong conservatives.
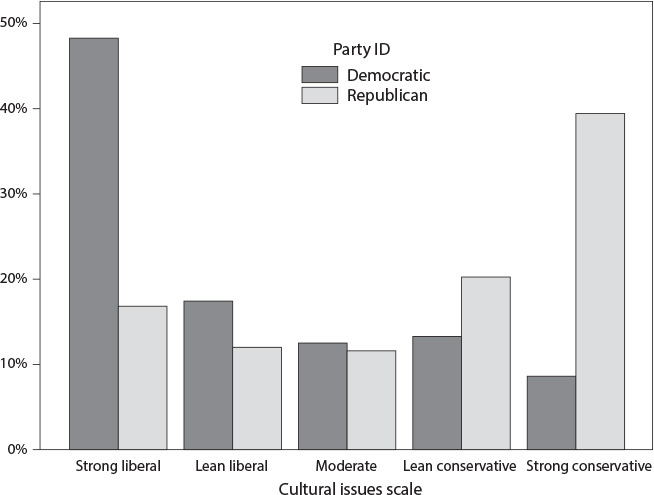
Figure 5.1. Distributions of Democratic and Republican Voters on Cultural Issues Scale in 2012. Source: 2012 American National Election Study
Despite these different patterns of polarization on social welfare and cultural issues, we see sharp differences between the two major parties on both types of issues. Moreover, there is a growing connection between these two types of issues. Voters in the liberal or conservative camp on social welfare issues are increasingly in the same camp on cultural issues. We can see this when we examine the correlation between location on the social welfare issues scale and opinion on the four-point abortion policy scale since 1984—the abortion scale being the one cultural issue that has been included in ANES surveys over that time. The relationship between opinions on these two types of issues has grown steadily stronger, with the correlation coefficients increasing from .01 in 1984 to .04 in 1988, .11 in 1992, .13 in 1996 and 2000, .18 in 2004, .23 in 2008, and .28 in 2012. In addition, the correlation between the cultural issues scale and the social welfare issues scale in 2012 was an even stronger .36. It is clear that opinions on these types of issues are increasingly likely to reinforce one another, and thus to push voters in the same partisan direction. Moreover, there was even greater consistency between cultural and social welfare policy preferences among more politically active voters. The correlation between cultural conservatism and social welfare conservatism was .49 among ANES respondents who reported engaging in three or more campaign activities beyond voting, compared with .30 among those who engaged in no activities beyond voting.
The rise of partisan polarization over the past four decades has involved voters’ feelings about the parties and candidates as well as their ideological and issue positions. Because of the rise of negative partisanship, affective polarization has grown even more than issue or ideological polarization. This can be seen by examining the trends in relative feeling thermometer evaluations of the Democratic and Republican presidential candidates between 1968, the first time the feeling thermometer was included in the ANES survey, and 2012 (table 5.4). The statistics shown in this table are the average difference between the feeling thermometer ratings of the candidates by Democratic and Republican voters and the standard deviation of the feeling thermometer difference scores for all voters. The former statistic measures the size of the divide between the parties, while the latter measures the overall divide in evaluations of the candidates within the electorate.
TABLE 5.4. THE RISE OF AFFECTIVE POLARIZATION: FEELING THERMOMETER RATINGS OF PRESIDENTIAL CANDIDATES, 1972–2012
Year |
Party difference |
Standard deviation |
1968 |
46.8 |
38.6 |
1972 |
54.5 |
47.9 |
1976 |
47.9 |
40.1 |
1980 |
55.5 |
43.7 |
1984 |
71.8 |
49.0 |
1988 |
67.6 |
46.6 |
1992 |
63.6 |
44.3 |
1996 |
69.0 |
47.1 |
2000 |
63.8 |
44.0 |
2004 |
91.4 |
56.7 |
2008 |
72.3 |
48.9 |
2012 |
105.2 |
62.3 |
Source: American National Election Studies |
||
Both the average difference between the relative thermometer ratings of Democrats and Republicans and the overall dispersion of these ratings have increased substantially over this period, and especially since 2000. The 2012 election set new records for both measures. Moreover, the increase in affective polarization in recent years has been fairly symmetrical. Both Democrats and Republicans now favor their own party’s presidential candidate over the opposing party’s candidate much more strongly than in the past, especially in elections involving an incumbent. Both the Bush-Kerry contest in 2004 and the Obama-Romney contest in 2012 produced very strong preferences by partisans for their party’s standard-bearer. In 2004, Republicans rated George W. Bush an average of 50 degrees higher than John Kerry, while Democrats rated Kerry an average of 41 degrees higher than Bush. In 2012, Democrats rated Barack Obama an average of 55 degrees higher than Mitt Romney, while Republicans rated Romney an average of 50 degrees higher than Obama.
Contrary to claims by some scholars that affective polarization is distinct from ideological and issue polarization,9 the recent increase in affective polarization is closely connected with the increase in polarization over issues and ideology. Democratic and Republican voters prefer their party’s candidates more intensely than in the past because they prefer their party’s ideology and policy positions more intensely. Thus, the correlation between ideology and relative feeling thermometer ratings increased from .47 in 1984 to .66 in 2012. Over the same period, the correlation between location on the social welfare issues scale and relative feeling thermometer ratings increased from .53 to .72.
The large increase in partisan polarization on relative thermometer ratings of the presidential candidates between 1984 and 2012 is especially impressive given that the choices presented to the voters appeared to be no more polarized in 2012 than in 1984. It would be difficult to find evidence that Barack Obama was a more liberal Democrat than Walter Mondale, who had a consistently liberal voting record during his years in the U.S. Senate, or that Mitt Romney was a more conservative Republican than Ronald Reagan, who was widely seen as the leading conservative within the Republican Party before his election as president in 1980.
These results contradict the claim by Fiorina and his co-authors that today’s more divided voter evaluations of political leaders reflect more polarized choices, not more polarized voter positions.10 In fact, the difference in affective polarization between 1984 and 2012 can only be explained by a growing divide between Democratic and Republican voters on ideology and policy. Presenting polarized candidate choices to an overwhelmingly centrist electorate should yield mainly indifferent evaluations from voters. Only voters who are ideologically on one side or the other would be expected to have strong preferences between two candidates on opposite sides of that divide. The polarized evaluations of candidates seen in 2012 require both polarized candidate choices and polarized voter positions on issues and ideology.
There is a very close connection between the past few decades’ rise in ideological polarization and increasing partisan intensity and loyalty. It is precisely the voters with the strongest ideological convictions and the most consistent opinions across policy issues who are the strongest and most loyal partisans. According to data from the 2012 ANES, 60 percent of strong liberals, those who placed themselves at 1 or 2 on the seven-point ideology scale, identified themselves as strong Democrats, compared with only 38 percent of liberals who placed themselves at 3 on the scale. Similarly, 50 percent of strong conservatives, those who placed themselves at 6 or 7 on the ideology scale, identified themselves as strong Republicans, compared with only 11 percent of moderate conservatives who placed themselves at 5 on the scale. The results were very similar with regard to the five-item government activism scale. Sixty percent of very consistent liberals identified themselves as strong Democrats compared with only 38 percent of less consistent liberals. Likewise, 45 percent of very consistent conservatives identified themselves as strong Republicans compared with only 21 percent of less consistent conservatives.
Strength of ideological identification and issue consistency were also strongly related to party loyalty and straight-ticket voting. Ninety-nine percent of strongly liberal Democrats voted for Barack Obama for president, and 95 percent voted a straight Democratic ticket for president, U.S. House, and U.S. Senate. However, only 88 percent of moderate-to-conservative Democrats voted for Obama for president, and only 75 percent voted a straight Democratic ticket for president, House, and Senate. Ninety-eight percent of strongly conservative Republicans voted for Mitt Romney for president and 92 percent voted a straight Republican ticket for president, House, and Senate, while only 83 percent of moderate-to-liberal Republicans voted for Romney and only 63 percent voted a straight Republican ticket.
Again, results were similar with regard to the five-item government activism scale. Ninety-eight percent of consistently liberal Democratic identifiers voted for Barack Obama for president and 97 percent voted a straight Democratic ticket for president, House, and Senate. However, only 72 percent of conservative Democrats voted for Obama and only 63 percent voted a straight Democratic ticket. On the Republican side, 99 percent of consistently conservative Republican identifiers voted for Mitt Romney for president and 93 percent voted a straight Republican ticket, while only 78 percent of moderate-to-liberal Republicans voted for Romney and only 63 percent voted a straight Republican ticket. There is now a very close connection between ideological polarization and partisanship. Growing ideological polarization has been a key factor in the growth of partisan intensity over the past thirty years.
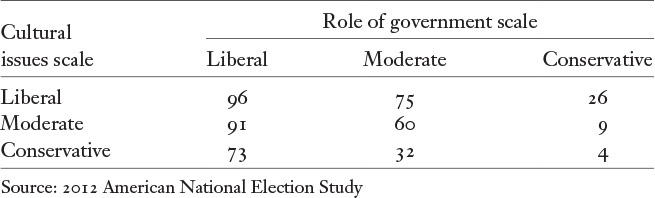
Another way to examine the consequences of attitudinal consistency is by comparing voters’ positions on the five-item role-of-government scale with their positions on the four-item cultural issues scale. The cultural issues scale is based on responses to two questions on abortion policy and two questions on gay rights. There was a fairly strong relationship between voters’ opinions on the role and size of government and their opinions on cultural issues—the correlation between these two scales was .36. Based on their locations on these two scales, I divided voters into five approximately equal-sized categories: consistent liberals, moderate liberals (liberal on one scale and moderate on the other), moderates or inconsistents (moderate on both scales or liberal on one and conservative on the other), moderate conservatives (conservative on one scale and moderate on the other), and consistent conservatives (table 5.5).
TABLE 5.5. OPINIONS OF VOTERS ON ROLE OF GOVERNMENT AND CULTURAL ISSUES SCALES
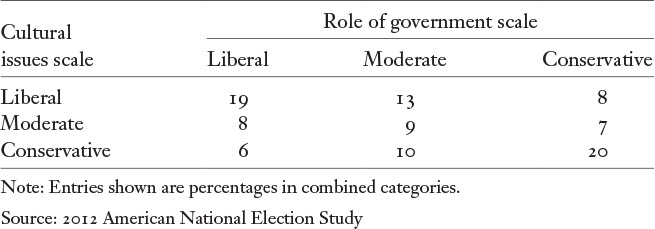
The largest proportion of voters in 2012 were consistent liberals or consistent conservatives. These two groups were about equal in size, and together they made up 39 percent of the electorate. Another 38 percent of voters were liberal or conservative on one scale and moderate on the other—21 percent were moderate liberals and 17 percent moderate conservatives. The remaining 23 percent of voters were either moderate on both scales (9 percent) or inconsistent, favoring the liberal side on one set of issues and the conservative side on the other (14 percent). Eight percent of voters were classified as “libertarians,” conservative on the size and role of government and liberal on cultural issues, while 6 percent were “populists,” liberal on the size and role of government and conservative on cultural issues.
One thing that is immediately apparent from these findings is that those who took consistent positions on the role of government and cultural issues scales far outnumbered those who took inconsistent positions. Moreover, the percentage of respondents with consistent views was considerably greater among the highly educated than among the less educated, and considerably greater among the politically active than among the politically inactive. Consistent liberals and conservatives made up 46 percent of respondents with a post-college education but just 31 percent of those with only a high school education. Similarly, consistent liberals and conservatives made up 46 percent of politically active respondents, who engaged in two or more activities beyond voting, compared with 24 percent of politically inactive respondents.
Voters’ positions on these two scales had a powerful influence on their partisan orientations and voting decisions. Consistent liberals and conservatives were far more likely than other voters to identify strongly with a party, and far more likely to vote for that party’s candidates. This influence can be seen by examining respondents’ presidential votes in relation to their positions on the two scales (table 5.6). Ideologically consistent voters were extremely loyal partisans: 96 percent of consistent liberals reported voting for Barack Obama for president, while 96 percent of consistent conservatives reported voting for Mitt Romney. Moderate liberals and conservatives were not quite as loyal—about 80 percent of moderately liberal respondents voted for Obama and about 80 percent of moderately conservative respondents voted for Romney. But respondents’ positions on the role-of-government scale clearly had a stronger influence than their positions on the cultural-issues scale. This becomes clear when we examine the voting decisions of the most inconsistent respondents—those with liberal positions on one scale and conservative positions on the other. Libertarians voted almost three-to-one for Mitt Romney over Barack Obama, but populists voted almost three-to-one for Obama over Romney.
TABLE 5.6. PERCENTAGE VOTING FOR OBAMA BY POSITIONS ON ROLE OF GOVERNMENT AND CULTURAL ISSUES SCALES
Consistency of voters’ opinions on social welfare and cultural issues was also strongly related to stability of presidential voting between 2008 and 2012. Ninety-five percent of consistent liberals reported voting for Barack Obama in both elections, while 92 percent of consistent conservatives reported voting for John McCain in 2008 and Mitt Romney in 2012. Those with inconsistent views were much more likely to be swing voters. Fifteen percent of populists and 17 percent of libertarians reported switching parties between 2008 and 2012.
The latter groups also had distinctive social characteristics. The most striking difference between libertarians and consistent conservatives involved their religious beliefs and behavior. Libertarians were much less religious than consistent conservatives: only 21 percent reported attending religious services at least once or twice a month, compared with 67 percent of consistent conservatives. In other respects, however, the two groups were similar. Contrary to most popular descriptions, libertarians were not disproportionately young voters. Only 11 percent were eighteen to twenty-nine years of age, similar to the 14 percent of consistent conservatives who were under thirty. In contrast, eighteen to twenty-nine-year-olds made up 20 percent of consistent liberals. Sixty-eight percent of libertarians identified with or leaned toward the Republican Party.
Populists differed in several ways from consistent liberals. Compared with consistent liberals, populists were much less likely to be white, much less educated, and much more religious. Nonwhites made up 55 percent of voters with populist views, compared with only 29 percent of voters with consistently liberal views. And only 18 percent of populists were college graduates, compared with 48 percent of consistent liberals. Finally, 68 percent of populists reported attending religious services at least once or twice a month, compared with only 24 percent of consistent liberals. Despite these differences, however, 67 percent of populists identified with or leaned toward the Democratic Party.
There is no “disconnect” between political elites and the American public: America is a polarized country whose leaders reflect the diverging priorities and values of the constituents who elected them.11 Today’s Democratic electoral base is dominated by nonwhites and secular white liberals who view Republican politicians and voters alike as religious zealots, racial bigots, and defenders of multinational corporations and the wealthy. The Democratic base is pro-government, pro-choice on abortion, and pro-gay-marriage. Today’s Republican electoral base is dominated by socially and economically conservative white voters who viewed Barack Obama as an extreme liberal or socialist and his supporters as unpatriotic moochers who would rather live off of government handouts than work for a living. The Republican base is anti-government, anti-choice on abortion, and opposed to gay marriage.
Voters’ opinions on social welfare and cultural issues have become increasingly aligned. Voters with consistently liberal or consistently conservative views on social welfare and cultural issues now greatly outnumber those with inconsistent views. Nevertheless, each party’s electoral base includes a minority of identifiers who hold views on social issues that run contrary to the dominant position within the party. Libertarians, those with relatively conservative views on social welfare issues but relatively liberal views on cultural issues, make up about 8 percent of the overall electorate and about 13 percent of Republican voters. Populists, those with liberal views on social welfare issues but conservative views on cultural issues, make up about 6 percent of the overall electorate and about 10 percent of Democratic voters.
Of the latter two groups, libertarians appear to represent a greater threat to party unity. Not only do they comprise a somewhat larger share of Republican voters than populists do of Democratic voters, they are also more politically engaged. Libertarians made up 17 percent of active Republican voters, those who engaged in two or more activities beyond voting, in 2012 whereas populists made up only 8 percent of active Democratic voters. Nevertheless, libertarians were greatly outnumbered within the Republican Party by consistent conservatives.
Because the two party bases are roughly equal in size and loyalty, elections tend to be highly competitive at the national level, which further fuels partisan conflict. Every election is a battle for control of the White House and/or both chambers of Congress. Deeply rooted partisanship also explains the growing one-party domination of many states and congressional districts and the remarkable consistency in the results of elections over time and across elected offices. The late House Speaker Tip O’Neill’s famous remark that “all politics is local” has been turned on its head. Today, all politics is national.
Deeply rooted partisanship and the close balance between the two major parties at the national level have also helped make divided party control a regular feature of national government. This situation is made even more likely by each party’s distinct advantages in different types of elections. Democrats appear to have a growing advantage in presidential elections due to the increasing nonwhite share of the national electorate, which helped move several swing states into the Democratic column between 2000 and 2012. Republicans continue to have an advantage in congressional elections due to the concentration of Democratic voters in urban districts, thanks only in part to Republican control of redistricting in many states. Voters in sparsely populated Republican-leaning states are also overrepresented in the Senate, whose seats cannot be gerrymandered.
Even before the current era of polarized politics, divided party control was a fairly regular occurrence in the decades following World War II. But divided government today has very different consequences. During the 1950s, 1960s, and 1970s, it was much easier to build bipartisan coalitions to pass legislation.12 There were enough moderate-to-liberal Republicans and moderate-to-conservative Democrats to enable cross-party coalitions on some major issues. Today, however, there are almost no members in the middle in either chamber, and divided party control almost inevitably leads to confrontation and gridlock. With control of both chambers at stake every two years, party leaders in Congress often seem more concerned with posturing and positioning for the next election than with addressing pressing national problems.
The problems of governing in a polarized era have been compounded by the Republican Party’s dramatic movement to the right. As Thomas Mann and Norman Ornstein have argued, polarization in Congress is asymmetrical.13 Since the 1980s, the Republican Party in Congress, and especially in the House of Representatives, has moved much further to the right than the Democratic Party has moved to the left. The rise of the Tea Party movement in 2009 certainly exacerbated this phenomenon, but the GOP’s rightward shift was well under way before then.
The growing conservatism of the Republican Party in Congress and in many states reflects the growing conservatism of the Republican electoral base and especially its more active segment.14 The problem facing Republican leaders and strategists today is that this base is shrinking. The nation is slowly becoming more racially diverse, more secular, and more socially liberal, and these trends are making it more and more difficult for Republican candidates to compete in presidential elections. Even with Donald Trump’s Electoral College victory in 2016, Republican candidates have lost the popular vote in six of the last seven presidential elections. But taking the necessary steps to expand the party’s appeal to nonwhites and socially liberal Americans would risk deeply offending large segments of the GOP base. This is something few Republican elected officials appear willing to do, especially since few Republican officials need to appeal to these voter groups in order to hold on to their seats.
The forces producing polarization in the American electorate are far from spent. They include, most importantly, the growing racial and ethnic diversity of American society, growing secularism and the decline of traditional religion, and the growing influence of partisan media.15 Over the short term, and perhaps over the medium term, polarization within the electorate and among political leaders is likely to increase. If this diagnosis is correct, rather than trying to reduce polarization by tinkering with electoral rules and procedures, which is unlikely to prove effective, political scientists and others concerned about the future of American democracy should focus on finding ways to help the political system function in a polarized era.