CHAPTER 4
THE PHARMACEUTICAL AND MEDICAL DEVICE INDUSTRIES
Healthcare involves much more than just doctors and hospitals. The pharmaceutical industry is a large and expanding global business, and prices for prescription drugs are among the fastest-growing healthcare costs. Although the following is not the reason for most high drug prices, it occurs all too frequently: “Old drugs are out of patent, which means any company can make them, and usually the price drops very low because of the competition. But [former Turing Pharmaceuticals CEO Martin] Shkreli was an entrepreneur who saw no reason why selling drugs should be any different from selling cars: corner the market and hike the price. He did it a few times, but the one that caused all the trouble was a very cheap drug called pyrimethamine, trade name Daraprim. Daraprim had been out of patent for a very long time, having been approved by the US Food and Drug Administration in 1953. It is an anti-parasitic drug given to people with toxoplasmosis infection, particularly where they have weak immune systems because of AIDS or pregnancy and cannot easily fight it off. Shkreli bought the drug from another company in August 2015 and hiked the price by 5,000%. It went up overnight from $13.50 per pill to $750” (Boseley 2018).
LEARNING OBJECTIVES
After reading this chapter, you will be able to
 Compare the pharmaceutical and medical device industries in terms of their size and role in the healthcare industry.
 Understand how the two industries contribute to the rising costs of healthcare.
 Understand the importance of research and development to the two industries.
 Identify the steps of the clinical trial process and the purpose of each step.
The pharmaceutical and medical device industries encompass many large and important companies and products used by American consumers. Both continue to grow and contribute to the escalating costs of healthcare while also providing new and innovative treatments.
PHARMACEUTICAL INDUSTRY
The pharmaceutical industry is an important component of healthcare, as it is responsible for the discovery, manufacture, and distribution of prescription drugs. Each year in the United States, about 4 billion prescriptions are written for some 18,000 approved prescription drugs, accounting for almost $400 billion in consumer spending (PCG 2018). Worldwide, the pharmaceutical industry exceeds $1.11 trillion in annual revenues.
Pharmaceutical companies spend about $150 billion per year on research. The output of that research—new drugs—must obtain approval from the US Food and Drug Administration (FDA), the federal agency that is the chief regulator of drugs in the United States, before it can be sold. In 2017, pharmaceutical companies obtained approval from the FDA for 46 novel (new) drugs and 1,027 generic drugs. FDA approval is critical to ensure the safety and effectiveness of medications sold in the United States. The FDA also issues drug recalls, when necessary, and provides guidelines for prescribing medications. In effect, the FDA controls whether a prescription drug is available to US consumers. This function is extremely important to the major global pharmaceutical companies, as the US market accounts for 45 percent of the worldwide pharmaceutical business (Ellis 2019).
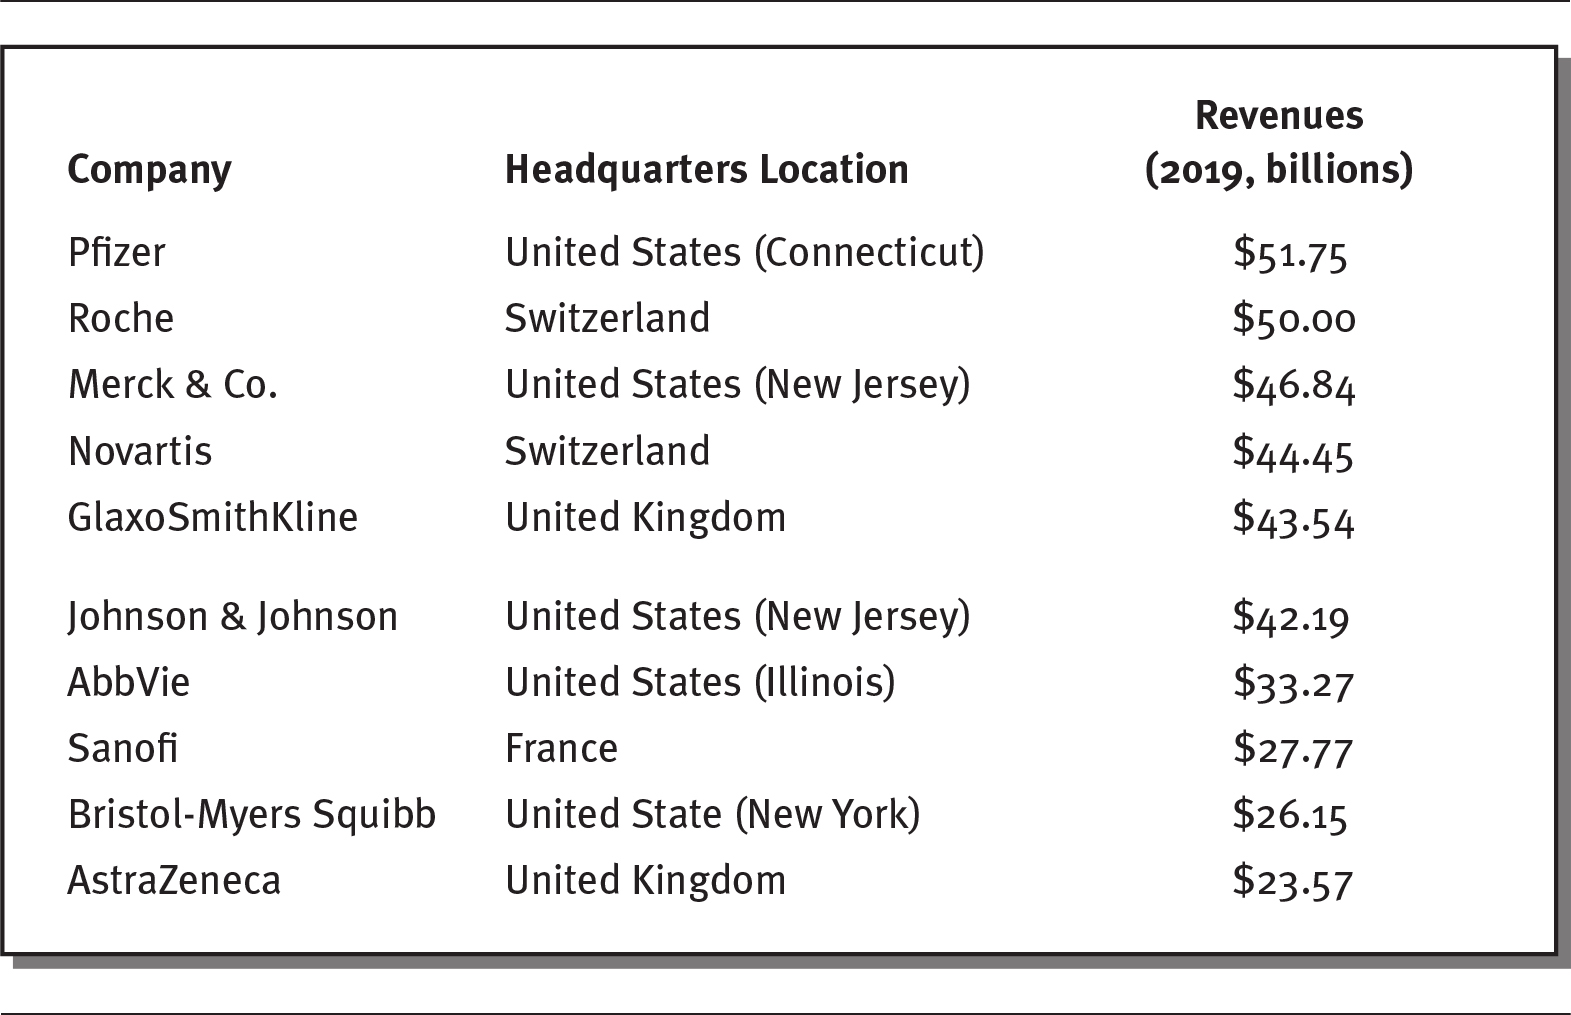
Pharmaceutical companies are large and have a global presence. Exhibit 4.1 lists the ten largest pharmaceutical companies in the world in 2019, ranked by their annual revenues. Six of these companies are headquartered in the United States. All of them generate billions of dollars of revenues per year.
EXHIBIT 4.1 Ten Largest Pharmaceutical Companies, 2019
Details
The details of the company, headquarters location, and revenues in billion for the year 2019 respectively are as follows:
- Pfizer: United States (Connecticut), 51.75 billion dollars.
- Roche: Switzerland, 50.00.
- Merck and Co.: United States (New Jersey), 46.84 billion dollars.
- Novartis: Switzerland, 44.45 billion dollars.
- GlaxoSmithKline: United Kingdom, 43.54 billion dollars.
- Johnson and Johnson: United States (New Jersey), 42.19 billion dollars.
- AbbVie: United States (Illinois), 33.27 billion dollars.
- Sanofi: France, 27.77 billion dollars.
- Bristol-Myers Squibb: United State (New York), 26.15 billion dollars.
- AstraZeneca: United Kingdom, 23.57 billion dollars.
Source: Data from Barton (2020).
Pharmaceuticals are the most profitable of any industry, both in the United States and worldwide, earning profit margins of around 20 percent (GAO 2017). Some companies, such as Gilead, have enjoyed profit margins exceeding 50 percent (Speights 2016). Over the past two decades, on average, the profits of the 35 largest pharmaceutical firms have been almost twice that of large nonpharmaceutical companies (13.8 percent versus 7.7 percent) (Ledley, McCoy, and Vaughan 2020).
Discovery remains at the center of the pharmaceutical business. When a drug is approved by the FDA, the company that developed it is granted patent protection, which gives it the exclusive right to manufacture the drug for a limited amount of time. Patent protection for drugs generally lasts 20 years, after which time other pharmaceutical companies can produce generic equivalents of the drug, often at a lower cost. For this reason, drug companies spend massive amounts of money on research and development (R&D). The pharmaceutical industry accounts for 21 percent of all R&D conducted in the United States (Speights 2016).
Patented brand-name drugs are marketed under the brand of the manufacturer and receive patent protection, whereas generic drugs are copies of brand-name drugs. Generic drugs copy the formulas of brand-name drugs and have the same dosage, intended use, administration, and strength as the original drug. For example, Valium is a brand-name drug that is commonly prescribed to relieve muscle spasms; its generic name is diazepam. Patent-protected drugs account for more than 70 percent of all drug spending in the United States, even though they represent only 10 percent of the prescriptions written (Kodjak 2016). Although patented drugs are legally protected for 20 years, some drug companies use controversial methods to extend their patent protections and continue sales of patented products (Amin 2018). For instance, drug companies have changed the dosage and frequency of medications to win patent extensions. Abbott Laboratories did this with its decades-old cholesterol drug, TriCor; to extend its patent, Abbot lowered the dosage and changed the drug’s form from a tablet to a capsule. Likewise, Forest Laboratories obtained a new patent when it changed the dosage of its Alzheimer’s disease drug Namenda from twice a day to once a day (Tribble 2018).
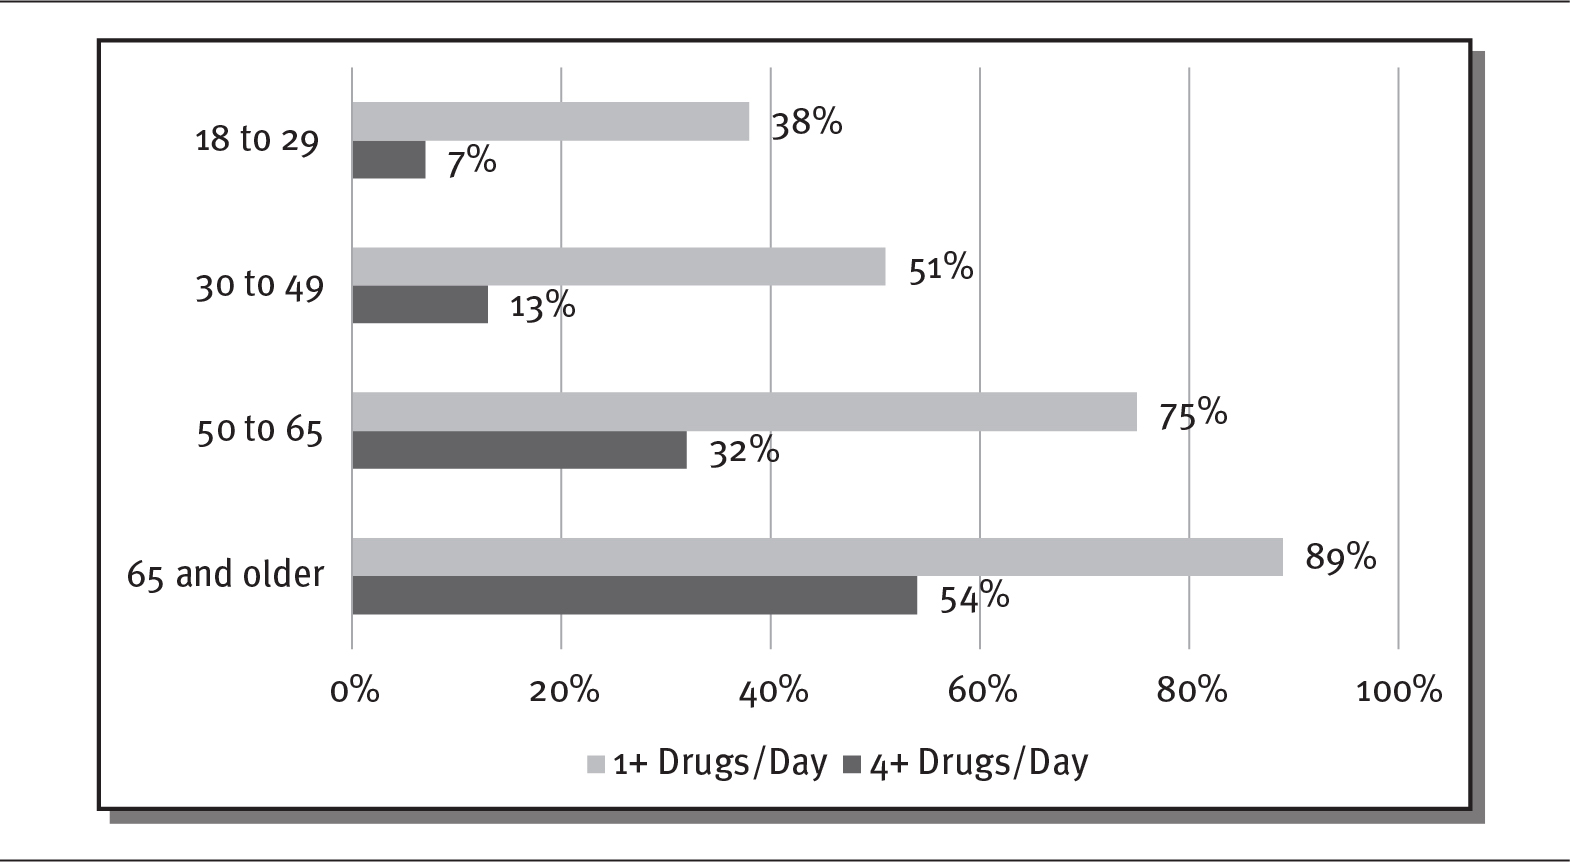
The use of prescription drugs is increasing in the United States. In 2019, almost 50 percent of the US population used a prescription drug (Hagan 2019). One driver of the increasing use of prescription drugs is the aging of the population. Older people use prescription drugs more than younger people. As shown in exhibit 4.2, in 2019, 89 percent of Americans over the age of 65 used at least one prescription medication per day, and 54 percent used four or more. By comparison, only 38 percent of 18- to 29-year-olds in the United States took at least one medication per day, and only 7 percent took four or more (Kirzinger et al. 2019). As discussed in chapter 1, the share of older adults in the US population (those 65 and older) is expected to increase from 15 percent to 24 percent by 2060—a continuing boon to prescription drugs sales (Mather, Jacobson, and Pollard 2015).
EXHIBIT 4.2 Americans’ Prescription Drug Use by Age, 2019
Details
The x-axis shows percentage from 0 to 100 in increments of 20 and the y-axis shows various age groups. The details are as follows:
- 18 to 29:
- 1 plus drugs per day: 38 percent.
- 4 plus drugs per day: 7 percent.
- 30 to 49:
- 1 plus drugs per day: 51 percent.
- 4 plus drugs per day: 13 percent.
- 50 to 65:
- 1 plus drugs per day: 75 percent.
- 4 plus drugs per day: 32 percent.
- 65 and older:
- 1 plus drugs per day: 89 percent.
- 4 plus drugs per day: 54 percent.
Source: Kirzinger et al. (2019).
PHARMACEUTICAL COSTS
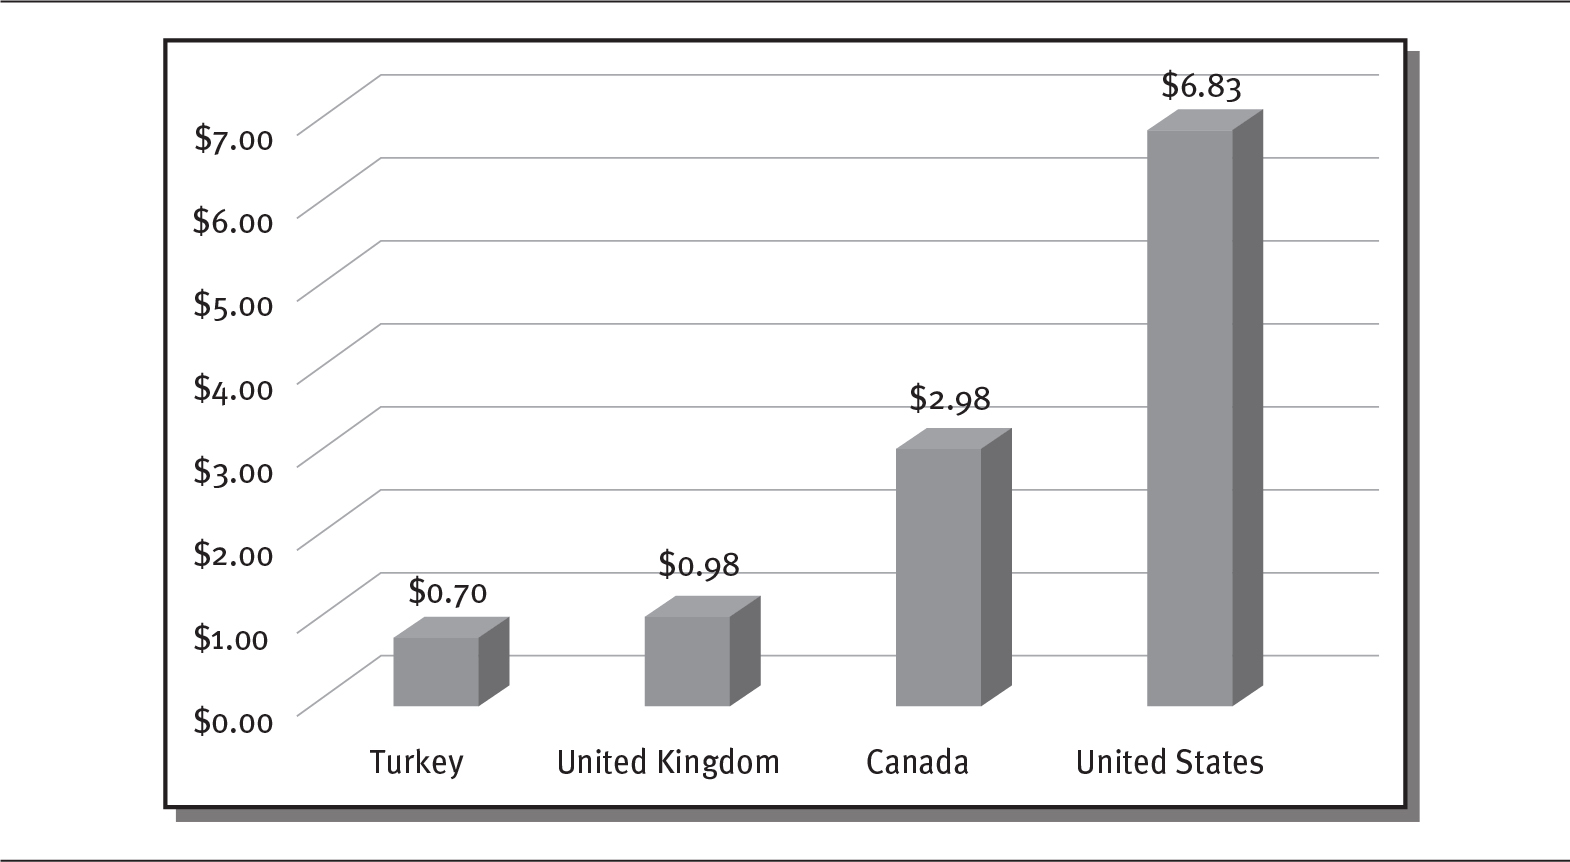
The United States spends more per person on prescription drugs than other industrialized countries, primarily because of higher drug prices. A 2017 Commonwealth Fund study showed that people in the United States spent more than $1,000 per person per year for prescription drugs, whereas people in Germany and the United Kingdom spent only $686 and $497, respectively. Retail prescription drug prices in these two countries are, on average, 95 percent and 46 percent of prices in the United States (Sarnak, Squires, and Kuzmak 2017). Even though the majority of older Americans have insurance coverage for prescription drugs through Medicare, about three-quarters of those consumers believe the prices of prescription drugs are unreasonable (Kirzinger et al. 2019). Exhibit 4.3 illustrates the disparity in drug prices between the United States and other countries for the brand-name antidepressant Paxil.
EXHIBIT 4.3 Prescription Drug Prices for Paxil (20 mg tablet)
Details
The x-axis shows various countries and the y-axis shows dollars from 0.00 to 7.00 in increments of 1. The details are as follows:
- Turkey: 0.70 dollars.
- United Kingdom: 0.98 dollars.
- Canada: 2.98 dollars.
- United States: 6.83 dollars.
Source: Data from Boseley (2018).
Drug prices continue to escalate in the United States. From 2008 to 2014, the prices for top brand-name drugs jumped 127 percent, far exceeding the increase in consumer goods, which rose 11 percent (Hirschler 2018). The price of one popular long-lasting brand of insulin (a drug used by people with diabetes), Lantus, rose 54 percent in 2014 alone, even though it had been on the market for decades (Campbell 2019). Although people with diabetes can die without insulin, very few companies produce it in the United States. The lack of competition spurred a price spike. In 2019, a vial of insulin cost $30 in Canada, while in the United States, it cost $340 (Gordon 2019). The rapid increases in drug prices have negatively affected many people. According to one survey, almost 19 percent of people admitted that they had skipped a dose of a drug they needed to save money (AARP 2017). The prices of new drugs in the United States are particularly high, approaching $500,000 for a single treatment in some cases (see sidebar on next page).
 DEBATE TIME Are Drug Prices Out of Control?
In 2017, the FDA approved two drugs that provided a radical new treatment for cancer using a patient’s own immune system to attack cancer cells. Both treatments were at least partially funded by federal research. The initial prices for these drugs were astonishing: Kymriah, used to treat leukemia, cost $475,000 for a one-time treatment, while Yescarta, for patients with lymphoma, cost $373,000. The high prices of these and other drugs have prompted calls for price controls and complaints that patients are paying for drugs twice: once through their taxes and again at the pharmacy counter (Pear 2018).
Do you think drug prices are out of control? Why do you think prescription drugs cost so much?
Through Medicare Part D, the US federal government pays more than 40 percent of retail prescription drug costs (Brookings Institution 2017). Implemented in 2006, Part D coverage provides prescription drug benefits to those who qualify for Medicare. In 2018, 72 percent of Medicare enrollees (43 million out of 60 million) had Part D coverage. These Medicare beneficiaries pay an average monthly premium of $41, although the actual premiums and prescription drug benefits vary, depending on the plan chosen. For example, about 40 percent of Part D plans require no deductible; for the rest, the annual deductible is $435. About 30 percent of those with Part D coverage also receive low-income subsidies. Total expenses for Medicare Part D in 2020 were expected to reach $88 billion (Kaiser Family Foundation 2019).
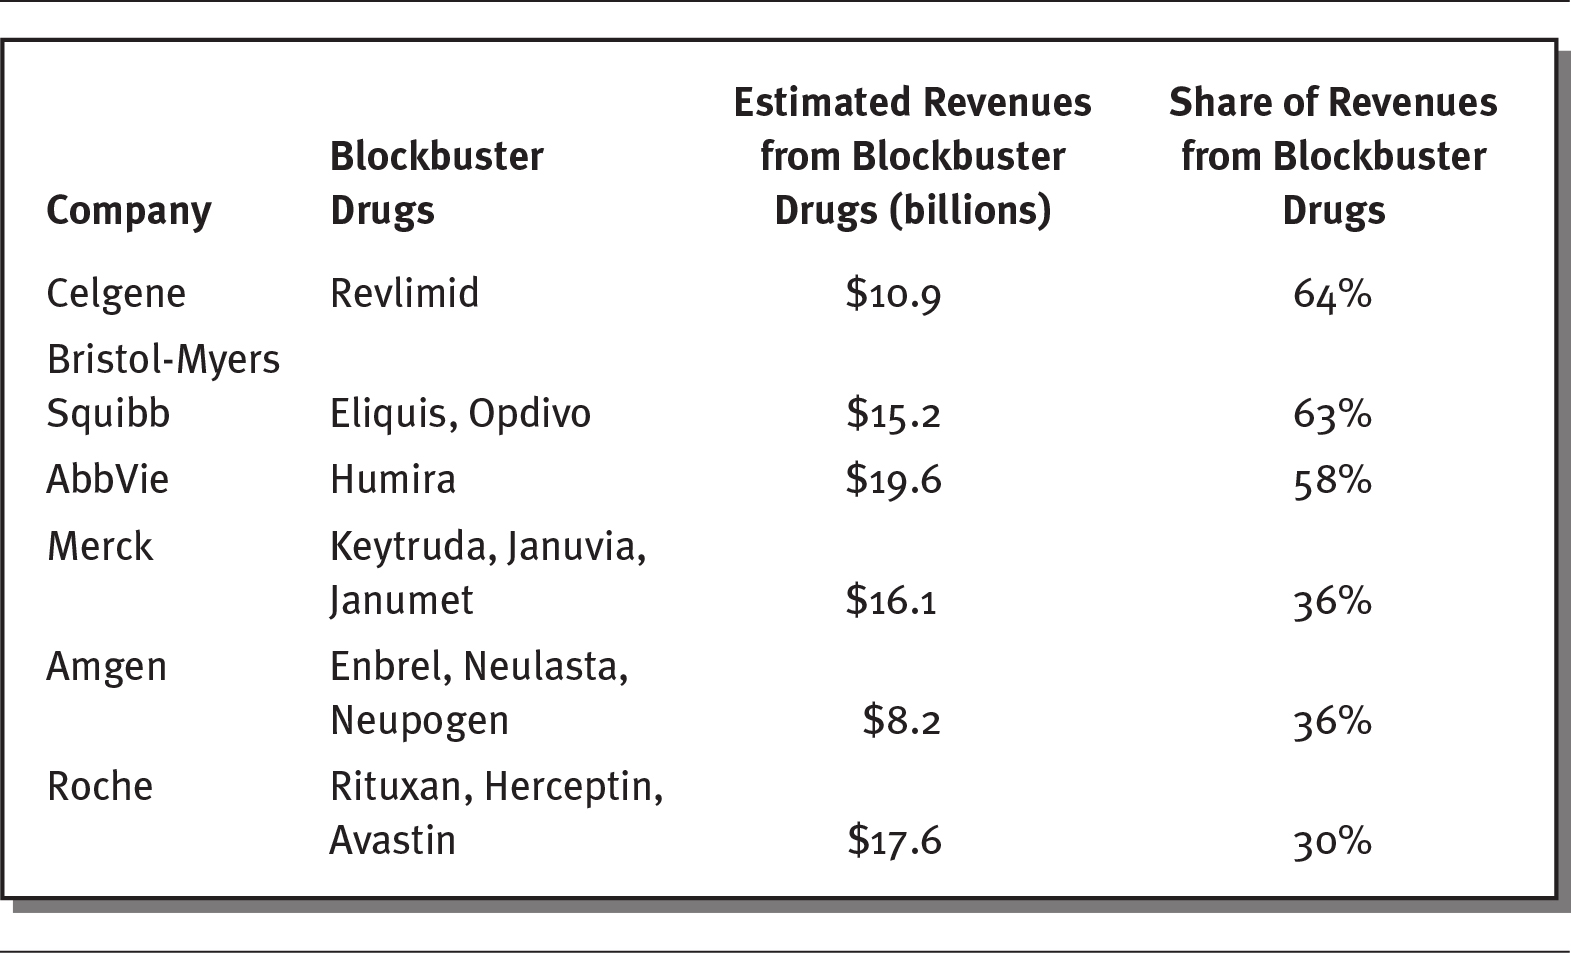
Pharmaceutical sales in the United States rose to $485 billion in 2018 and are expected to climb to about $655 billion by 2023 (Pharmaceutical Commerce 2019). However, most sales are attributable to a small number of drugs. Although there more than 9,000 drugs on the market that have been approved by the FDA, only 131 drugs have sales greater than $1 billion. These drugs are often referred to as blockbuster drugs. As exhibit 4.4 shows, many of the largest pharmaceutical companies earn significant portions of their revenues from blockbuster drugs. For example, AbbVie, the seventh-largest pharmaceutical company in the world, earns almost 60 percent of its revenues from just one drug (Humira, used to treat autoimmune disorders), while Roche, the second-largest company, generates 30 percent of its revenues from three drugs (Rituxan, Herceptin, and Avastin, all used to treat cancers) (Campbell 2019; Kresge and Lauerman 2019).
EXHIBIT 4.4 Top Blockbuster Drugs by Company, 2018
Details
The details of the company, their blockbuster drugs, estimated revenue from blockbuster drugs (in billions), and share of revenues from blockbuster drugs respectively are as follows:
- Celgene: Revlimid; 10.9 dollars; 64 percent.
- Bristol-Myers Squibb: Eliquis, Opdivo; 15.2 dollars; 63 percent.
- AbbVie: Humira; 19.6 dollars; 58 percent.
- Merck: Keytruda, Januvia, Janumet; 16.1 dollars; 36 percent.
- Amgen: Enbrel, Neulasta, Neupogen; 8.2 dollars; 36 percent.
- Roche: Rituxan, Herceptin, Avastin; 17.6 dollars; 30 percent.
Source: Data from Kresge and Lauerman (2019).
One way that healthcare organizations attempt to save money on prescription drugs is by creating drug formularies. A formulary, sometimes called a drug list, consists of a list of approved prescription drugs that an insurance plan covers. Organizations, using a panel of experts, generally consider the cost, safety, and effectiveness of a drug when deciding whether to place it on a formulary. This panel of experts, often called a pharmacy and therapeutics committee, meets regularly to discuss new drugs and drug information and to update the formulary.
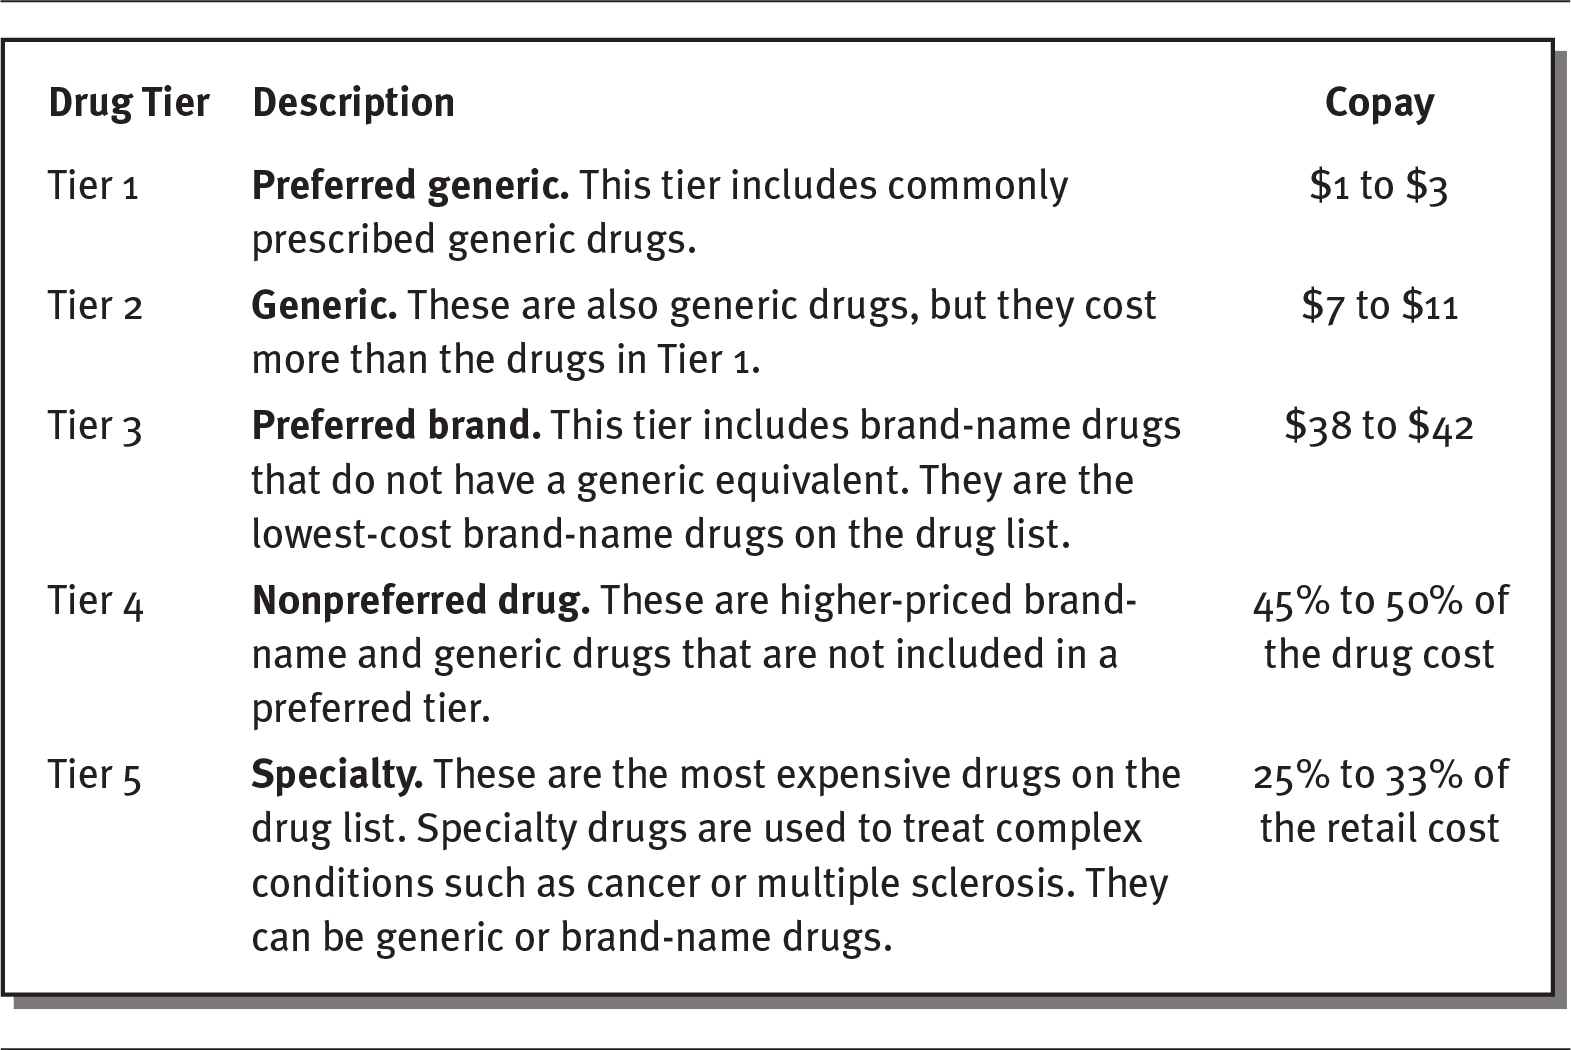
Formularies are often divided into two or more groups, called drug tiers. These tiers represent different drug costs and copays for the consumer. For example, exhibit 4.5 shows a five-tier system that requires higher copays for more expensive brand-name and specialty drugs.
EXHIBIT 4.5 Example of a Formulary with Drug Tiers and Copays
Details
The details of the tier, description, and copay respectively are as follows:
- Tier 1:
Preferred generic: This tier includes commonly prescribed generic drugs.
Copay: 1 to 3 dollars. - Tier 2:
Generic: These are also generic drugs, but they cost more than the drugs in Tier 1.
Copay: 7 to 11 dollars. - Tier 3:
Preferred brand: This tier includes brand-name drugs that do not have a generic equivalent. They are the lowest-cost brand-name drugs on the drug list.
Copay: 38 to 42 dollars. - Tier 4:
Nonpreferred drug: These are higher-priced brand name and generic drugs that are not included in a preferred tier.
Copay: 45 to 50 percentage of the drug cost. - Tier 5:
Specialty: These are the most expensive drugs on the drug list. Specialty drugs are used to treat complex conditions such as cancer or multiple sclerosis. They can be generic or brand-name drugs.
Copay: 25 to 33 percentage of the retail cost.
Source: Blue Care Network of Michigan (2020).
PHARMACEUTICAL DRUG DISCOVERY AND DRUG APPROVAL TRENDS
The drug discovery process has changed substantially in the past few decades, and it is likely to continue to evolve in the future. Pharmaceutical companies spend an average of $2.6 billion over 10 to 20 years to develop a successful new drug, up from $413 million in the 1980s. About 90 percent of drugs that are tested never make it to market. For example, drug companies investigated 123 drugs to treat Alzheimer’s disease, but only four obtained market approval from the FDA (Speights 2016). Because of the long and arduous process required to get new drugs approved, the pharmaceutical industry earns almost 90 percent of its revenues from drugs discovered more than five years earlier (Leaf 2018). Some believe that future advances in mobile communications and the introduction of artificial intelligence will greatly facilitate the discovery and approval of new drugs by dramatically reducing the time required for clinical trials through more efficient patient selection and monitoring and communication during trials (Fleming 2018; Harrer et al. 2019; Pisani and Lee 2017).
Some experts suggest that drug companies should consider patient outcomes and focus on cost-effectiveness and comparative clinical effectiveness. Comparative clinical effectiveness refers to a drug’s relative effectiveness in improving health, as measured by health-related outcomes. (For instance, Merck compared the COX-2 inhibitors etoricoxib and diclofenac, which were found to have similar efficacies.) Studies of comparative clinical effectiveness include randomized controlled trials, interventions, database studies, and observational studies. These types of studies compare the risks, benefits, and costs of different treatment options.
Cost-effectiveness refers to a drug’s ability to produce better health results at an equal or lower cost compared with existing drugs. Some observers argue that new drugs should only receive FDA approval if they are cost-effective. The federal government could make greater use of comparative effectiveness studies, as other countries do, to establish which drugs produce the most benefits and use this information to negotiate drug prices (Bishop 2018). However, provisions of the Affordable Care Act of 2010 essentially prohibit the use of cost-effectiveness studies (Glick et al. 2015).
By 2019, 14 states had formed a collaborative to perform comparative effectiveness reviews of prescription drugs for their Medicaid populations. This effort has focused on multiple drug studies to compare the benefits and costs of rival drugs, providing states with more information to purchase the least expensive but most effective medicines (NCSL 2019).
Other countries use a method called external reference pricing to set and negotiate the prices they pay for prescription drugs. Basically, countries look at what other countries are paying for pharmaceuticals and use that information to establish the prices they are willing to pay. Most industrialized countries now use this method to set drug prices. If the United States used external reference pricing, which has been proposed by the federal government, the Medicare program could save almost $73 billion on prescription drugs (Kang et al. 2019).
A growth area in pharmaceuticals is biosimilars, which are somewhat different from generic drugs. Generic drugs are chemically identical to the original brand-name drug. Biosimilars have the same clinical effect as a generic drug, but they may differ chemically. Generic drugs are much less expensive and quicker to develop, as biosimilars require more thorough clinical trials with the drug tests on many more people (see exhibit 4.6). Sales of biosimilars are predicted to total $15 billion by 2020 (Chen et al. 2018). The FDA is seeking to develop a low-cost approval process for biosimilars to encourage competition and lower the prices of generic drugs (Campbell 2019).
EXHIBIT 4.6 Differences Between Generic and Biosimilar Drugs

Details
The details are as follows:
- Development cost (US dollars)
Generic: 2 to 3 million dollars
Biosimilar: 100 to 300 million dollars. - Time to market:
Generic: 2 to 3 years
Biosimilar: 7 to 8 years - Clinical studies required:
Generic: Bioequivalence
Biosimilar: Through Phase III clinical trials - Patients studied:
Generic: 20 to 50
Biosimilar: 100 to 500.
Source: mAbxience (2020).
Today, pharmaceutical companies are challenged to “generate meaningful innovation: not just marginal improvements in drug efficacy or safety, but therapies that really transform healthcare” that can reduce expensive hospitalizations or improve patients’ quality of life (Moa 2019).
PHARMACY BENEFIT MANAGERS
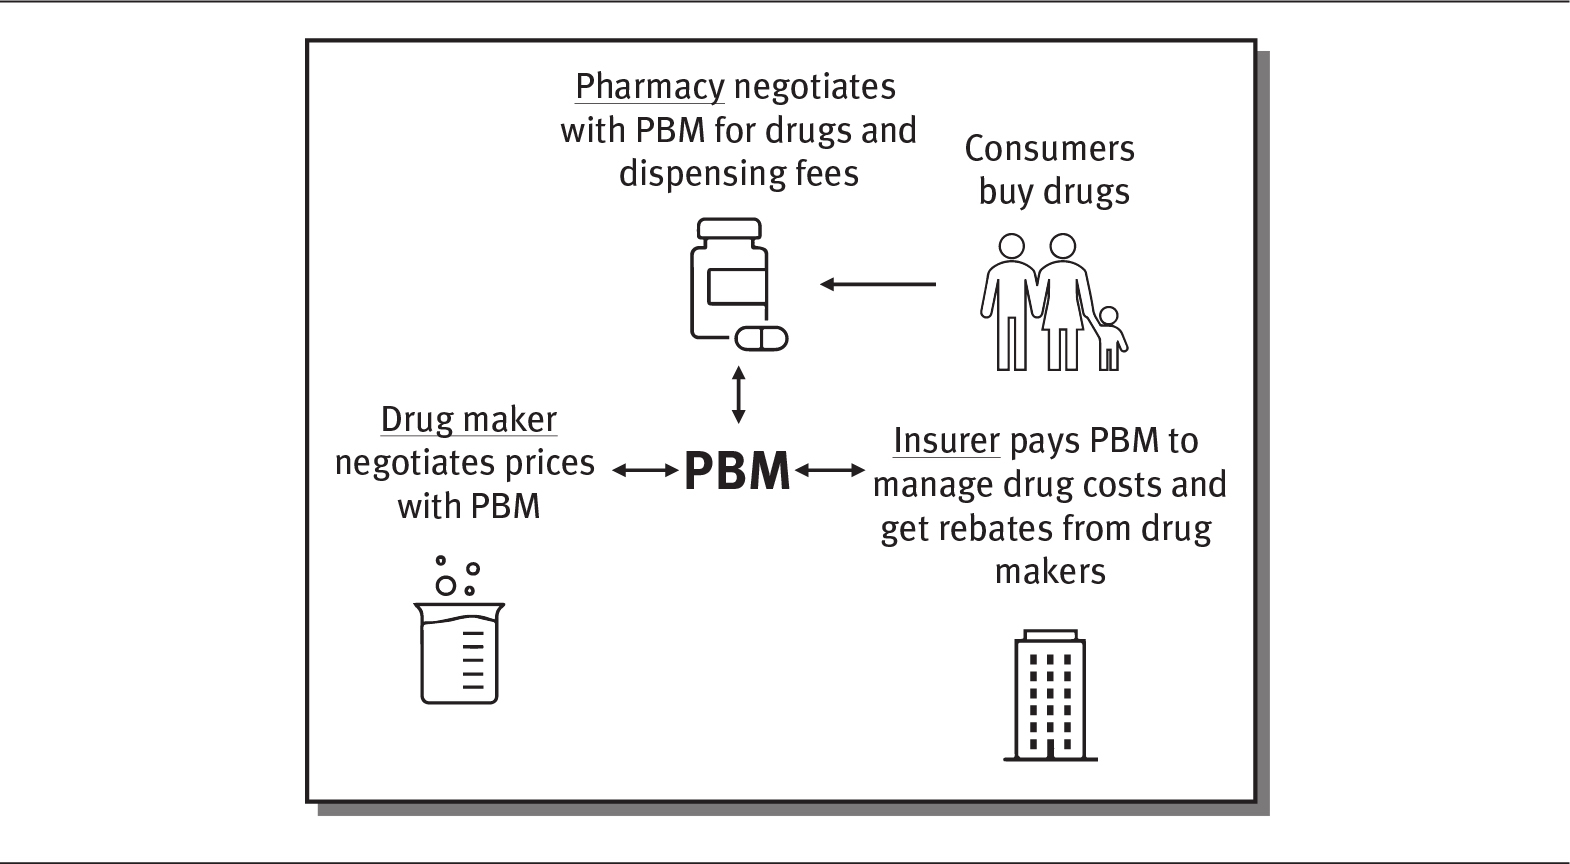
Pharmacy benefit managers (PBMs) are a critical component of the pharmaceutical industry, although they have become quite controversial. As seen in exhibit 4.7, PBMs are go-between companies that work on behalf of insurance companies to manage their drug costs by negotiating with drug makers to determine which drugs will be covered and how much insurance plans will pay for them. They also negotiate with pharmacies over what they are paid for drugs and their dispensing fees. Overall, their role is to manage prescription drug benefits for health plan insurers to lower their drug costs. PBMs help establish formularies, negotiate lower prices with drug manufacturers through rebates and discounts, and directly reimburse individual pharmacies for drugs prescribed to their beneficiaries. PBMs determine which pharmacies are included in an insurance network and how much the pharmacies are paid. Some research has shown that PBMs help lower drug prices and slow the growth of drug spending (Commonwealth Fund 2019) (see sidebar).
EXHIBIT 4.7 The Role of the Pharmacy Benefit Manager
Details
The pharmacy benefit manager has a two-way interaction with pharmacy, drug maker, and insurer. The details are as follows:
- Pharmacy negotiates with PBM for drugs and dispensing fees. Consumer buys drugs from the pharmacy.
- Drug maker negotiates prices with PBM
- Insurer pays PBM to manage drug costs and get rebates from drug makers
 HOW PHARMACY BENEFIT MANAGERS INFLUENCE PRICE
When the antiviral drug sofosbuvir—the first drug shown to cure hepatitis C—was approved by the FDA in 2014, it was very expensive. Initially, each tablet was priced at $1,000, and the total cost to treat one patient exceeded $80,000. However, by 2019, other companies had introduced ten equivalent drugs (Seladi-Schulman 2019). This gave Express Scripts, one of the largest PBMs, with 83 million members and 1.4 billion prescriptions annually, the ability to negotiate better prices by threatening to exclude a drug from its formulary unless the manufacturer lowered the price. As a result, Express Scripts was able to switch to another hepatitis C drug produced by Merck, which lowered the drug’s price by 60 percent (Coombs 2014).
However, some accuse PBMs of keeping too much money rather than passing the savings on to patients. In fact, PBMs do receive a share of the rebates that they negotiate with drug manufacturers. PBMs justify this practice by arguing that they are pharmacy experts that obtain more effective and cheaper drugs for their clients. Lobbyists from the pharmaceutical industry, however, claim that PBMs actually cause drug costs to rise (Bluth 2019).
Although PBMs existed in the 1960s, most were founded after the creation of Medicare Part D in the early 2000s. PBMs in the past were generally small, independent companies, but over the last decade, most have merged, so that three principal companies now control about 75 percent of the US market, and the top six PBMs control more than 95 percent of all prescriptions in the United States (Drug Channels 2019). PBMs have become so big that they manage drugs for more than 180 million people, and some are even bigger than the pharmaceutical companies they work with (Ollove 2019). Exhibit 4.8 provides an overview of the three largest PBMs, which are owned by prominent health insurance companies.
EXHIBIT 4.8 Largest Pharmacy Benefit Managers in the United States

Details
The details are as follows:
- CVS Caremark: Owned by Aetna or CVS Health
Revenue: 257 billion dollars
Net income: 12 billion dollars
Market share of prescription managed claims: 30 percent. - Express Scripts: Owned by Cigna
Revenue: 100 billion dollars
Net income: 4.6 billion dollars
Market share of prescription managed claims: 23 percent. - OptumRx: Owned by UnitedHealth Group
Revenue: 74.3 billion dollars
Net income: n/a
Market share of prescription managed claims: 23 percent.
Note: Data are for 2019 for CVS Caremark and OptumRx and for 2017 for Express Scripts. OptumRx is part of OptumHealth, which is owned by United Health Group.
Sources: Data from Forbes (2018); Macrotrends (2020); O’Brien (2020); Paavola (2019).
As a result of the consolidation and power of PBMs, even the American Medical Association (AMA) has encouraged regulatory intervention. According to the AMA, “Because of market concentration and lack of transparency, patients and physicians are essentially powerless in the face of PBM pricing and coverage decisions” (O’Reilly 2019). In the future, the role and evolution of PBMs will continue to be decided by market conditions and legislative and regulatory involvement.
CLINICAL TRIALS
Before a drug or pharmaceutical product can be used legally by consumers, it must be tested to make sure it is safe and works for its intended purpose. This is done through clinical trials. Clinical trials help researchers answer the following questions:
 Does a new treatment work?
 Does it work better than other treatments?
 Does it have side effects?
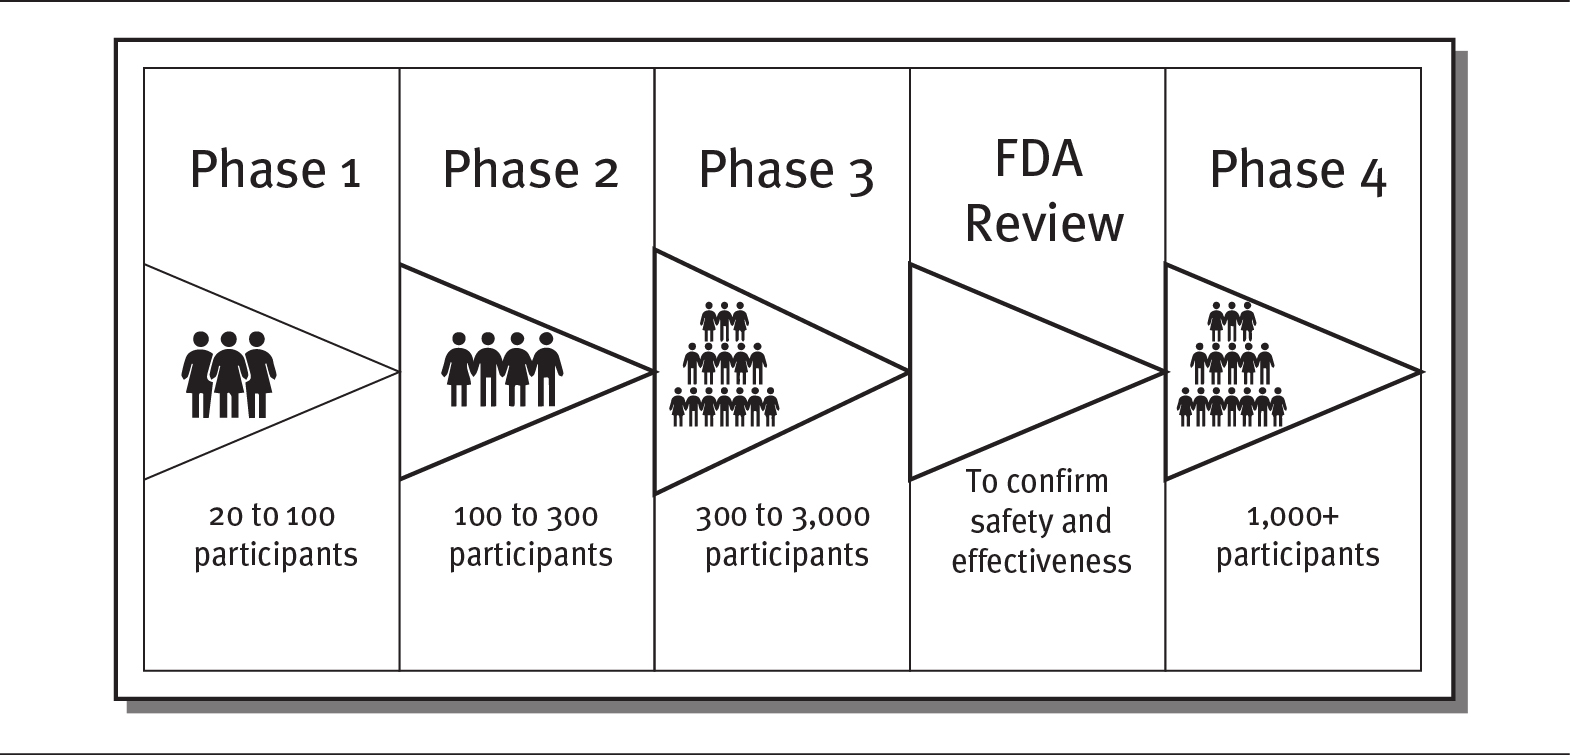
As exhibit 4.9 demonstrates, clinical trials are divided into four phases. Each phase involves research conducted on human subjects. During the first two phases of a clinical trial, researchers determine the safety, appropriate dosage, and side effects of a new drug or treatment. During Phase I, researchers test the new drug or treatment on a small number of people, perhaps 20 to 100. About 70 percent of Phase I trials yield positive results and move to Phase II. Phase II trials involve a larger group of subjects—generally up to several hundred volunteers—and go further in examining the safety and efficiency of different dosages.
EXHIBIT 4.9 The Four Phases of Clinical Trials
Details
The details of the phases are as follows:
- Phase 1: 20 to 100 participants
- Phase 2: 100 to 300 participants
- Phase 3: 300 to 3000 participants
- FDA review: To confirm safety and effectiveness
- Phase 4: 1000 plus participants.
If the first two phases are successful—which is the case for about one-third of clinical trials—the trial moves on to Phase III. During this phase, the trial is expanded to an even larger group of subjects, typically between 300 and 3,000 volunteers, depending on the disease and treatment being studied. In addition to studying safety, Phase III trials also seek to determine how the drug or treatment is best prescribed and used by patients. This phase also examines the efficacy and monitoring of adverse reactions to the treatment. About 25 to 30 percent of treatments pass Phase III.
The last phase, Phase IV, takes place only if a treatment has received approval by the government (in the United States, approval is granted by the FDA). Phase IV trials study the long-term effects of the drug or treatment across large populations. Several thousand volunteers are monitored, often for many years (FDA 2018b; Seladi-Schulman 2019).
Clinical trials are very expensive to conduct, with costs ranging from $5 million to $347 million (Moore et al. 2018). At any given time, many, many clinical trials are underway. In 2019, the US government listed 296,665 clinical trials ongoing across the 50 US states and 208 countries, with more than half conducted outside the United States (ClinicalTrials.gov 2020). Each clinical trial may take 12 to 15 years and more than $2.6 billion to take a new drug from the laboratory and to the pharmacy shelf, where it is available to the public (Drugs.com 2020).
Ensuring diversity in clinical trials is a challenge. Too often in the past, clinical trials were conducted mainly on white men. The FDA has now issued a guide to help researchers recruit subjects who better represent populations that are likely to use the drug. Since clinical trials determine whether medical products are safe and effective for people, participants in clinical trials need to represent potential users of the products. This is critical, as people of different ages, races, and genders may react differently to a medical product (FDA 2018a).
OVER-THE-COUNTER DRUGS
Over-the-counter (OTC) drugs are medicines that can be sold directly to a consumer without a prescription from a healthcare professional. More than 80 classes of OTC medications exist, ranging from acne medicines to weight loss products. People often buy OTC drugs at pharmacies, grocery stores, and even gas stations. The FDA has responsibility for approving OTC ingredients and labeling. Once acceptable ingredients, doses, formulas, and labeling are approved, new products can be created and marketed, as long as they conform to FDA guidelines.
Sales of OTC drugs exceed $35 billion in the United States. The top-selling OTC drugs include those for colds, fever, joint pain, heartburn, and antiperspirants. Although OTC medicines are sold like other consumer goods, they still have the potential to cause harm or addiction. Some of the common OTC drugs are Tylenol, Aleve, Robitussin, Listerine, and Alka-Seltzer. Consumers should always read their labels and follow directions for proper use (Anderson 2019: Stone 2019).
MEDICAL DEVICE INDUSTRY
The medical device industry, which is also regulated by the FDA, encompasses a wide range of equipment and products that are critical to healthcare delivery. These products include equipment required in the delivery of care, such as surgical gloves and sterile tubing; diagnostic equipment, such as magnetic resonance imaging (MRI) machines; medical implants, such as artificial joints and pacemakers; adaptive equipment, such as crutches; and many other types of products and equipment.
The medical device industry can be divided into six sectors (SelectUSA 2020):
- Dental equipment and supplies, such as drills, cements, sterilizers, and dental chairs
- Electro-medical devices, such as pacemakers, patient-monitoring systems, MRI machines, and ultrasound devices
- In-vitro diagnostics, such as chemicals, biological or radioactive substances for diagnostic tests done in test tubes, and machines
- Irradiation devices, such as X-ray devices and other diagnostic imaging devices
- Surgical and medical instruments, such as anesthesia machines and orthopedic instruments
- Surgical appliances and supplies, such as artificial joints and limbs, stents, and surgical gloves
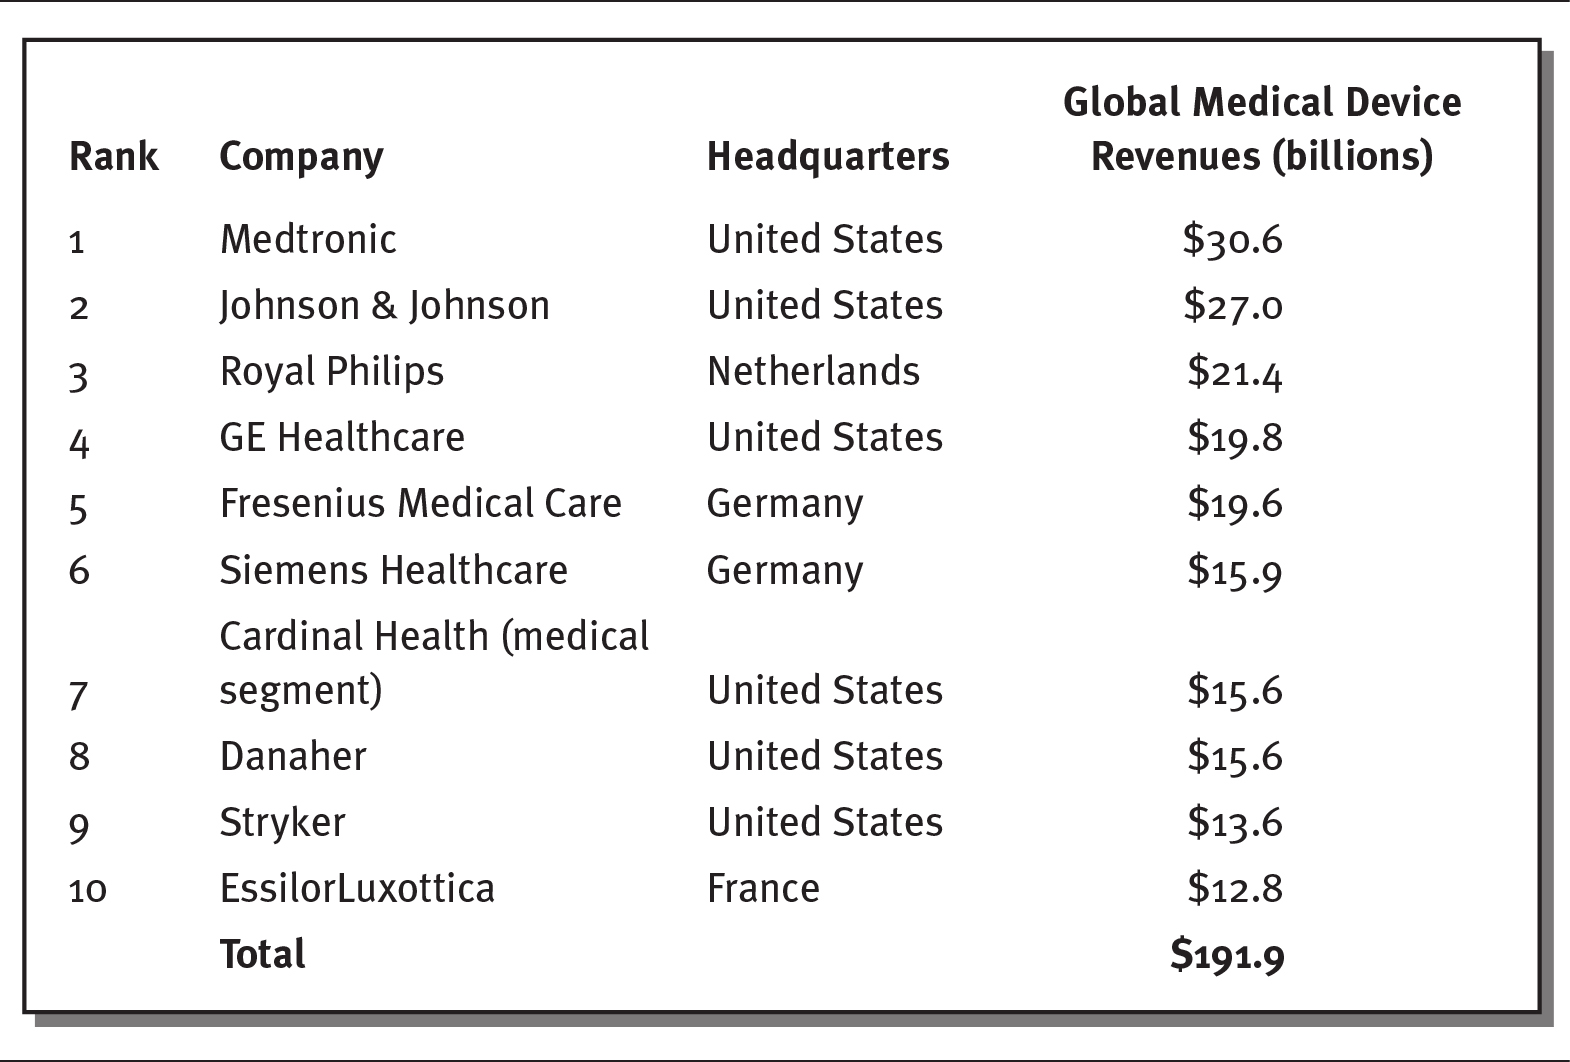
Similar to the pharmaceutical industry, the medical device industry generates considerable revenues and profits, and large medical device companies enjoy high profit margins of 20 to 30 percent. For Medicare patients alone, hospitals spend more than $24 billion per year on medical supplies. The annual market for the medical device industry exceeds $150 billion in the United States and accounts for 4 to 6 percent of all US healthcare spending. More than 5,500 firms make up this industry, employing over 2 million people in the United States. While most medical devices companies are small—80 percent have fewer than 50 employees, and 88 percent have fewer than 100 workers (MedPAC 2017; SelectUSA 2020)—a few large companies make up most of the industry’s revenues and employment. As shown in exhibit 4.10, the ten largest medical device firms generate more than $190 billion in global revenues per year.
EXHIBIT 4.10 Ten Largest Medical Device Companies, 2018
Details
The details of the rank, company name, headquarters, and global medical device revenues in billions are as follows:
- Rank 1, Medtronic, United States, 30.6 billion dollars.
- Rank 2, Johnson and Johnson, United States, 27.0 billion dollars.
- Rank 3, Royal Philips, Netherlands, 21.4 billion dollars.
- Rank 4, GE Healthcare, United States, 19.8 billion dollars.
- Rank 5, Fresenius Medical Care, Germany, 19.6 billion dollars.
- Rank 6, Siemens Healthcare, Germany, 15.9 billion dollars.
- Rank 7, Cardinal Health (medical segment), United states, 15.6 billion dollars.
- Rank 8, Danaher, United States, 15.6 billion dollars.
- Rank 9, Stryker, United States, 13.6 billion dollars.
- Rank 10, EssilorLuxottica, France, 12.8 billion dollars.
- Total: 191.9 billion dollars.
Source: Data from Popa (2019).
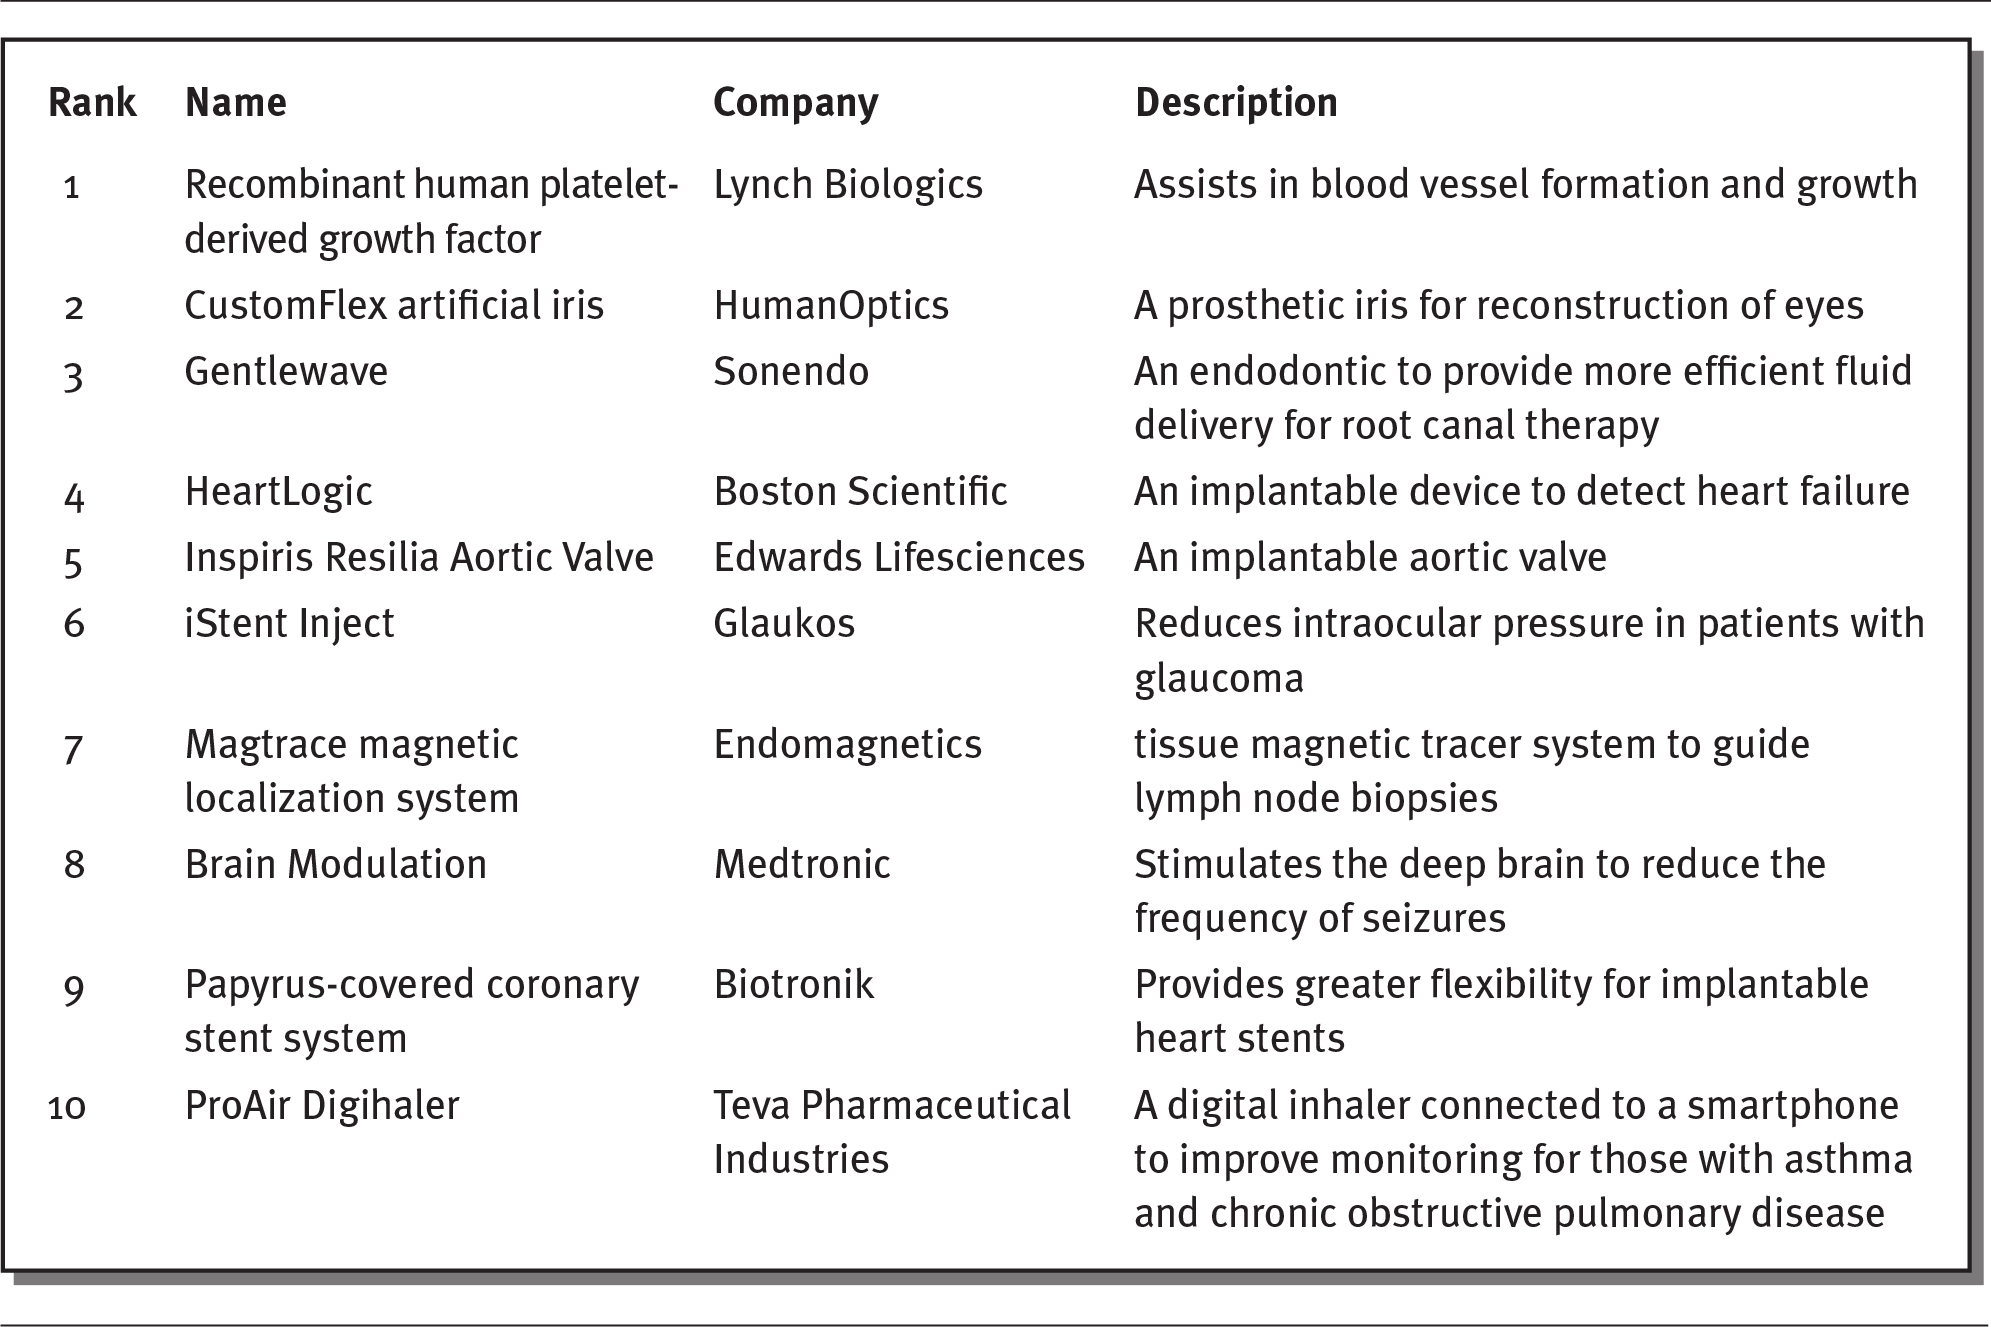
New medical devices are constantly being developed, with more than $2 billion spent each year on R&D. As illustrated in exhibit 4.11, new, innovative medical devices includes such diverse products as heart, eye, and brain devices (Kirsh 2019).
EXHIBIT 4.11 Ten Most Innovative Medical Devices of 2019
Details
The details of the rank, name of the device, company, and description of the device are as follows:
- Rank 1: Recombinant human platelet- derived growth factor.
Company: Lynch Biologics
Description: Assists in blood vessel formation and growth. - Rank 2: CustomFlex artificial iris
Company: HumanOptics
Description: A prosthetic iris for reconstruction of eyes. - Rank 3: Gentlewave
Company: Sonendo
Description: An endodontic to provide more efficient fluid delivery for root canal therapy. - Rank 4: HeartLogic
Company: Boston Scientific
Description: An implantable device to detect heart failure. - Rank 5: Inspiris Resilia Aortic Valve
Company: Edwards Lifesciences
Description: An implantable aortic valve. - Rank 6: iStent Inject
Company: Glaukos
Description: Reduces intraocular pressure in patients with glaucoma. - Rank 7: Magtrace magnetic localization system
Company: Endomagnetics
Description: Tissue magnetic tracer system to guide lymph node biopsies. - Rank 8: Brain Modulation
Company: Medtronic
Description: Stimulates the deep brain to reduce the frequency of seizures. - Rank 9: Papyrus-covered coronary stent system
Company: Biotronik
Description: Provides greater flexibility for implantable heart stents. - Rank 10: ProAir Digihaler
Company: Teva Pharmaceutical Industries
Description: A digital inhaler connected to a smartphone to improve monitoring for those with asthma and chronic obstructive pulmonary disease.
Source: Kirsh (2019).
Medical devices are extremely costly for hospitals, particularly in the areas of orthopedics, neurosurgery, cardiovascular surgery, and interventional cardiology. In fact, the cost to hospitals for medical devices may equal what a hospital gets paid to perform the procedure using the device. For instance, the cost of a neuro-stimulator implant is 85 percent of the amount that a hospital would be reimbursed for the procedure (Paavola 2019). As illustrated in the sidebar, even procedures with good clinical outcomes might have negative financial consequences for hospitals.
 LOW REIMBURSEMENTS FOR SOME MEDICAL DEVICES
Cardiovascular surgeons have found significant clinical benefits from implanting a MitraClip device to reduce heart failure and hospitalizations. Studies have shown a 47 percent reduction in heart failure in patients using this device. Hospitals are reimbursed between $28,398 and $40,176 for these procedures, but the device alone costs about $30,000—resulting in a loss of about $10,000 per procedure. Although these procedures have positive clinic outcomes, hospitals appear to have financial incentives to avoid them (Wendling 2019).
In the future, Medical device companies are predicted to expand more into wearable medical devices. Wearable medical devices are used to diagnose and monitor medical conditions. Some of these products are now used to encourage general wellness. For instance, the Apple Series 4 watch, which has EKG (electrocardiogram) and heart monitoring functions, has been recognized as a Class II medical device by the FDA (Speer 2018). Although these devices are increasingly popular, insurance companies do not generally reimburse patients for them, and many patients and providers are still unaware of their scope and potential. Nevertheless, many industry observers believe that by 2021, sales of wearable medical devices will reach $12 billion (Shepard 2018).
SUMMARY
The pharmaceutical and medical device industries are large and important components of the US healthcare system. The pharmaceutical industry is responsible for the discovery, manufacture, and distribution of prescription drugs. Before drugs can be made available to consumers, they must be approved by the US Food and Drug Administration, the federal agency that regulates drugs in the United States.
The pharmaceutical industry is a global business. Six of the ten largest pharmaceutical companies are headquartered in the United States, although all of the companies sell drugs worldwide. The industry continues to innovate and produce new products, but this innovation comes with a high price tag—estimated at $2.6 billion per new product. Even considering the high research and development (R&D) costs, the pharmaceutical industry remains extraordinarily profitable, with average profit margins of 20 to 30 percent.
The pharmaceutical industry produces both brand-name and generic drugs. Brand-name drugs receive patent protection, which gives the manufacturer exclusive protection to produce and sell the drug for a limited period of time, usually 20 years. After that time, other companies can produce generic versions of brand-name drugs. Generic drugs have the same dosage, intended use, administration, and strength of the original drug, but they often are sold at a lower cost.
The use of prescriptions continue to increase, driven by the aging US population. Older adults use many more drugs per person than younger people. In addition, the United States spends much more than other countries on prescription drugs, primarily because of higher prices. High drug costs are a burden on US government spending, as the federal government pays more than 40 percent of prescription drug costs. The US government’s prescription drug costs increased with the implementation of Medicare Part D.
Healthcare organizations seek to control drug costs by using formularies, which are approved drug lists. These lists are created by experts based on drug cost, safety, and effectiveness. Formularies are organized by tiers, which correspond to the amount that consumers pay. Pharmacy benefit managers (PBMs) were established to set formularies and lower prescription drug prices for health insurance companies. Today, the largest three PBMs are owned by insurance companies; some question their commitment to passing savings onto healthcare consumers.
Drug discovery is expensive: Taking a single drug to market may cost billions of dollars in R&D. Most pharmaceutical company revenues (90 percent) come from products that were developed more than five years ago. Some believe that advances in mobile communication and artificial intelligence will facilitate the development of new drugs in the future.
The medical device industry represents a variety of different products and billions of dollars in expenditures. Although many medical device firms operate in the United States, just a few make up most of the industry’s revenues and employment. The medical device industry continues to innovate, with significant impacts on consumers’ health and healthcare costs.
QUESTIONS
- What is the difference between a patented brand-name drug and a generic drug?
- Why does the United States spend more per capita on prescription drugs than other countries?
- Why does the US federal government spend so much on prescription drugs?
- What is a formulary, and how does it save money?
- What are the four phases of clinical trials, and what does phase each focus on?
ASSIGNMENTS
- Look at Johnson & Johnson’s product website at www.jnj.com/healthcare-products. Identify ten types of medical devices that the company produces. Which are expensive, and which are relatively lower in cost?
- Read the following article: “Why Our Drugs Cost So Much,” AARP, May 1, 2017, at www.aarp.org/health/drugs-supplements/info-2017/rx-prescription-drug-pricing.html. Write a one-page paper explaining why prescription drug prices are so high in the United States.
CASES
THE CHALLENGE OF INCREASING PRICES
Chuck, an independent truck driver who had diabetes, had to make a tough choice when he was informed that his health insurance plan would no longer cover the brand of insulin, Humalog, that he had used for 17 years to control his type 1 diabetes. The change was precipitated by a spike in the price of Humalog—a 290 percent cost increase over ten years. As a result, Humalog was taken off the insurance company’s formulary, causing Chuck’s copayment for a 90-day supply of the drug to increase almost threefold, to $500. As he appealed the sudden and costly change in coverage, he decreased his dose of Humalog. Lacking the insulin he needed, Chuck became so sick that he had to go to the emergency room several times with dangerously high blood sugar levels. Being ill made it difficult for Chuck to continue driving, which lowered his income, making it even more difficult for him to buy insulin.
Discussion Questions
- How do increases in drug costs affect patients?
- Why does taking a drug off a formulary increase the prices to the consumer?
- What should Chuck do?
MEDICAL DEVICE REPRESENTATIVES IN THE OPERATING ROOM
Sue works as a medical device salesperson, selling titanium screws designed for orthopedic surgery. She enters the operating room at the invitation of the doctor and provides verbal instructions to surgeons as they operate. At times, she has even has physical contact with patients. Sue sees this interaction as very important, especially for sales of new technology and innovative products. In such cases, she often has more knowledge about the product than the doctors. Since most of her compensation comes from commissions based on her sales, she is willing to help doctors choose her products.
Discussion Questions
- What problems could arise from having medical device representatives in the operating room? For background, read the following article: “Why Is That Salesman in the Operating Room for Your Knee Replacement,” Washington Post, November 14, 2016, at www.washingtonpost.com/national/health-science/why-is-that-salesperson-in-the-operating-room-for-your-knee-replacement/2016/11/14/ab8172fa-78e6-11e6-beac-57a4a412e93a_story.html?utm_term=.07e1b96feb23.
- Should medical device salespeople be banned from the operating room? For background, read the following article: “Will the Sales Representative in the Operating Room Become Extinct?,” Strategic Dynamics, February 1, 2016, at https://strategicdynamicsfirm.com/will-the-sales-representative-in-the-operating-room-become-extinct/.
REFERENCES
AARP. 2017. “Why Prescription Drugs Cost So Much.” AARP Bulletin. Published May. www.aarp.org/health/drugs-supplements/info-2017/rx-prescription-drug-pricing.html.
Amin, T. 2018. “The Problem with High Drug Prices Isn’t Foreign Freeloading, It’s the Patent System.” CNBC. Published June 27. www.cnbc.com/2018/06/25/high-drug-prices-caused-by-us-patent-system.html.
Anderson, L. 2019. “Over the Counter Medications.” Drugs.com. Reviewed May 7. www.drugs.com/otc/.
Barton, C. 2020. “Annual Revenue of Top 10 Big Pharma Companies.” The Pharma Letter. Published March 3. www.thepharmaletter.com/article/annual-revenue-of-top-10-big-pharma-companies.
Bishop, S. 2018. “Policy Prescriptions for High Drug Costs: Experts Weigh In.” Commonwealth Fund. Published April 3. www.commonwealthfund.org/blog/2018/policy-prescriptions-high-drug-costs-experts-weigh.
Blue Care Network of Michigan. 2020. “How Do Drug Tiers Work?” Accessed April 6. www.bcbsm.com/medicare/help/understanding-plans/pharmacy-prescription-drugs/tiers.html.
Bluth, R. 2019. “Can Someone Tell Me What a PBM Does?” Kaiser Health News. Published April 9. https://khn.org/news/senate-hearing-drug-pricing-lesson-on-pharmacy-benefit-managers/.
Boseley, S. 2018. “Why Do New Medicines Cost So Much, and What Can We Do About It?” The Guardian. Published April 9. www.theguardian.com/news/2018/apr/09/why-do-new-medicines-cost-so-much-and-what-can-we-do-about-it.
Brookings Institution. 2017. “Ten Challenges in the Prescription Drug Market—and Ten Solutions.” Policy Brief. Published May 2. www.brookings.edu/research/ten-challenges-in-the-prescription-drug-market-and-ten-solutions/.
Campbell, K. 2019. “Why Are Prescription Drug Prices Rising?” U.S. News & World Report. Published February 6. https://health.usnews.com/health-care/for-better/articles/2019-02-06/why-are-prescription-drug-prices-rising.
Chen, Y., J. Dikan, J. Heller, and J. Santos da Silva. 2018. “Five Things to Know About Biosimilars Right Now.” McKinsey & Company. Published July 17. www.mckinsey.com/industries/pharmaceuticals-and-medical-products/our-insights/five-things-to-know-about-biosimilars-right-now.
ClinicalTrials.gov. 2020. “Trends, Charts, and Maps.” US National Library of Medicine. Accessed April 6. https://clinicaltrials.gov/ct2/resources/trends.
Commonwealth Fund. 2019. “Pharmacy Benefit Managers and Their Role in Drug Spending.” Published April 22. www.commonwealthfund.org/publications/explainer/2019/apr/pharmacy-benefit-managers-and-their-role-drug-spending.
Coombs, B. 2014. “For Sovaldi Patients, Expensive Hepatitis C Cure Is Priceless.” CNBC. Published May 23. www.cnbc.com/2014/05/23/for-sovaldi-patients-expensive-hepatitis-c-cure-is-priceless.html.
Drug Channels. 2019. “CVS, Express Scripts, and the Evolution of the PBM Business Model.” Published May 29. www.drugchannels.net/2019/05/cvs-express-scripts-and-evolution-of.html.
Drugs.com. 2020. “FDA Approval Process.” Accessed June 28. www.drugs.com/fda-approval-process.html.
Ellis, M. 2019. “Who Are the Top 10 Pharmaceutical Companies in the World? (2010).” Proclinical. Published March 20. www.proclinical.com/blogs/2018-3/the-top-10-pharmaceutical-companies-in-the-world-2018.
Fleming, N. 2018. “How Artificial Intelligence Is Changing Drug Discovery.” Nature. Published May 30. www.nature.com/articles/d41586-018-05267-x.
Forbes. 2018. “Express Scripts” Published June 6. www.forbes.com/companies/express-scripts/#38a2a2c3cc70.
Glick, H. A., S. McElligott, M. V. Pauly, R. J. Willke, H. Bergquist, J. Doshi, L. A. Fleisher, B. Kinosian, E. Perfetto, D. E. Polsky, and J. S. Schwartz. 2015. “Comparative Effectiveness and Cost-Effectiveness Analyses Frequently Agree on Value.” Health Affairs 34 (5): 805–11.
Gordon, S. 2019. “Why Are Insulin Prices Still So High for Patients in the U.S.?” U.S. News & World Report. Published November 6. www.usnews.com/news/health-news/articles/2019-11-07/why-are-insulin-prices-still-so-high-for-us-patients.
Hagan, S. 2019. “Nearly One in Two Americans Takes Prescription Drugs: Survey.” Bloomberg News. Published May 7. www.bloomberg.com/news/articles/2019-05-08/nearly-one-in-two-americans-takes-prescription-drugs-survey.
Harrer, S., P. Shah, B. Antony, and J. Hu. 2019. “Artificial Intelligence for Clinical Trial Design.” Trends in Pharmacological Sciences 40 (8): 577–91.
Hirschler, B. 2018. “How the U.S. Pays 3 Times More for Drugs.” Scientific American. Published October 13. www.scientificamerican.com/article/how-the-u-s-pays-3-times-more-for-drugs/.
Kang, S., M. DiStefano, M. Socal, and G. Anderson. 2019. “Part D to Reduce Drug Price Differentials with Other Countries.” Health Affairs 38 (5): 804–11.
Kaiser Family Foundation. 2019. “An Overview of the Medicare Part D Prescription Drug Benefit.” Published November 13. www.kff.org/medicare/fact-sheet/an-overview-of-the-medicare-part-d-prescription-drug-benefit/.
Kirsh, D. 2019. “The 17 Most Innovative Medical Devices of 2019.” Medical Design & Outsourcing. July 18. www.medicaldesignandoutsourcing.com/17-most-innovative-medical-devices-2019/2/.
Kirzinger, A., T. Neuman, J. Cubanski, and M. Brodie. 2019. “Data Note: Prescription Drugs and Older Adults.” Kaiser Family Foundation. Published August 9. www.kff.org/health-reform/issue-brief/data-note-prescription-drugs-and-older-adults/.
Kodjak, A. 2016. “Tighter Patent Rules Could Help Lower Drug Prices, Study Shows.” National Public Radio. Published August 23. www.npr.org/sections/health-shots/2016/08/23/491053523/tighter-patent-rules-could-help-lower-drug-prices-study-shows.
Kresge, N., and J. Lauerman. 2019. “Big Pharma Faces the Curse of the Billion-Dollar Blockbuster.” Bloomberg Businessweek. Published January 11. www.bloomberg.com/news/articles/2019-01-11/big-pharma-faces-the-curse-of-the-billion-dollar-blockbuster.
Leaf, C. 2018. “How Stale Is Innovation in Drug Discovery? Think: 5-Year-Old Yogurt.” Fortune. Published March 6. http://fortune.com/2018/03/06/big-pharma-innovation-rut/.
Ledley, F., S. McCoy, and G. Vaughan. 2020. “Profitability of Large Pharmaceutical Companies Compared with Other Large Public Companies.” Journal of the American Medical Association 323 (9): 834–43.
mAbxience. 2020. “Generics, Biologics, Biosimilars: Who’s Who?” Accessed June 3. www.mabxience.com/products/biosimilar/generics-biologics-biosimilars-whos-who/.
Macrotrends. 2020. “CVS Health Operating Income 2006–2020.” www.macrotrends.net/stocks/charts/CVS/cvs-health/operating-income.
Mather, M., L. A. Jacobson, and K. M. Pollard. 2015. “Fact Sheet: Aging in the United States.” Population Bulletin 70 (2). www.prb.org/wp-content/uploads/2016/01/aging-us-population-bulletin-1.pdf.
Medicare Payments Advisory Commission (MedPAC). 2017. “An Overview of the Medical Device Industry.” Report to Congress: Medicare and the Healthcare Delivery System. Published June. http://medpac.gov/docs/default-source/reports/jun17_ch7.pdf?sfvrsn=0.
Moa, A. 2019. “6 Pharma Trends for 2019 That Will Set the Pace for Industry.” Tribeca Knowledge. Published January 14. www.tribecaknowledge.com/blog/top-6-pharma-trends-for-2019-that-will-set-the-pace-for-industry.
Moore, T., H. Zhang, G. Anderson, and G. Alexander. 2018. “Estimated Costs of Pivotal Trials for Novel Therapeutic Agents Approved by the U.S. Food and Drug Administration, 2015–2016.” JAMA Internal Medicine 178 (11): 1451–57.
National Conference of State Legislatures (NCSL). 2019. “Comparative Effectiveness and Academic Detailing to Evaluate Prescription Drugs.” Published May 21. www.ncsl.org/research/health/comparative-effectiveness-and-academic-detailing-to-evaluate-prescription-drugs.aspx.
O’Brien, J. 2020. “UnitedHealth Group Ends 2019 with $242 B in Revenues.” HealthLeaders. Published January 15. www.healthleadersmedia.com/finance/unitedhealth-group-ends-2019-242b-revenues.
Ollove, M. 2019. “Drug-Price Debate Targets Pharmacy Benefit Managers.” Pew Charitable Trusts. Published February 12. www.pewtrusts.org/en/research-and-analysis/blogs/stateline/2019/02/12/drug-price-debate-targets-pharmacy-benefit-managers.
O’Reilly, K. 2019. “Time to Scrutinize PBMs’ Outsized Role in Rx Decision-Making.” American Medical Association. Published June 10. www.ama-assn.org/delivering-care/public-health/time-scrutinize-pbms-outsized-role-rx-decision-making.
Paavola, A. 2019. “Top PBMs by Market Share.” Becker’s Hospital Review. Published May 30. www.beckershospitalreview.com/pharmacy/top-pbms-by-market-share.html.
PCG. 2018. Rising Prescription Drug Costs: A Report on State and Federal Efforts to Contain Costs. Published March. www.publicconsultinggroup.com/media/1594/rising-prescription-drug-costs-state-and-federal-efforts-to-contain-costs.pdf.
Pear, R. 2018. “Paying Twice: A Push for Affordable Prices for Taxpayer-Funded Drugs.” New York Times. Published May 28. www.nytimes.com/2018/05/28/us/politics/drug-prices.html.
Pharmaceutical Commerce. 2019. “Global Pharma Spending Will Hit $1.5 Trillion in 2023, Says IQVIA.” Published January 29. https://pharmaceuticalcommerce.com/business-and-finance/global-pharma-spending-will-hit-1-5-trillion-in-2023-says-iqvia/.
Pisani, J., and M. Lee. 2017. “A Critical Makeover for Pharmaceutical Companies: Overcoming Industry Obstacles with a Cross-Functional Strategy.” Strategy&, PwC. Published January 10. www.strategyand.pwc.com/reports/critical-makeover-pharmaceutical-companies.
Popa, R. 2019. “The World’s Top 10 Largest Medical Device Companies.” Becker’s ASC Review. Published September 18. www.beckersasc.com/supply-chain/the-world-s-top-10-largest-medical-device-companies.html.
Sarnak, D. O., D. Squires, and G. Kuzmak. 2017. “Paying for Prescription Drugs Around the World: Why Is the U.S. an Outlier?” Commonwealth Fund. Published October 2017. www.commonwealthfund.org/publications/issue-briefs/2017/oct/paying-prescription-drugs-around-world-why-us-outlier.
Seladi-Schulman, J. 2019. “What Happens in a Clinical Trial?” Healthline. Updated June 21. www.healthline.com/health/clinical-trial-phases.
SelectUSA. 2020. “Medical Technology Spotlight.” Accessed June 2. www.selectusa.gov/medical-technology-industry-united-states.
Shepard, S. 2018. “Wireless Wearables: Challenges to Tackle.” MD+DI. Published November 12. www.mddionline.com/wireless-wearables-challenges-tackle.
Speer, J. 2018. “Predictions for the Medical Device Industry in 2019.” Greenlight Guru. Published December 9. www.greenlight.guru/blog/medical-device-industry-predictions-2019.
Speights, K. 2016. “12 Big Pharma Stats That Will Blow You Away.” The Motley Fool. Published July 31. www.fool.com/investing/2016/07/31/12-big-pharma-stats-that-will-blow-you-away.aspx.
Stone, K. 2019. “List of Best-Selling Over-the-Counter (OTC) Drugs.” Verywell Health. Published August 10. www.verywellhealth.com/top-selling-otc-drugs-by-category-2663170.
Tribble, S. 2018. “Drugmakers Play the Patent Game to Ward Off Competitors.” NBC News. Published October. www.nbcnews.com/health/health-news/drugmakers-play-patent-game-ward-competitors-n915911.
US Food and Drug Administration (FDA). 2018a. “Minorities in Clinical Trials.” Reviewed August 6. www.fda.gov/consumers/minority-health/minorities-clinical-trials.
———. 2018b. “Step 3: Clinical Research.” Reviewed January 4. www.fda.gov/ForPatients/Approvals/Drugs/ucm405622.htm.
US Government Accountability Office (GAO). 2017. “Drug Industry: Profits, Research and Development Spending, and Merger and Acquisition Deals.” Report No. GAO-1840. Published November 17. www.gao.gov/products/GAO-18-40.
Wendling, P. 2019. “COAPT: MitraClip Adds Years of Life, but at a Steep Price.” Medscape. Published October 4. www.medscape.com/viewarticle/919450.