Chapter 11Technology in the Daily Lives of Adults
—
Killian Mullan
At the turn of the millennium, 44 per cent of households in the UK owned a computer, and 32 per cent were connected to the internet at home.1 Smartphones and tablet computers were not yet invented. A decade later, ownership of computers and home internet connection had increased to 77 per cent and 73 per cent respectively.2 At this point smartphones were relatively new, with just over one quarter of adults in the UK owning one,3 while the iPad tablet had just been released on the market. By 2014, 85 per cent of households in the UK owned a computer, and 82 per cent were connected to the internet.4 Moreover, smartphone ownership among adults had increased to 61 per cent, and there was a tablet computer in 44 per cent of UK households.5 Along with these changes in hardware, our use of the internet has also changed dramatically. Internet speeds and capacities have increased steadily over the past couple of decades, and our ability to use the internet for a wide variety of purposes on powerful mobile devices has firmly embedded technology and the internet into our daily lives.
The combination of changes in the available hardware, along with changes in the facilities afforded by the internet, has affected many aspects of our daily lives. These changes affect the way we interact with others, the way in which we consume media, the way in which we purchase goods and services, and the way in which we manage our personal finances. Firstly, they have expanded the ways in which we can do things. Today, for example, we can stream and watch TV on multiple devices, at times and places that suit us. Secondly, and relatedly, it enables multi-tasking, or task-shifting, in an entirely new way, and at unprecedented levels.6
Consider a simple situation where you are watching TV and the telephone rings. Prior to smartphones, and smart on-demand TV, the ringing telephone would have definitely constituted an interruption, presenting you with a stark choice: answer and forego watching TV, or ignore the telephone and forego talking to friends or family (for example). Modern technology lessens the starkness of this choice, perhaps even effectively removing it. It is now possible to pause TV (even including ‘live’ TV). While there would still be an interruption, taking the call would merely displace time watching TV to a slightly later time. Alternatively, communication with friends and family on mobile devices is now more likely to occur in tandem with watching TV (via social media or instant messaging), perhaps making the phone call less likely in the first place. For example, you might see that your friend is calling and not take the call, but text that you are ‘busy’ and will call them back later. In this regard, technology makes it easier to integrate communication with other activities.
This simple scenario demonstrates some of the ways in which technological change might influence basic choices and options in daily life – what to do and when to do it – but is it actually changing how we spend our time in general? There are a number of ways in which technological change might affect time use. Firstly, in a very direct way, there is little doubt that we are spending more time using computers and mobile devices today than we were a decade ago. Yet we know surprisingly little about the amount of time we spend using these devices on a daily basis. Secondly, the capacity for mobile devices to enable multi-tasking means that we can use them to accomplish various tasks, while engaging primarily in a wide range of different activities. For example, checking work email while eating, interacting with friends on social media while watching TV, watching TV while travelling, and so on. On this issue, we know next to nothing about the different types of activities we engage in when using computers and mobile devices. Thirdly, there is a question about whether the use of digital devices influences the amount of time we spend in particular activities. For example, as technology has become increasingly embedded in our daily lives, are we watching more or less TV, or spending more or less time interacting with others, either in person or ‘online’?
As well as potentially affecting how we spend our time, computers and mobile devices may impact upon our subjective experience of time. Rapid technological change, such as we have experienced in the past couple of decades, is often implicated in debates about the ‘speed-up society’, and feelings of time pressure and stress. The picture that is often presented in the media is of time-squeezed adults seeking to juggle the many different aspects of their lives, and finding it increasingly difficult as technology blurs traditional boundaries between home and work. In the face of this, there are recurring calls for a ‘digital detox’.7 Surprisingly, although technology can clearly influence how we use our time and how pressured it seems in myriad and sometimes contradictory ways,8 there is little actual evidence from time-use diary data that our daily lives have become increasingly congested or pressured over this period (see Chapter 13).
Much of the ongoing debate and controversy around the impact of technology focuses attention on children, young people and the general working-age population. However, older adults’ use of technology is also increasingly of interest in the context of an ageing population. While for children the concern is that they are spending too much time using technology (see Chapter 10), for older adults the reverse is the case. Here, interest centres on the fact that older adults are much less likely to access and use technology, with negative implications for their health and wellbeing.9 Access to technology and the internet provides a critical means of maintaining social contact with family and others for those who are less mobile,10 and is increasingly a primary source of information on vital government services.11 Bearing this in mind, there is concern that older adults are excluded from accessing many of the benefits of technological change enjoyed by the wider population. This chapter provides a first insight into the time older adults spend using computers and mobile devices today, and the different activities they engage in when using digital devices. So while the first part of this chapter focuses on adults aged 19–59, the second part focuses on the time older adults (aged 60 and over) spend using computers and mobile devices. For both we examine patterns relating to gender (as previous data show that a higher proportion of men report using the internet than women12) and social class, exploring associations between device use, time pressure and subjective wellbeing.
Adults’ time using computers and other digital devices: 2000 and 2015
In line with national trends reported above, the proportion of respondent households in the UK 2014–2015 Time Use Survey with home computers, and internet connections at home, increased substantially between 2000 and 2015.13 Not surprisingly therefore, as shown in Table 11.1, adults’ time using computers as a main activity increased almost three-fold, from 10 minutes in 2000 to 28 minutes in 2015. These increases were found for both men and women, and in all age groups. Looking at patterns relating to gender and age in each year, men spent more time using computers than women in both 2000 and 2015. This gender difference in time using computers as a main activity was found within all age groups analysed at both time points, though the difference is largest among young adults aged 19–29. With respect to age, younger adults (aged 19–29) averaged more time using computers than adults aged 30 and over, in both 2000 and 2015. Note, however, that adults aged 19–29 spend a half hour less on average using devices than teenagers aged 16–18 (see Chapter 10). At 16–18 years old, teenagers therefore represent the peak age for time spent using devices.
Table 11.1 also shows, for 2015 only, the average time men and women aged 19–59 spend using digital devices (smartphones, tablets, or computers) when they do not report using computers as their main activity (‘other time using devices’). We can see that today, using computers as a main activity comprises only a fraction of all the time we spend using technology, and that for the vast majority of the total time adults are using digital devices they do not report using a computer as their main activity (2 hours 54 minutes, compared with 28 minutes in 2015). Men average more time using digital devices when doing a main activity other than using a computer than women, and time spent using such devices decreases with age. In further analysis cross-tabulating age by gender (not shown), we found that while there is a gender difference among the older age groups, among young adults (aged 19–29) there was no difference in the time that men and women spent using digital devices. Also, there were no age differences in the time spent using such devices between men aged 19–29 and 30–49. Only 50–59 year-old men spent less time using digital devices than other men.
Table 11.1
Average time per day spent using computers as a primary activity (2000 and 2015), and using devices (2015), UK
| Using computers (main activity) |
Other time using devices |
||
|---|---|---|---|
| 2000 | 2015 | 2015 | |
| All | 0:10 | 0:28 | 2:54 |
| Men | 0:15 | 0:35 | 3:10 |
| Women | 0:05 | 0:21 | 2:38 |
| 19–29 years | 0:14 | 0:37 | 3:24 |
| 30–49 years | 0:09 | 0:25 | 2:55 |
| 50–59 years | 0:07 | 0:27 | 2:27 |
Note: Time using computers includes playing computer games and internet shopping; device use includes time using computers, smartphones, and tablets.
These results show that the widespread use of smartphones and tablets, as well as laptops and ‘traditional’ desktops, has greatly expanded the amount of time we spend using technology. They also suggest that we incorporate these devices extensively into different activities. For the remainder of this chapter we dig further into the time adults spend using devices when they are not using computers as their main activity (‘other time using devices’). In particular, we want to learn more about the ways in which they incorporate digital technology into their daily lives by looking at the different types of activities that adults do when they are using digital devices. Figure 11.1 shows the broad distribution of time that adults spend using devices (net of time using computers as a main activity), for men and women (upper panel), and adults in different age groups (lower panel). This shows that the most frequent amount of time adults spend using devices is between 10 minutes and 2 hours per day (‘up to 2 hours’ column). This holds for both men and women, though this peak is more marked for women (at 42.6 per cent v. 34.4 per cent). It also holds for adults in all age groups, although the peak is higher for adults aged 30 and over (around 40 per cent) than for younger adults aged 19–29 (35.3 per cent). Just over one quarter of men, and adults aged 19–29, spend 5 or more hours using a device. In contrast, only around one fifth of women, and adults aged 30 and over, spend 5 or more hours using a device.
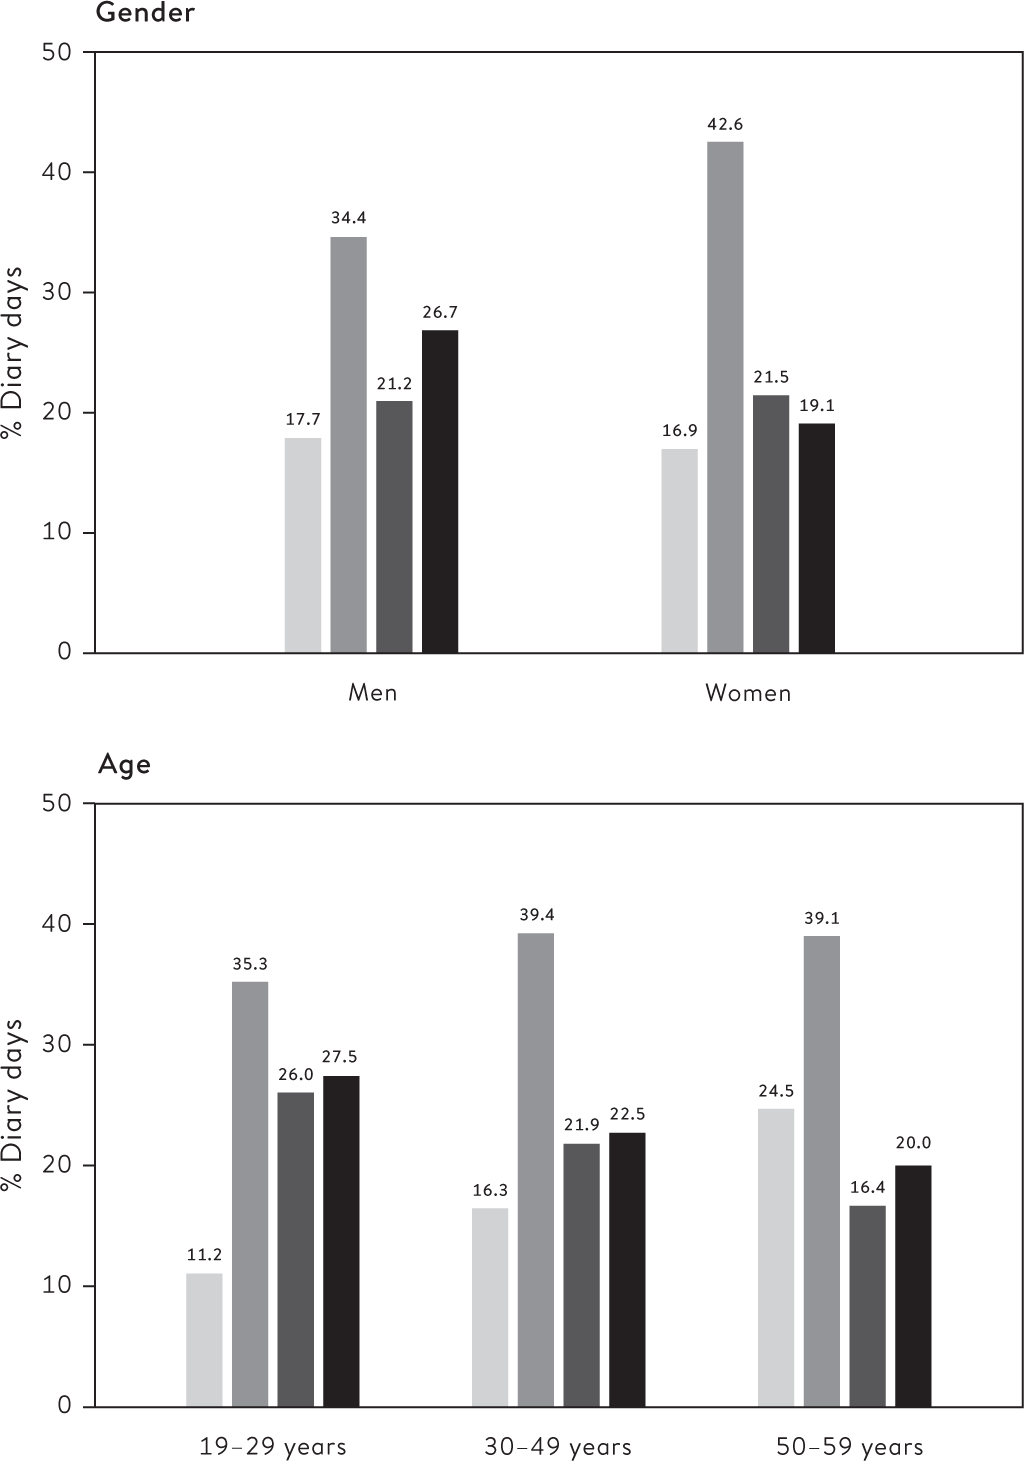
Figure 11.1 Distribution of adults’ time using devices by gender and age, UK (2015)
 5 hours or more
 2–5 hours
 Up to 2 hours
 None
None
What are adults doing when using devices?
Mobile devices offer unprecedented capacity to incorporate the use of technology across a wide range of daily activities. Here we examine the amount of time adults spend in four major activity groups, differentiating between time in these activities when using a device and when not using a device. These activities are: 1) paid work; 2) domestic work; 3) leisure and personal activities (excluding sleep); and 4) travel. Figure 11.2 shows time using devices (dark shading) and not using devices (light shading) during these four activities for men and women, and Figure 11.3 shows patterns for adults in different age groups.
In Figure 11.2 we see that the gender difference in total time using devices in 2015 is most pronounced in respect of time using them while doing paid work. Men report using devices in paid work for 95 minutes, compared to 71 minutes for women. Women also spend less time using devices during leisure and personal activities, and travel, but the differences are much smaller than those shown for paid work. Lastly, women spend slightly more time using devices when engaging in domestic work, but this pales in comparison with gender differences in total time in domestic work activities (Chapter 5).
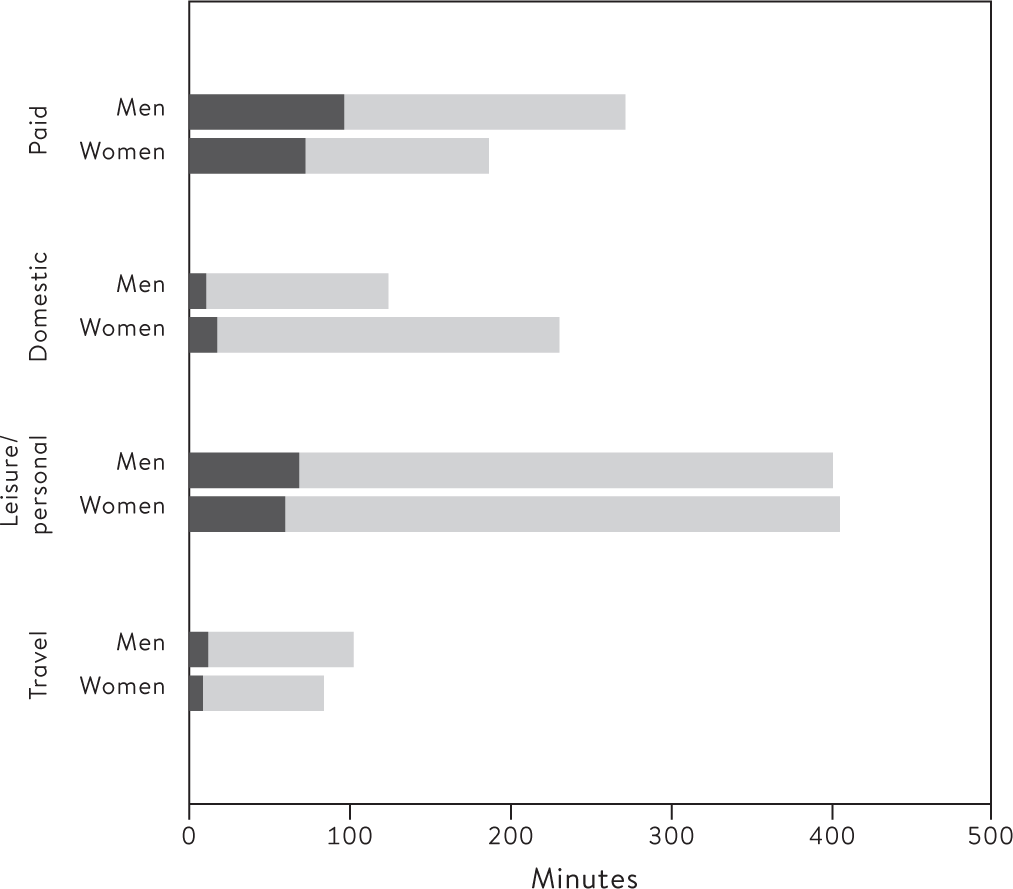
Figure 11.2 Time using and not using devices in four major activity groups: men and women aged 19’59, UK (2015)
Not using device
Using device
Patterns across different age groups, shown in Figure 11.3, are somewhat different. Here, time using devices at work was relatively similar across age groups. In fact, workers aged 30 and over report more time using a device at work than their younger counterparts. Further analysis showed that the increased time working with a device among high device users (5+ hours) was especially pronounced for older workers, highlighting that the use of technology at work is far from the preserve of the young. The age differences in total time using a device in 2015 seen in Table 11.1 is shown in Figure 11.3 to be concentrated in the time adults spend using devices while engaging in leisure and personal activities, and while travelling. Younger adults averaged most time using devices in these activities. Adults aged 19–29 averaged 85 minutes using a device while engaging in leisure and personal activities compared with 45 minutes for adults aged 50–59. Interestingly, the latter averaged more time in these activities overall, which is partly a reflection of age-related differences in paid work. A closer examination of device use during different leisure activities is the focus of the next section.
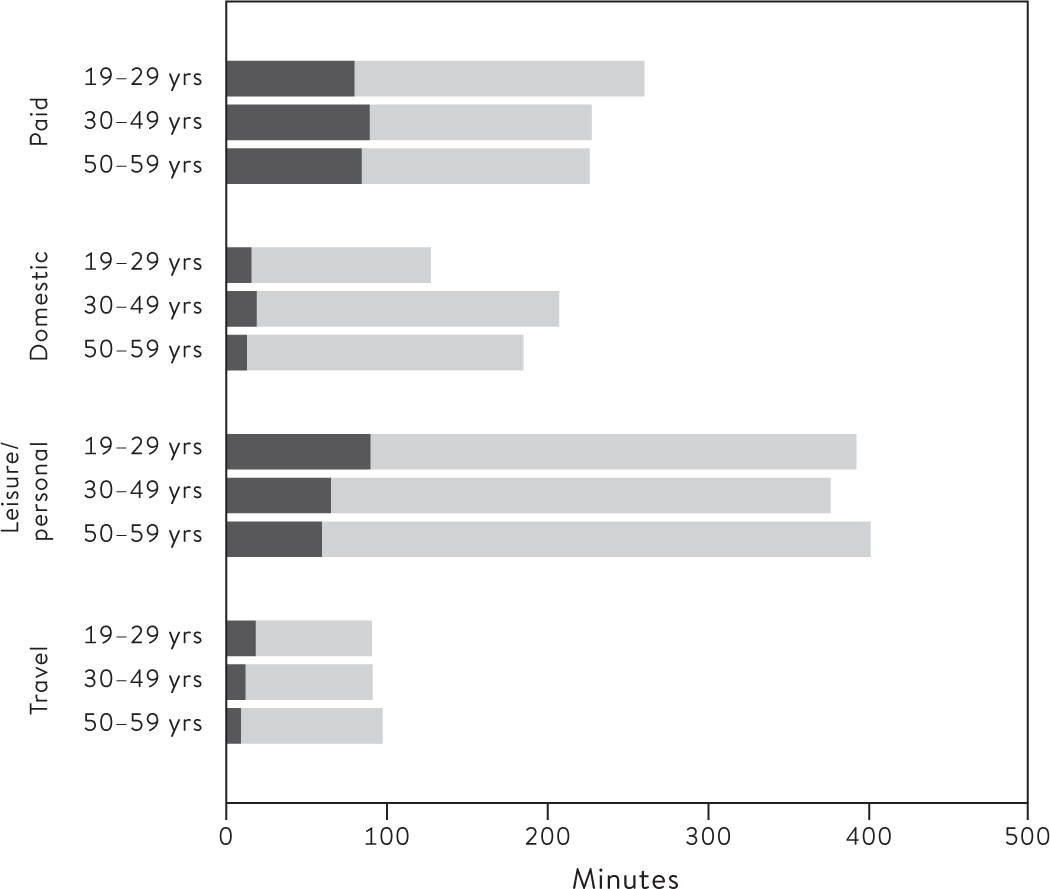
Figure 11.3 Time using and not using devices in four major activity groups by age group, UK (2015)
Not using device
Using device
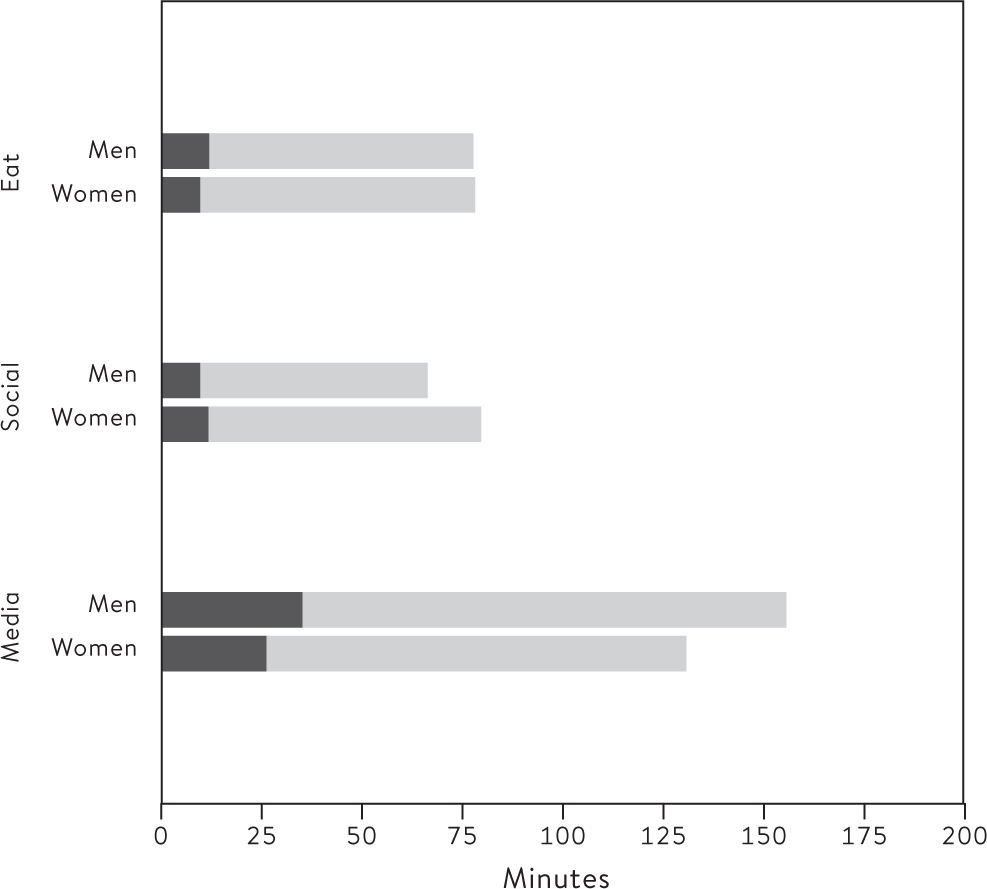
Figure 11.4 Time using and not using devices in selected leisure/personal activities by gender: men and women aged 19–59, UK (2015)
Not using device
Using device
What leisure and personal activities are adults doing when using devices?
Leaving paid work aside, for the majority of time they spend using digital devices, adults are engaging in leisure and personal activities. Most device use during this time is spent while eating, in social activities, and in media activities (primarily watching TV).14 In this section we examine time when adults report using a digital device when engaging in these three central personal and leisure activities. Figure 11.4 shows time using devices (dark shading) and not using devices (light shading) during these three activities for men and women, and Figure 11.5 shows patterns for adults in different age groups.
Overall, gender difference in leisure time using a device is concentrated in media activities (Figure 11.4). Men average 35 minutes using a device while engaging in media activities compared with 26 minutes for women. Women average very slightly more time than men using devices in social activities (11 mins v. 9 mins). With respect to age, Figure 11.5 showed that older adults spent less time using devices during leisure and personal activities in general than their younger counterparts. We can see from Figure 11.5 that this applies across each of the three separate leisure activities considered here. That is, younger adults spend more time using a device when eating, during social activities, and media activities than adults aged 30 years and over. For example, adults in their 20s averaged close to 40 minutes using devices during time in media activities, which decreases to 23 minutes for adults in their 50s.
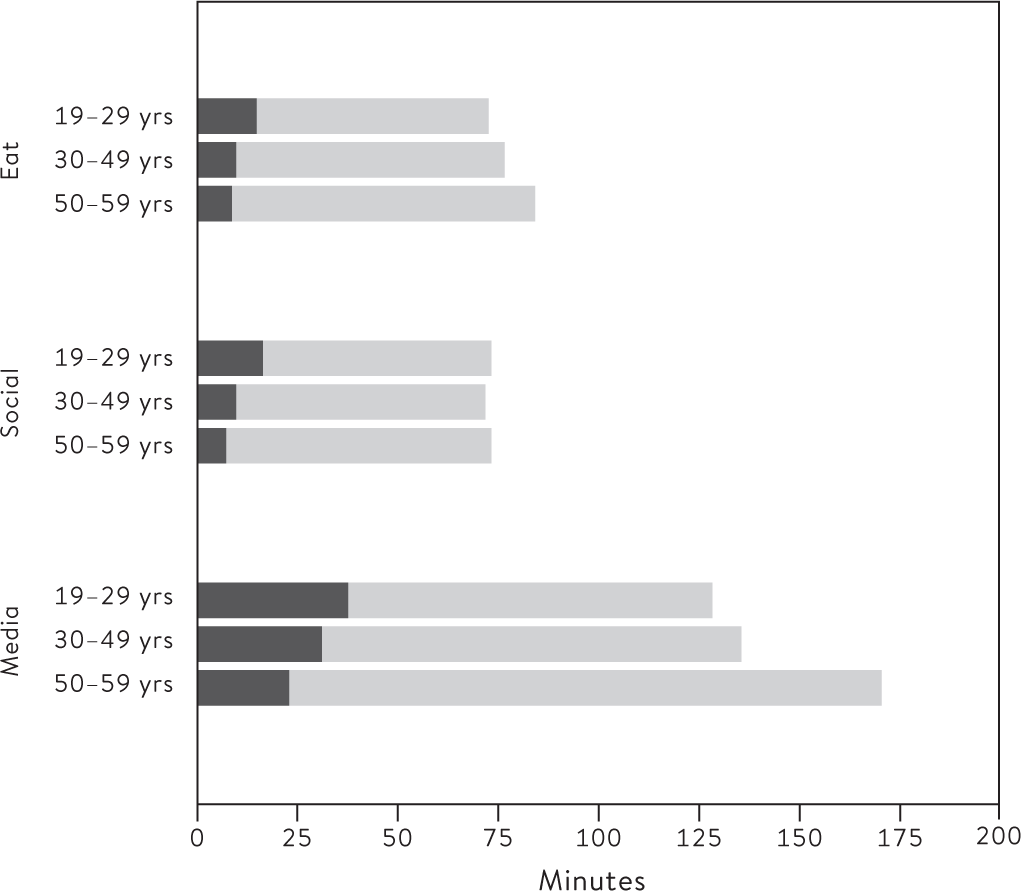
Figure 11.5 Time using and not using devices in selected leisure/personal activities by age group, UK (2015)
Not using device
Using device
Device use and social class
We have seen that both gender and age are strongly associated with certain elements of adults’ time spent using devices. Previous data suggest that there might also be a digital divide by class, with a positive association between socio-economic status and adults’ use of technology and the internet (see above). To investigate this, we compared the time adults in different occupational social classes spend using devices in paid work, and in leisure and personal activities. The results, shown in Figure 11.6, reveal that time using a device while working varies substantially across workers in different social classes. Professionals and managers average the most time using a device during work (133 minutes), followed by those in intermediate occupations (83 minutes), while workers in routine and manual occupations spend the least time using a device while working (36 minutes). This result most likely reflects differences in the types of jobs workers in different occupations perform. But it is not just about the attributes of the job. It is also likely to reflect differences in the extent to which workers are able to incorporate the use of technology (in particular mobile devices) for other activities while working (listening to music, for example). In striking contrast, there are no differences related to social class in the time adults spend using devices during their leisure and personal activities. This overall picture is replicated across different age groups, and for both men and women (results not shown).15
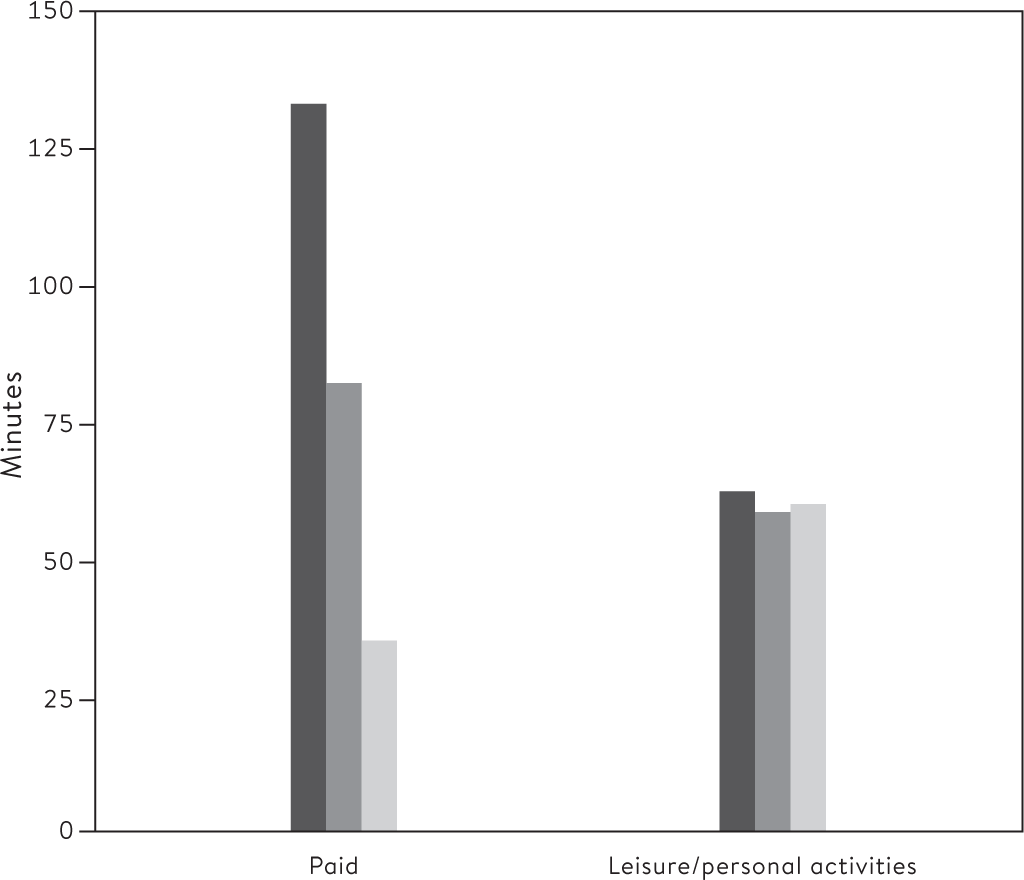
Figure 11.6 Time using devices during paid work and leisure/personal activities by social class, UK (2015)
Professional/manager
Intermediate
Routine/manual
Device use, time pressure and subjective wellbeing
Many of the arguments made about the way in which technology has impacted our lives contend that technology has made our lives more stressful and time-pressured than in the past. We know little, though, about how technology influences our experience of time and general wellbeing. Here we explore associations between adults’ use of technology, time pressure and subjective wellbeing. Specifically, we look at whether there are significant differences in time using digital devices between those who report always feeling rushed (as an indicator of time pressure), or stressed, or dissatisfied with life in general, and those who do not. Table 11.2 reports the average time men and women spend using devices, differentiating between those who report feeling rushed, stressed or dissatisfied with life, and those who do not.
The main finding here is that those who state they have relatively high degrees of time pressure, stress or dissatisfaction with life do not spend significantly more (or less) time using devices than those who do not. While men who report dissatisfaction with life spend on average 20 minutes more using a device, and equivalent women report close to 30 minutes more, these differences are not statistically significant.16 Further analysis (not shown) considered links between these factors and different levels of time using devices, and likewise found no significant association. For example, those who reported 5 hours or more using a device on the diary day were not more likely to report being rushed, stressed or dissatisfied with life overall than those who did not report using a digital device at all during the day. These findings resonate with the conclusions of Chapter 13, where the implications of this – perhaps surprising – result are discussed further.
Table 11.2
Time pressure, subjective wellbeing and average time (hrs:mins) using a device: men and women, UK (2015)
| Men | Women | All | ||||
|---|---|---|---|---|---|---|
| No | Yes | No | Yes | No | Yes | |
| Always or often rushed | 3:48 | 3:49 | 2:50 | 3:03 | 3:18 | 3:20 |
| Always or often stressed | 3:47 | 4:01 | 2:50 | 3:12 | 3:17 | 3:30 |
| Dissatisfied with life in general | 3:53 | 4:14 | 2:48 | 3:15 | 3:18 | 3:42 |
Device use among older adults
Because of the association between paid work and technology, and the emphasis on new and emerging forms of social media, relatively little is known about the time spent on computing and the detail of how digital devices are incorporated into other activities among the elderly population. In this final part of the chapter we look at computer and device use among older adults (aged 60 and over) in 2015, and the different types of activities they engage in when using these digital devices.17 Throughout this section we distinguish between those who are retired and those who are not. Most non-retired adults are in their 60s, with close to 95 per cent of adults aged 70 and over being retired.
Table 11.3 reports the average time retired and non-retired men and women aged 60 and over spend using computers as their main activity, together with the average time spent using devices when engaging in other activities (‘other time using devices’). Irrespective of retirement status, men of this age group average 34 minutes using computers as their main activity, and women of this age group average around 20 minutes using computers. For both men and women, these averages are comparable with those for adults in their 50s reported in Table 11.1. Apparently, the gender difference in computer and digital device usage among adults extends to older adults aged 60 and over.
Table 11.3
Average time per day spent using computers as the main activity and using devices: retired and non-retired men and women aged 60 and over, UK (2015)
| Computers (main activity) |
Other time using devices |
|||
|---|---|---|---|---|
| Non-retired | Retired | Non-retired | Retired | |
| Men aged 60+ | 0:34 | 0:34 | 1:39 | 0:39 |
| Women aged 60+ | 0:18 | 0:20 | 1:35 | 0:33 |
Although retirement status is not linked to time spent using computers as a main activity, there are pronounced differences between retired and non-retired adults in the average time they spend using devices when engaging in other activities. Specifically, compared with retirees, non-retired men and women average one hour more using devices when engaging in other activities. We have already seen that, unlike time using computers as a main activity, there is a substantial decrease in time spent using devices while doing other main activities, of around one hour, for adults aged 60 and over compared with those in their 50s (see Table 11.1). In fact, looking across the entire population aged 8 and over, we can discern that time using devices reaches a high point among teenagers aged 16–18, and a minimum for retirees aged 60 and over (predominantly those in their 70s).
Interestingly, irrespective of retirement status, men do not spend more time using devices when doing other activities than women. Data from the Office for National Statistics (ONS) reports that older men are more likely to use the internet than older women.18 Our results confirm that, but only in relation to time spent using computers as a main activity. It is likely that other devices, particularly mobile devices, are being used to access the internet when engaging in other activities, and our results suggest that there are no gender differences here.
We have already seen that much device use occurs during paid work. Figure 11.7 shows that non-retired adults aged 60 and over report doing paid work for the majority of the time they spend using devices (at just under one hour), and this applies equally to men and women. Older adults report using a device while doing leisure and personal activities for around a half an hour on average. For retired adults aged 60 and over, this accounts for almost the whole of their total time using a device.
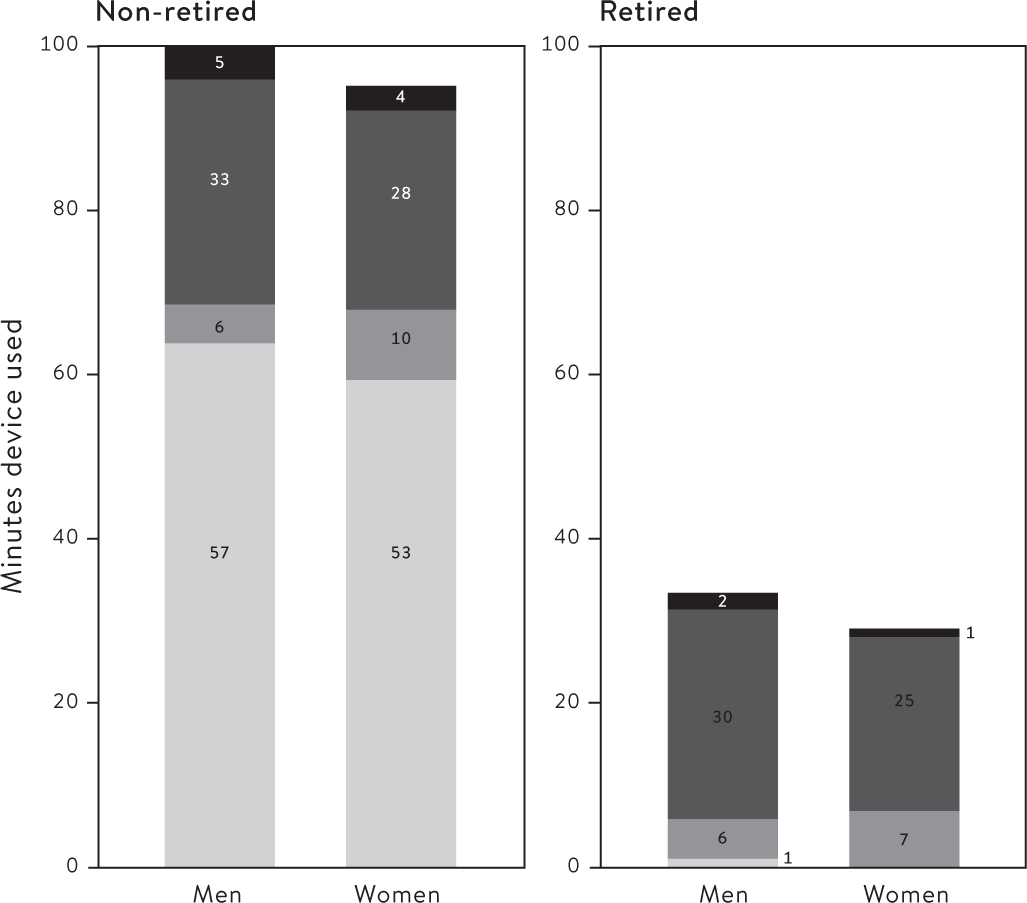
Figure 11.7
Major activities when using a device by gender and retirement status: adults aged 60 and over, UK (2015)
Travel
Leisure/personal
 Domestic
Paid
Men and women are similar in the activities they report when using a device, although both retired and non-retired men spend slightly more time than equivalent women using devices during leisure/personal activities. Non-retired women aged 60 and over spend slightly more time in domestic work while using a device. Among retired adults aged 60 and over the small gender difference in total time using a device is concentrated almost entirely in leisure time with a device.
Has technology taken over our lives?
There is little doubt that we are connected with each other through technology in ways that have no historical precedent. We are increasingly accomplishing more and more of the tasks of daily life using computers, smartphones and tablets. Yet the results presented in this chapter suggest that, while technology has infused into our daily lives to a considerable extent, it is far from saturating our time completely.
We find that a substantial amount of time using devices occurs during paid work, especially among those workers who use devices for a large part of the day. Moreover, device use at work was especially high among professional and managerial occupations. While not diminishing the importance of this, the use of technology at work for these occupations is hardly new. If the UK 2000 Time Use Survey had asked individuals to report times during the day when they were using a computer, regardless of whether using a computer was their main activity, it is reasonable to suppose that these same occupational groups would have reported substantial amounts of time using computers when at work. While it is likely that smartphones and tablets have increased the use of technology at work (though not necessarily for work) in jobs where the use of computer technology is long established, this increase is perhaps not as great as we might have thought.
Our results also highlight that gender differences in device use stem, to a great extent, from the strong link between device use and paid work. In short, women and men are much more similar in their use of devices outside of paid work than in it. In contrast, the strong age differences in time spent using digital devices were concentrated outside rather than in paid work, primarily in media activities. Beyond the confines of paid work, most other time using digital devices was combined with leisure and personal activities. This no doubt reflects substantial changes in the way we experience and engage in these activities. It is important, however, not to overstate the extent to which we combine the use of digital devices with leisure and personal activities. Even among those who reported using devices for much of the day, the use of devices never exceeded more than half of their total time in these activities. Overall, about one fifth of all time in these activities was combined with the use of a digital device. Within the broad group of leisure and personal activities, we found that device use was most typically combined with media activities such as watching TV, followed by time combining device use with eating and social activities. Unfortunately, we cannot tell exactly what people are using their devices for when engaging in these different leisure and personal activities, so we do not know whether the devices are being used in conjunction with the activity, or whether their use indicates that they are multi-tasking. Sometimes this becomes clear from the nature of the primary activity. For example, we can safely assume that we are not using devices for eating or travelling (though we can use them to facilitate both activities). In these cases, device use certainly indicates a secondary activity, and although we cannot tell exactly what this is, our results are nonetheless revealing in terms of giving us some much-needed perspective on the magnitude of the time spent in secondary device use.
For other activities the picture is less clear. When reporting doing media activities with a device, a person could be using the device for the activity (e.g. watching TV on a tablet), or could be using the device for some other activity while also watching TV (e.g. interacting with friends on social media with their smartphone). This ambiguity is interesting in the light of the overall decrease we found in time spent in media activities as the main activity, especially among younger adults. It could well be that there has been an increase in reporting media activities as secondary activities, facilitated by the capacities of digital devices. For example, watching TV on a tablet while travelling.19
Although it is widely thought that technology lies at the root of a supposed time-pressure epidemic, we found no evidence for this (see also Chapter 13). While our analysis here is descriptive, these results largely hold when controlling for a number of other factors associated with device use.20 In trying to understand this it is worth noting that the past decade or so has witnessed remarkable technological change and we, as a society, have been on something of a steep learning curve. It may be that as we become more comfortable, and competent, in using new technology, and mobile devices in particular, they become less tied to feelings of time pressure. It could also be the case, however, that there are aspects of the use of digital devices that are linked to time pressure, which we have not succeeded in capturing in time-use diaries. Mobile devices enable instant checking and responding to notifications and communications, which might take only moments. While not registering in a time diary, these moments could well be tied to feelings of time pressure and stress. This notwithstanding, our results show no direct link between overall time using digital devices, time pressure and subjective wellbeing.
Echoing previous research, we found that the reach of technology into daily life falls off dramatically for older adults, especially for those who have retired. Broadly, the way in which older adults incorporate technology into their daily activities was very similar to the wider population, but the amount of time that older adults spend using digital devices is considerably lower. These results underscore concerns that older adults may be excluded from some of the benefits of these devices, and of technology more generally. The pattern of increasing time using technology in the teenage years shown in the previous chapter lessens through the twenties, and our time using devices appears to continue to decline as we get older. As we move forward, however, it is likely that the crest of this technological wave will push on for longer across an individual’s lifespan. Today’s young people will enter retirement with perspectives and technological competencies very different from contemporary retirees. Of course, they themselves may not keep up with seemingly relentless technological change as they age.