
GRAPH THEORY
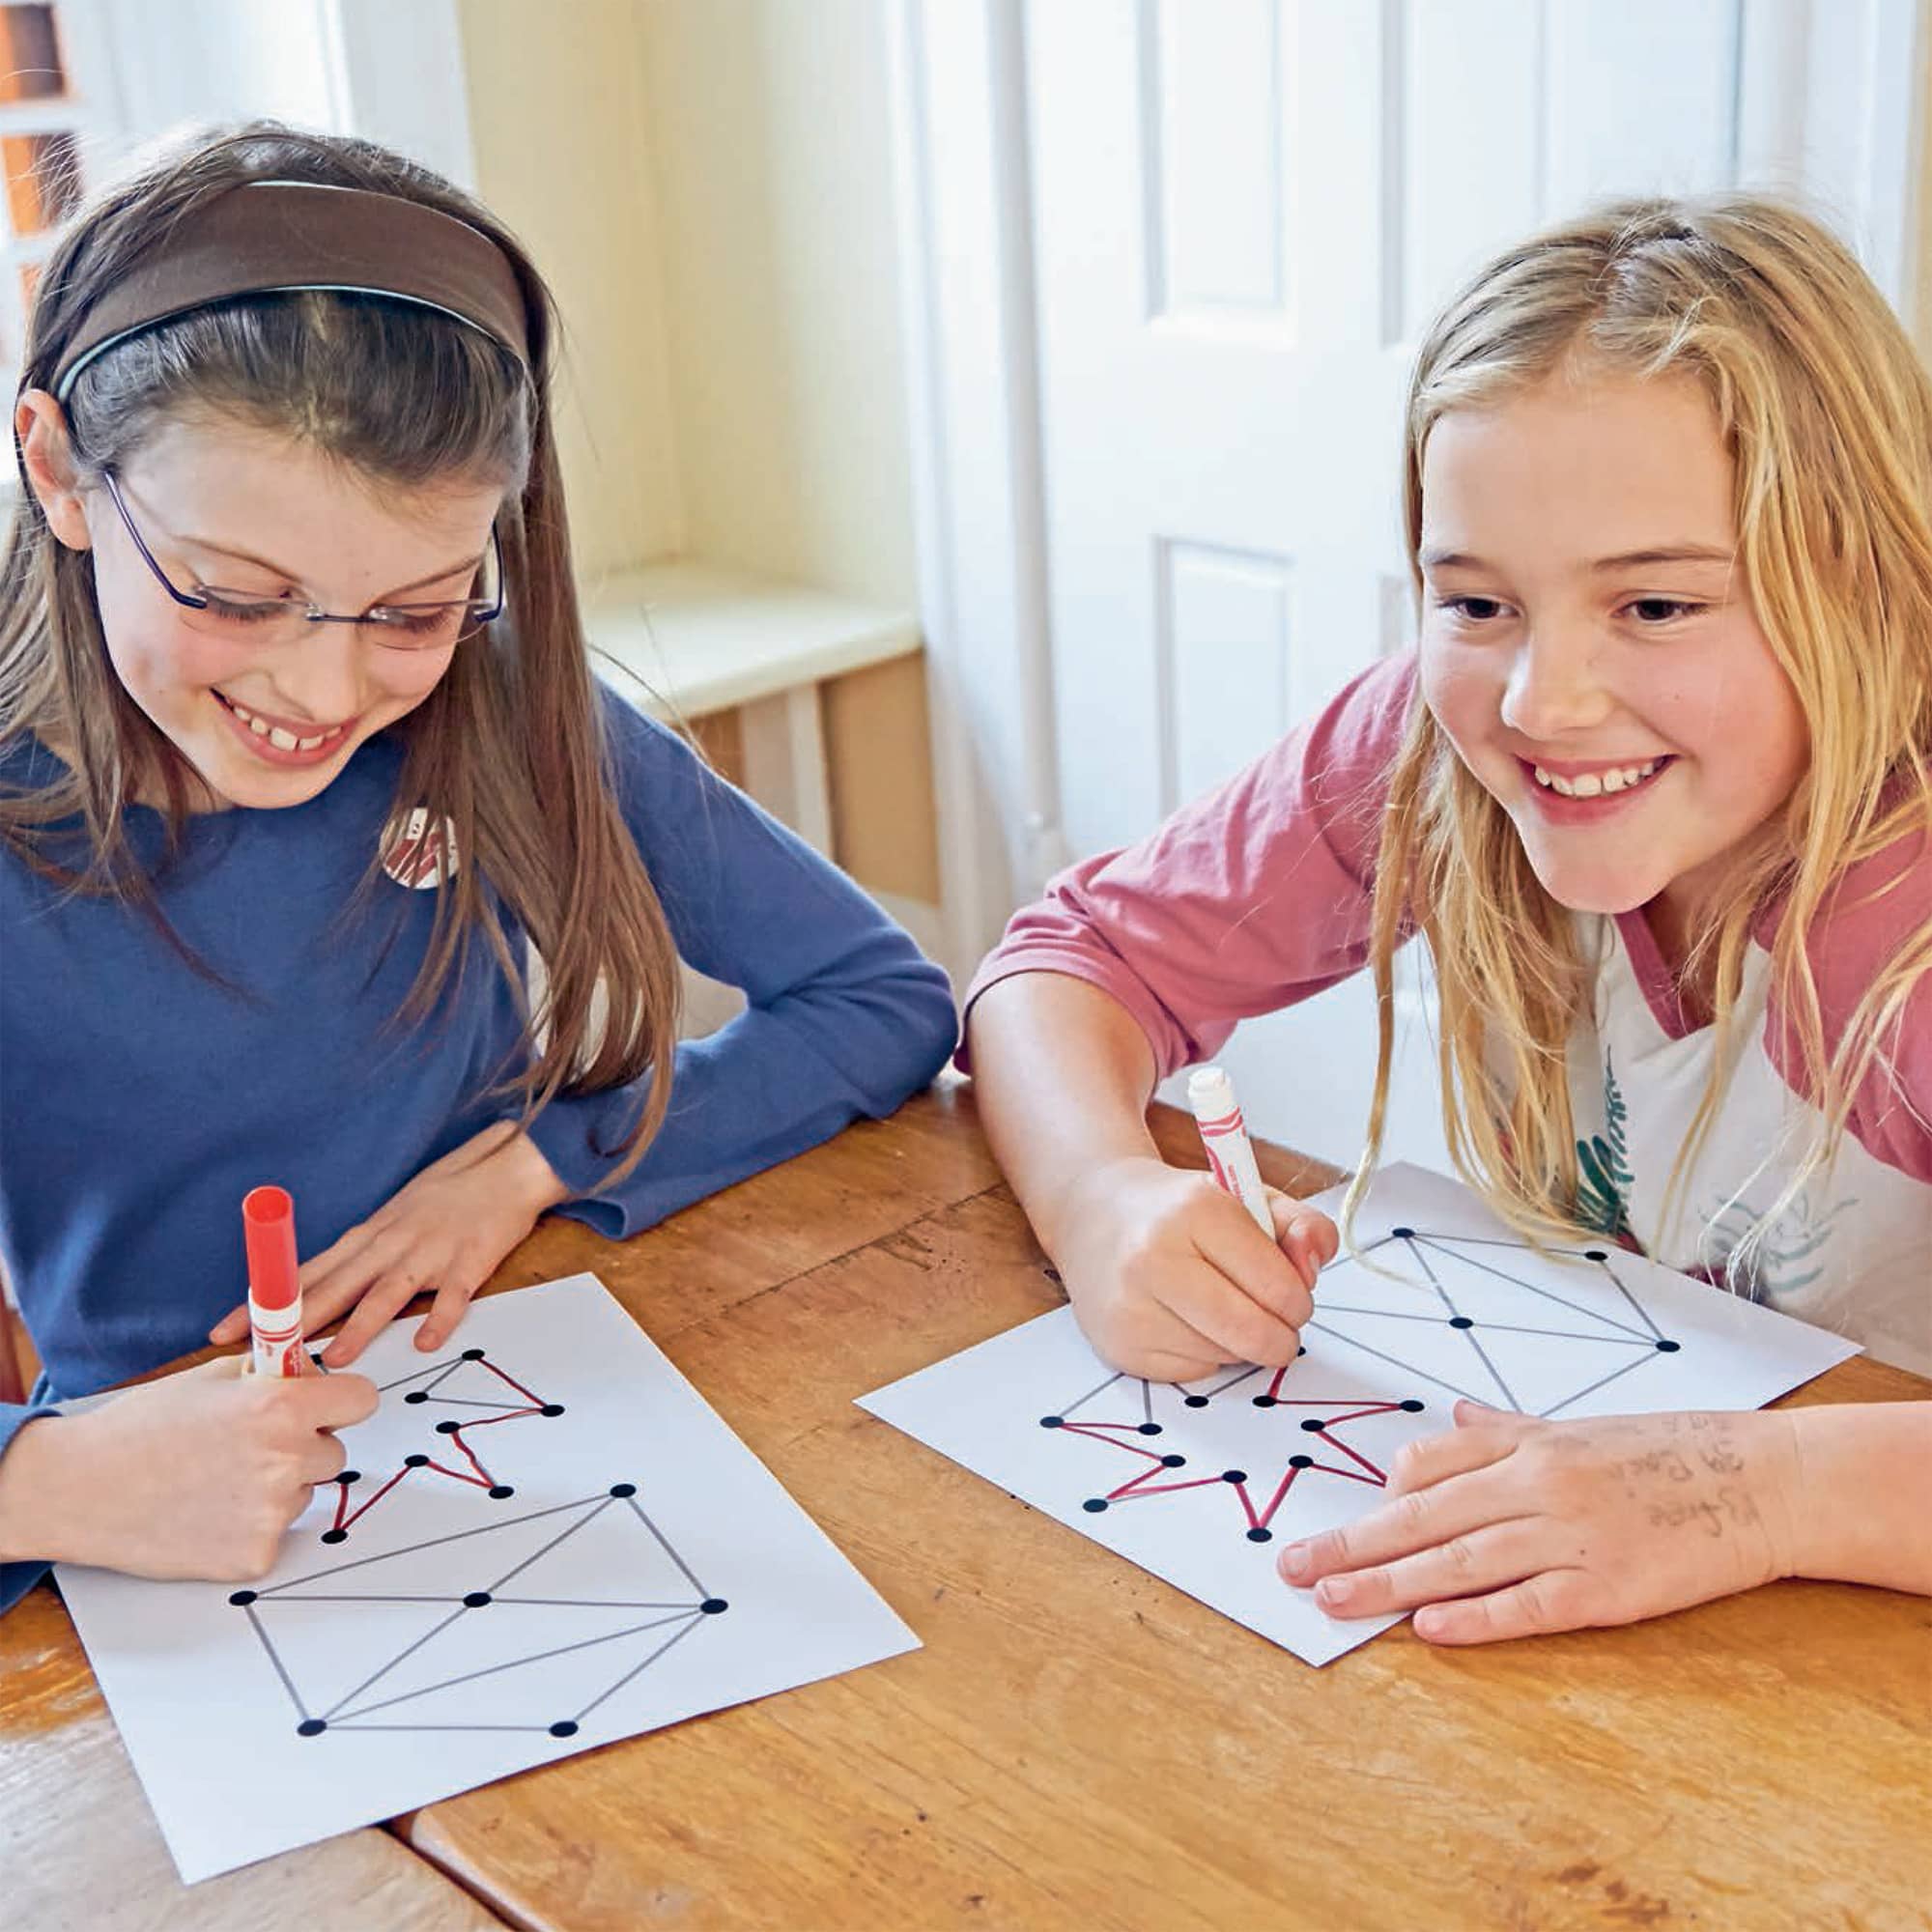
Graph Theory is the study of how things are interconnected. This includes how computers are connected to each other in your house and on the Internet, how to efficiently place power plants to provide electricity in cities, the best locations to put fast food restaurants so that no one is too far from their favorite junk food, how to plan airplane flight paths, and more.
In 1736, mathematician Leonhard Euler solved the Bridges of Königsberg problem (see below), inventing Graph Theory in the process.
Think About It
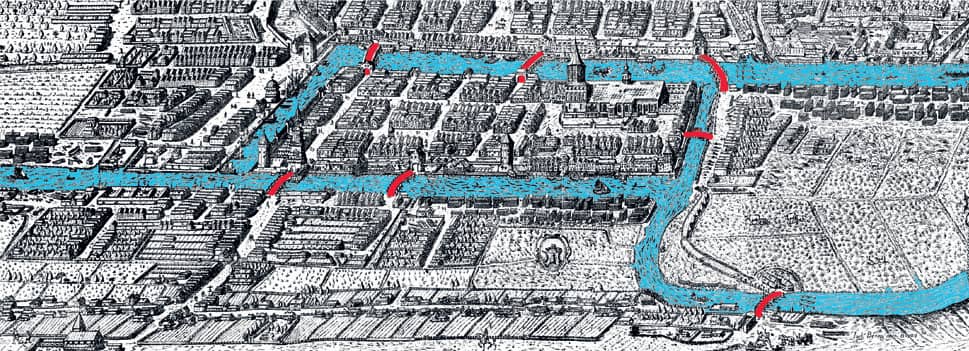
One of the most famous Graph Theory problems involves the city of Königsberg. Spanning both sides of a river, it has two islands, which are connected to the rest of the city by seven bridges. Citizens challenged each other to find a path that started and ended in the same place and crossed each of the seven bridges exactly once. Can you find such a path?
LAB 33
EULERIAN CIRCUITS
Learn how to trace shapes without lifting your pencil. To trace every line of the figure eight (left) without lifting your pencil, trace in the direction of the arrows as shown on the bottom.
Materials
 Pencil
 Paper
Paper
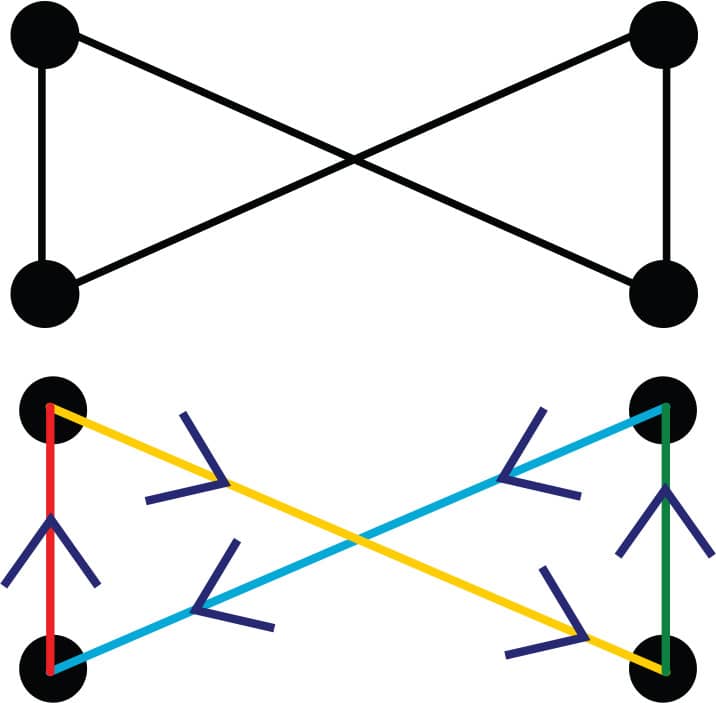
You can avoid lifting your pencil by following the direction of the arrows when tracing the figure eight.
TRACING EULERIAN CIRCUITS

The paths we draw in this lab travel over every edge of the entire graph, start and end on the same vertex, and don’t retrace any edges. Mathematicians call these paths Eulerian circuits.
Important: Lines are allowed to cross but you can’t trace over the same line twice.
1. Can you trace a five-point star without lifting your pencil or going over the same line twice (fig. 1)?
2. It’s possible to trace all the shapes on the next page starting and ending at the same vertex without lifting your pencil or going over the same line twice (figs. 2–6). Can you find the paths?
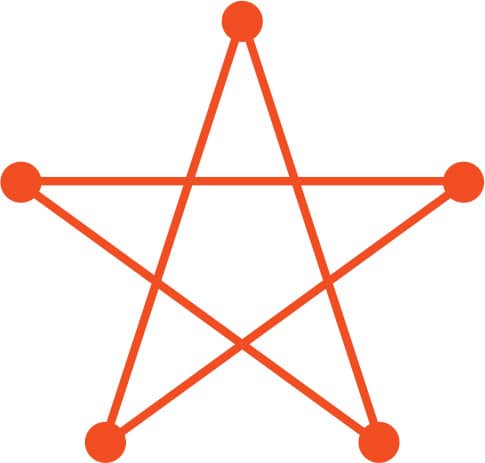
FIG. 1: A five-point star.
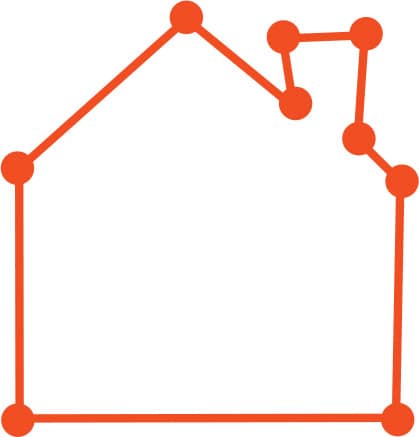
FIG. 2: A simple house shape.
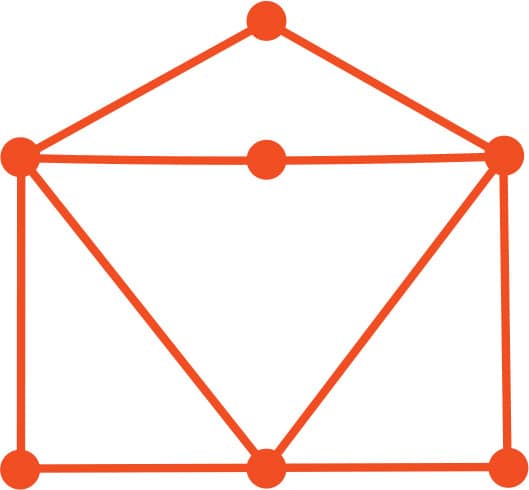
FIG. 3: An open envelope.
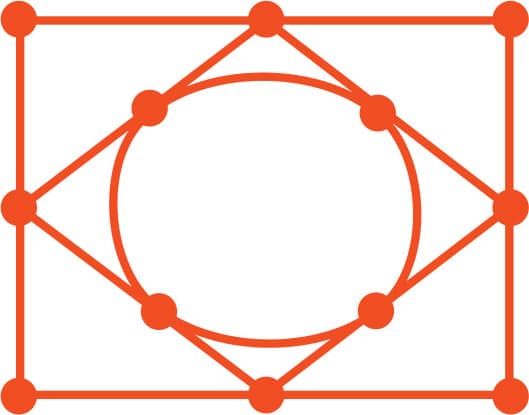
FIG. 4: Nested shapes.

FIG. 5: A seven-point star.
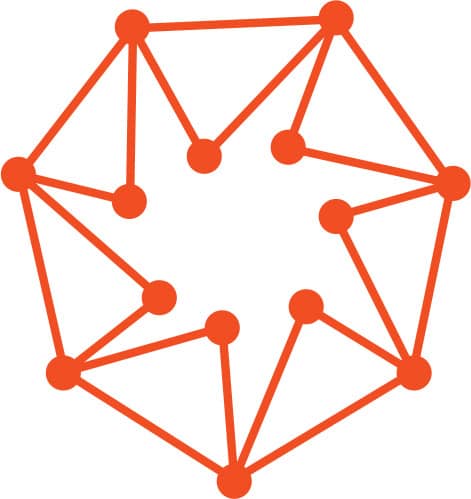
FIG. 6: A seven-point star inside out.
LAB 34
SECRETS OF EULERIAN CIRCUITS REVEALED
What will you discover about the mathematically mysterious Eulerian circuits?
Materials
 Pencil
 Paper
Paper
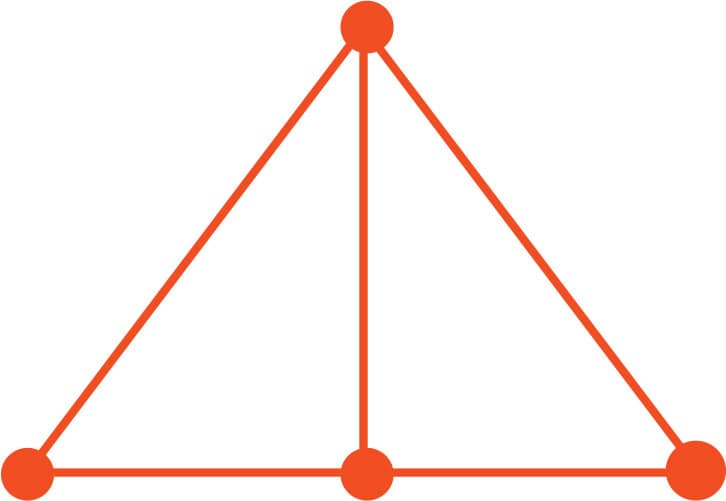
FIG. 1: A triangle graph with no Eulerian circuit.
A SECRET SHORTCUT

In Lab 33, we discovered three rules for creating an Eulerian circuit:
1. Start and end from the same vertex.
2. Don’t lift your pencil.
3. Don’t retrace any edges.
In this lab, we’ll learn a shortcut for figuring out if a graph has an Eulerian circuit.
1. You cannot follow the rules for creating an Eulerian circuit to draw this shape (fig. 1). Try it and you’ll see it’s impossible.
2. What about figs. 2–6? Some of them have Eulerian circuits and others do not. Circle the ones that have an Eulerian circuit and put an “X” next to the ones that don’t.
3. As we discovered, some graphs have no Eulerian circuit. Can you figure out a rule that will tell you if a shape has an Eulerian circuit?

FIG. 2: A modified seven-point star.
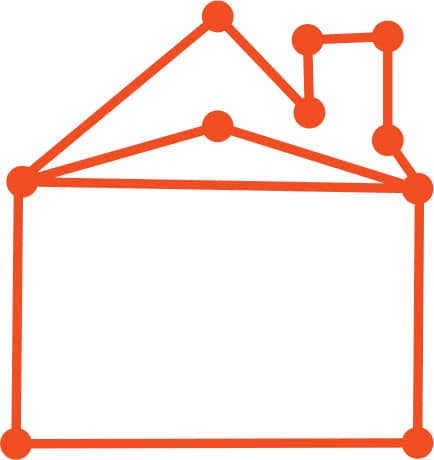
FIG. 3: A fancy house.
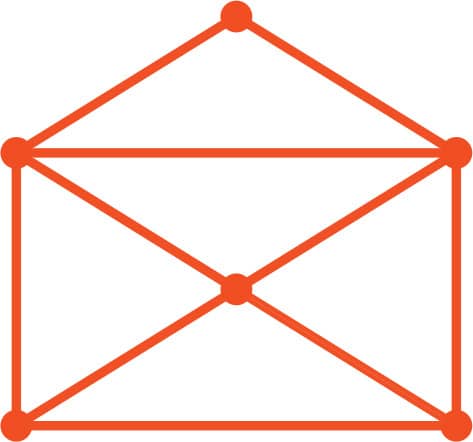
FIG. 4: An envelope.
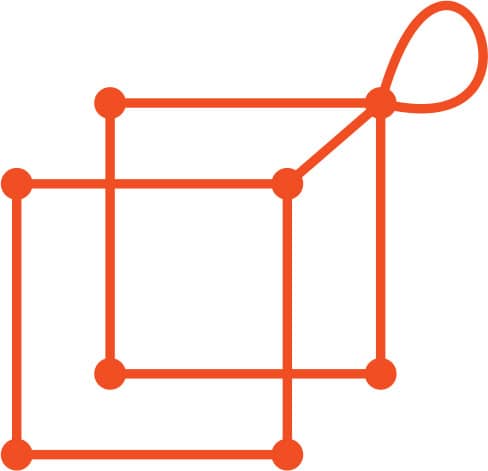
FIG. 5: A cube-like shape.
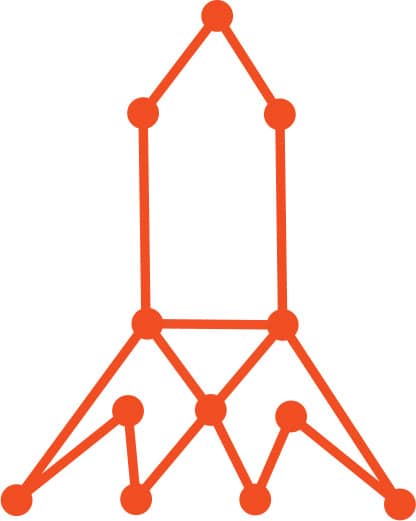
FIG. 6: A rocket.
LAB 35
BRIDGES OF KÖNIGSBERG
Now that you know so much about Graph Theory, let’s solve the Bridges of Königsberg problem from the Think About It.
Materials
 Map of Königsberg (see below)
 Pencil
GOING FROM MAP TO GRAPH
1. Turn the map below into a graph, as shown in fig. 1. Each area you can visit becomes a vertex of a graph. Each bridge between areas becomes an edge connecting those vertices.
2. The Bridges of Königsberg challenge is the same as finding an Eulerian circuit on the graph we just drew. Can you find an Eulerian circuit on this graph? If you get stuck, go on to the next step.
3. Hmm, maybe there isn’t an Eulerian circuit. Let’s label every vertex with the number of edges it connects (fig. 2).
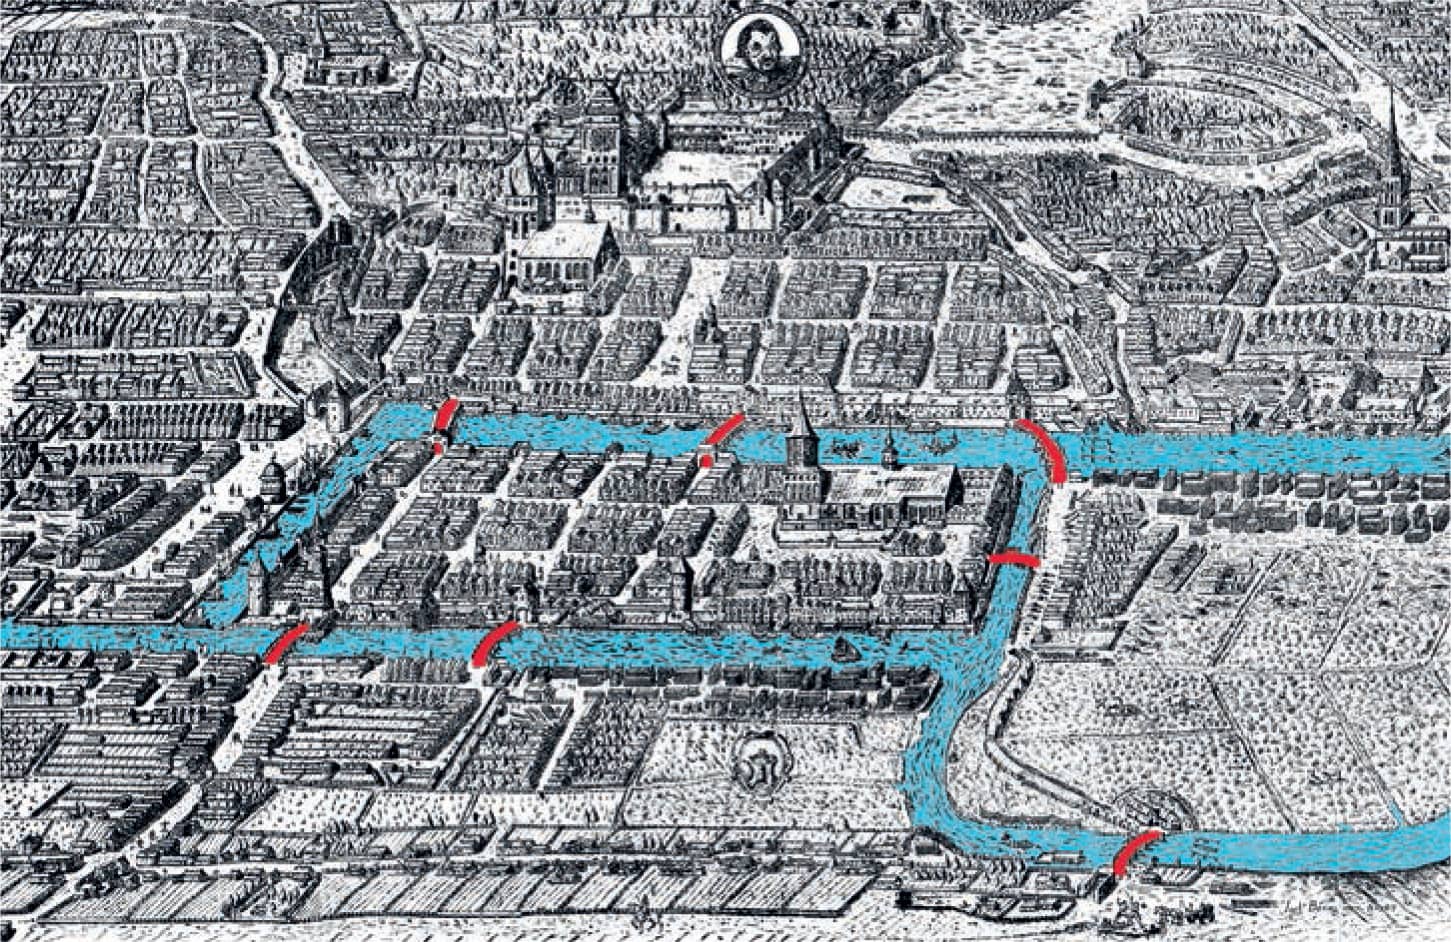
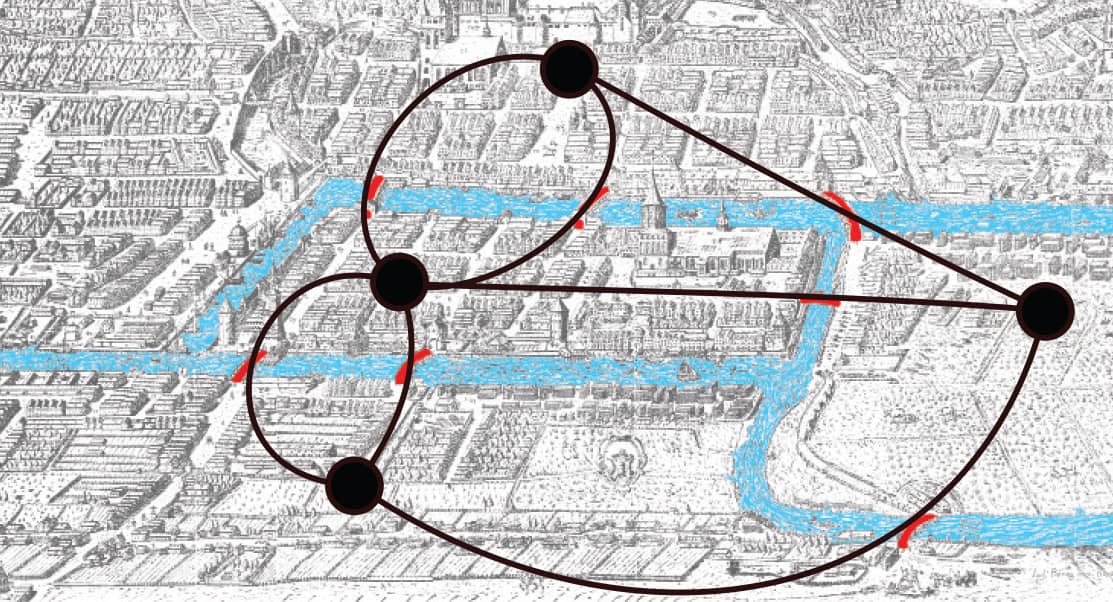
FIG. 1: Turn the map into a graph.
Now we know we weren’t imagining it—there’s no Eulerian circuit Remember, in Lab 34, we learned that if any vertex connects an odd number of edges, the graph does not have an Eulerian circuit. Here, all of the vertices connect an odd number of edges. Congratulations, you just did a proof by contradiction!
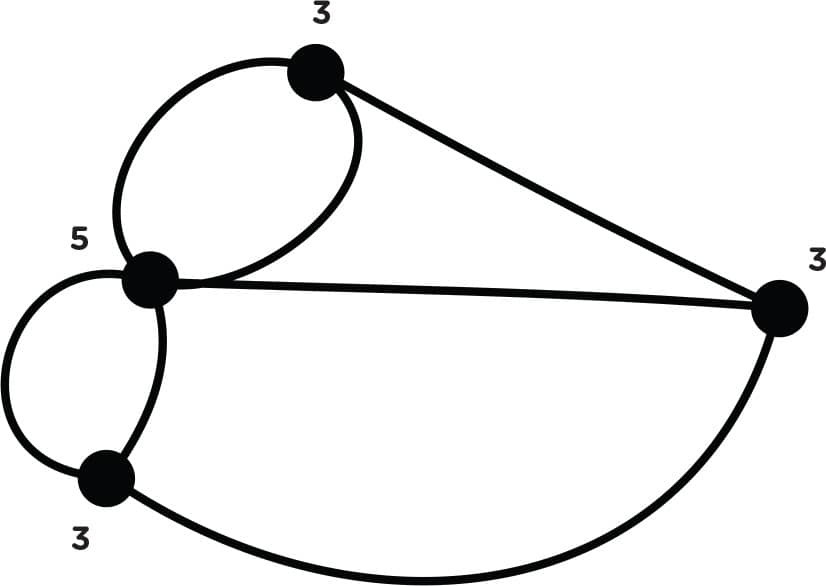
FIG. 2: Label every vertex with the number of edges it connects.
LAB 36
THE EULER CHARACTERISTIC
Learn an interesting relationship between vertices, edges, and regions.
Materials
 Pencil
 Paper
Paper
COUNTING VERTICES, REGIONS, AND EDGES

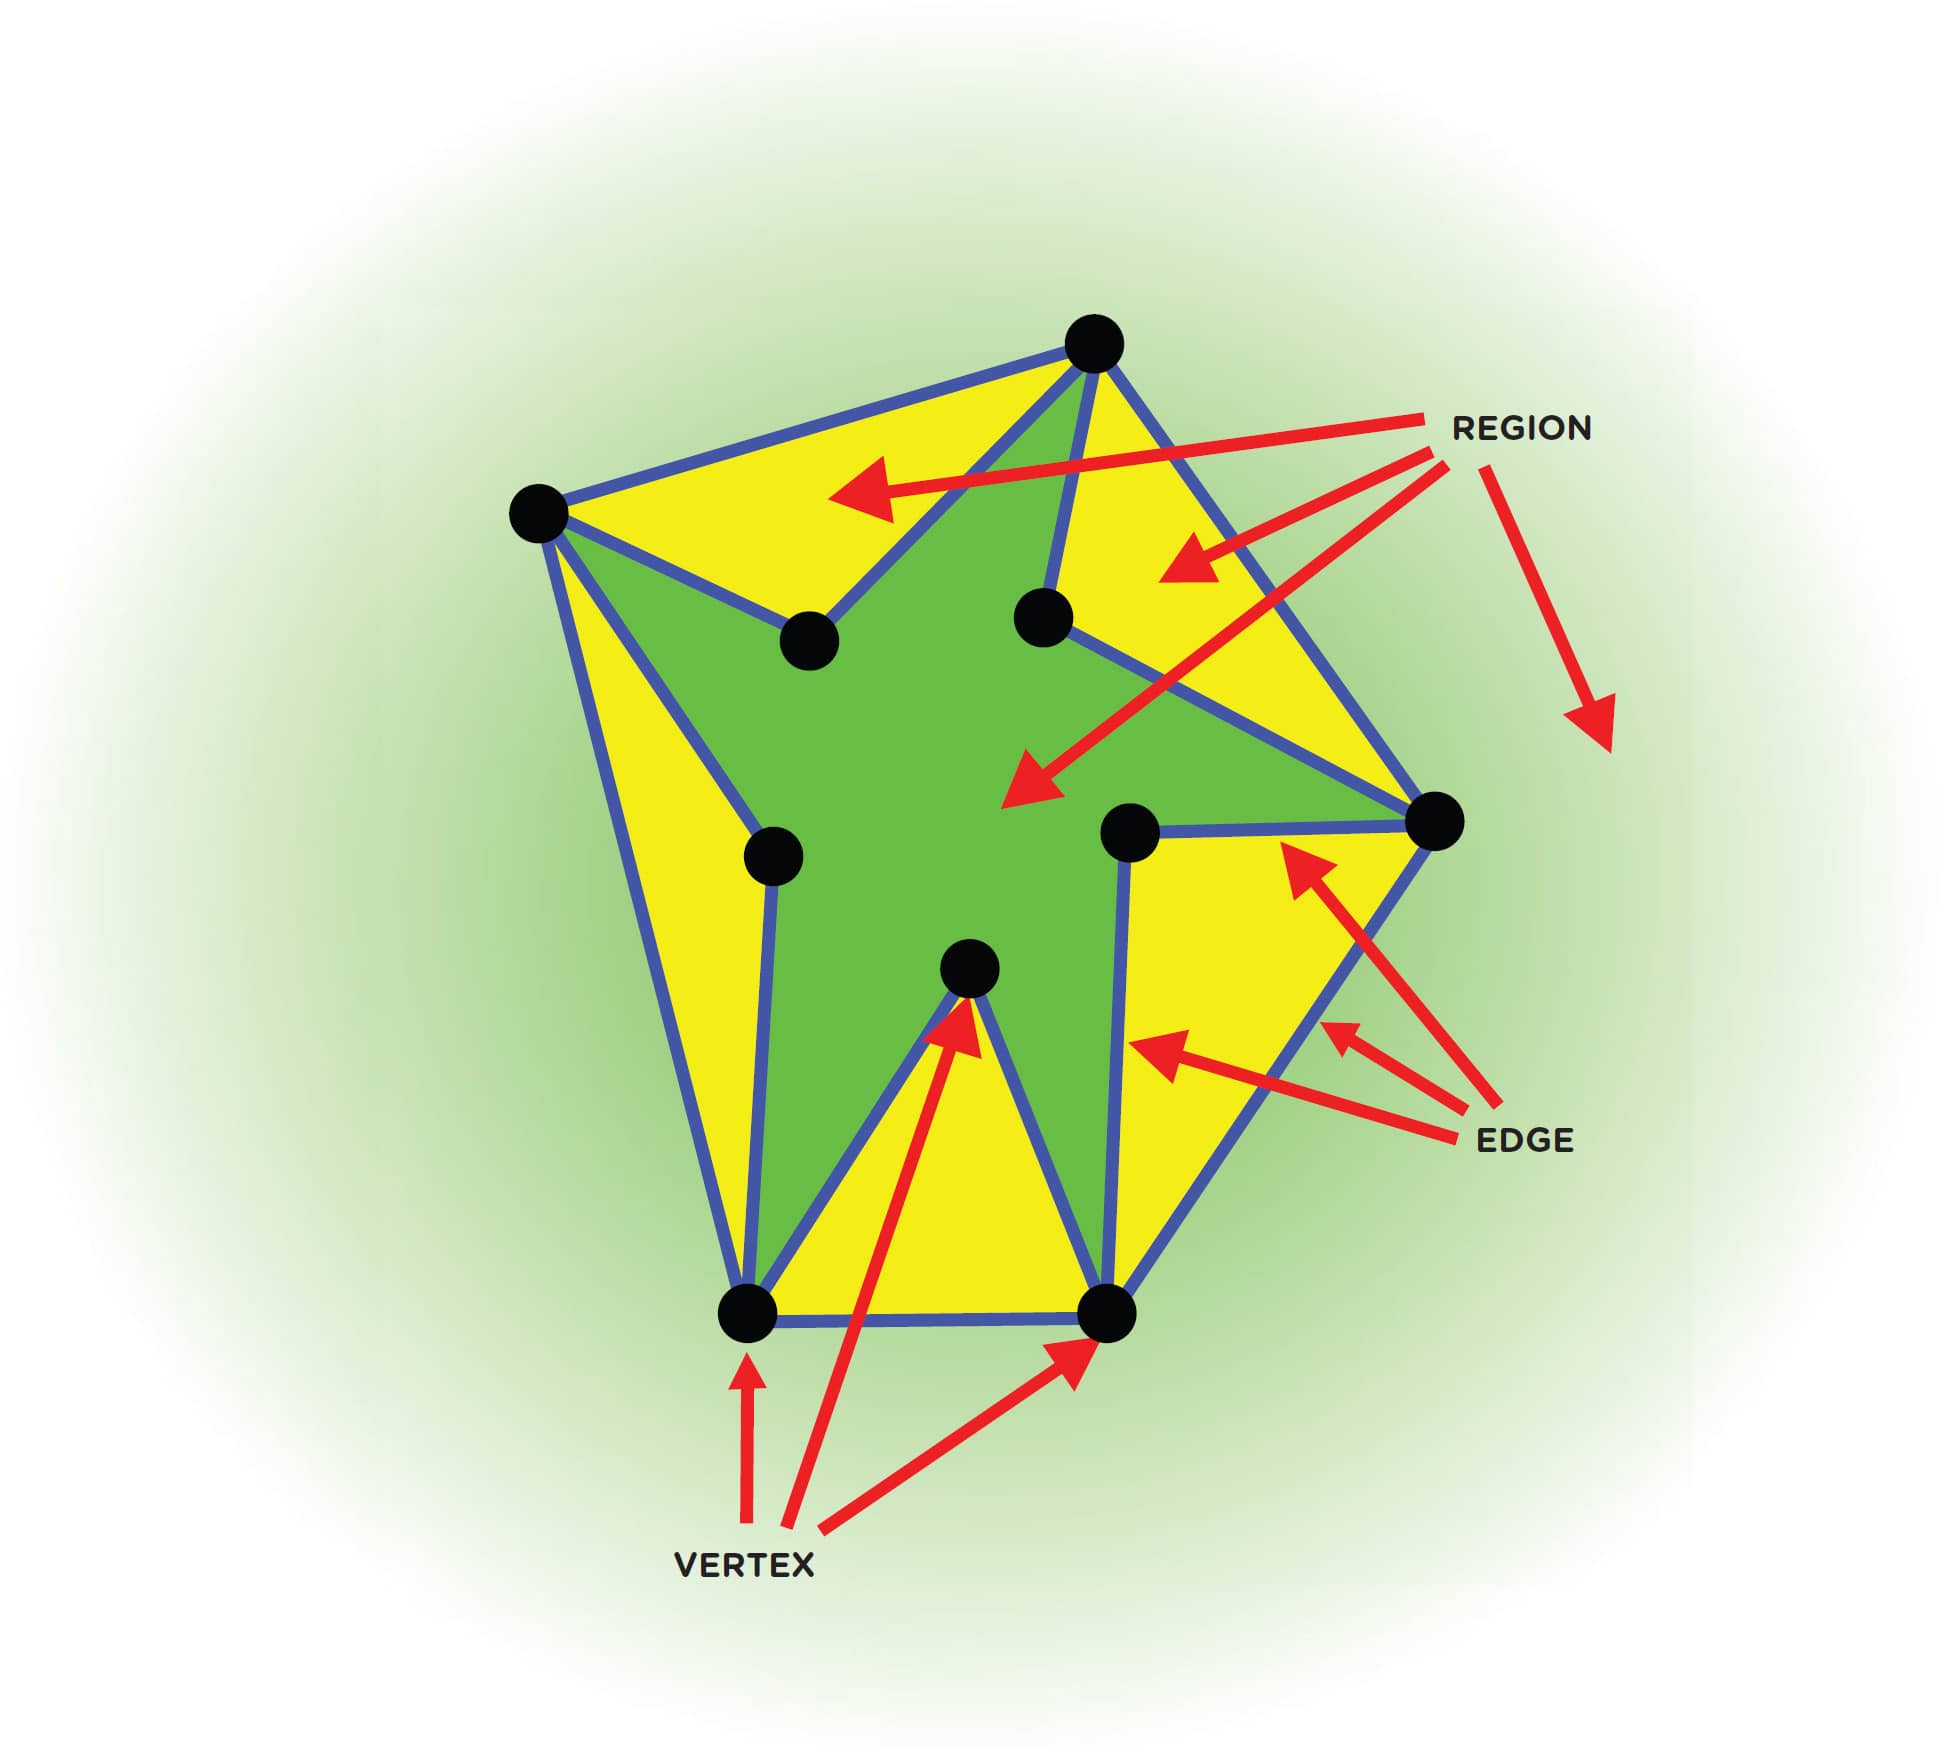
Earlier, we said that a graph is a set of dots, called vertices, connected by lines, called edges. The paper you draw the graph on is divided into regions, each surrounded by edges. The space outside the graph also counts as a region. In the picture below, there are 10 vertices (colored black), 7 regions (colored yellow or green), and 15 edges (colored blue).
Leonhard Euler noticed something interesting about graphs when he counted
(number of vertices) + (number of regions) − (number of edges)
Let’s count the number of vertices, edges, and regions in some graphs and see if we can figure out what he noticed.
1. Figs. 1–3 show some examples where we’ve counted the vertices, edges, and regions of some graphs. You count them too and make sure your counts match ours! Remember to count the “outside” region.
Once we’ve counted V, R, and E, we’ll add the number of vertices and regions together, subtract the number of edges, and see what we get!
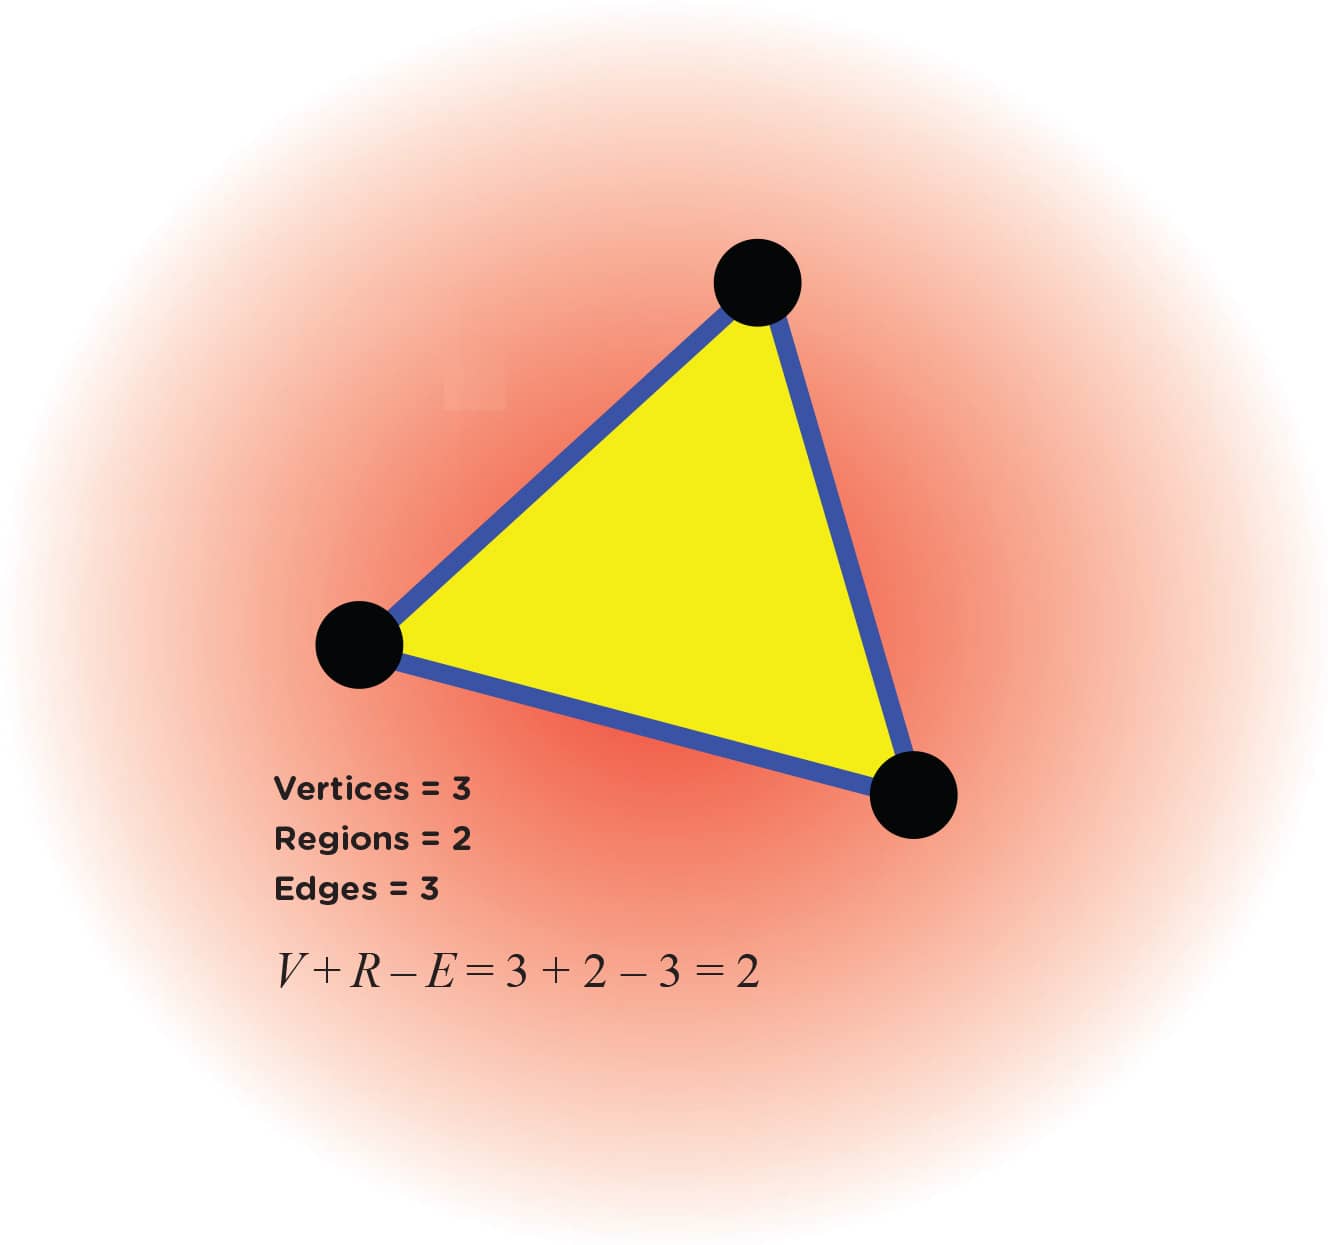
FIG. 1: Count the vertices, edges, and regions.
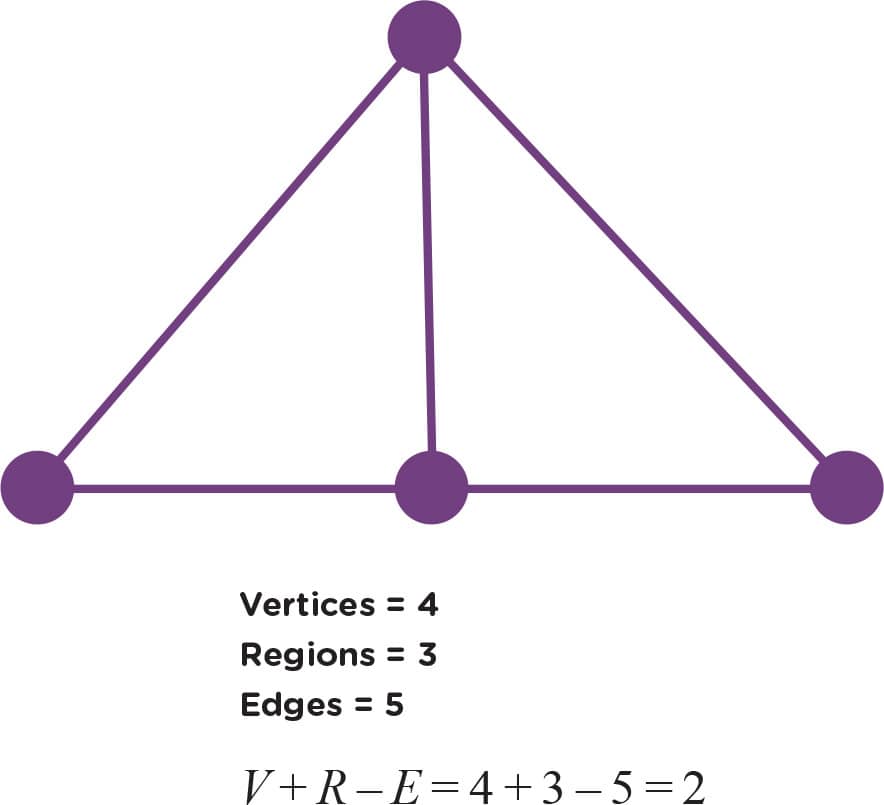
FIG. 2: Remember to count the “outside” region.
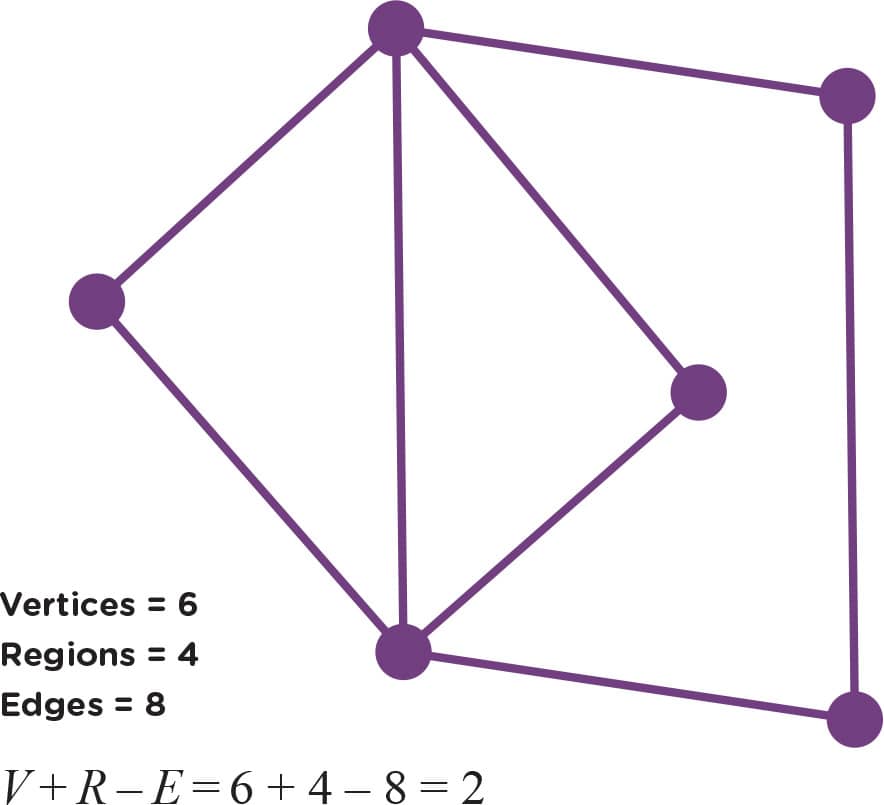
FIG. 3: Do your counts match ours?
2. Now you try counting yourself (figs. 4–10). Don’t forget to count the “outside” region. How many vertices, edges, and regions do the following graphs have? Also calculate V + R − E for each graph. Hint: The graphs in figs. 9 and 10 only have one region: the “outside” region.
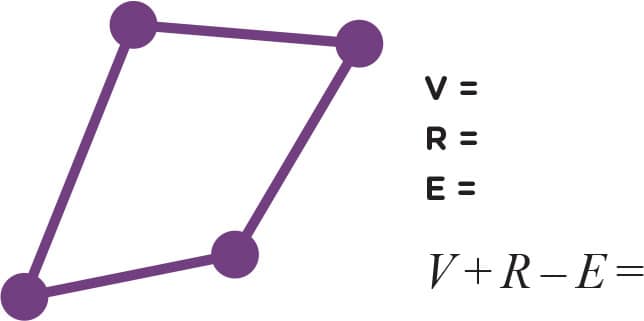
FIG. 4
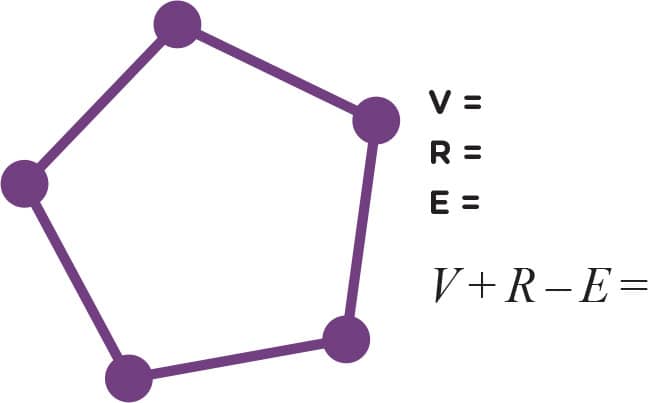
FIG. 5
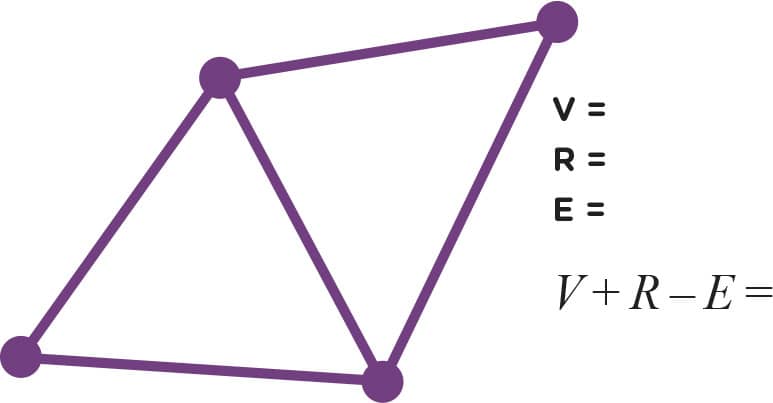
FIG. 6
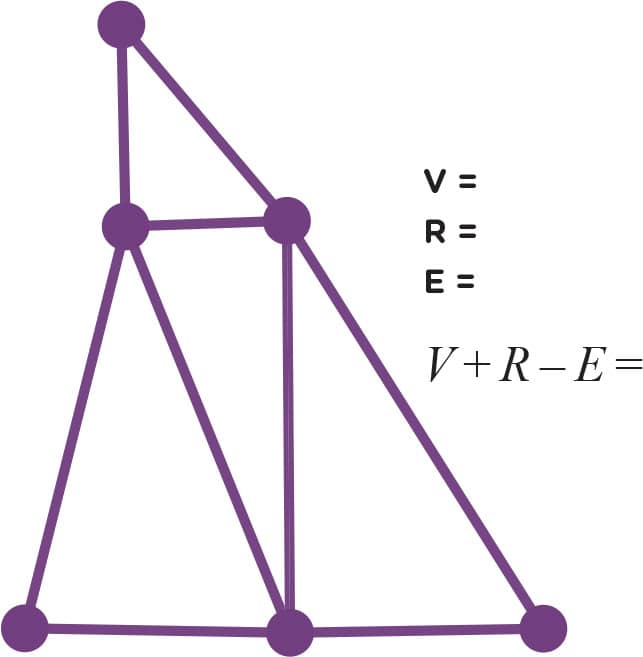
FIG. 7
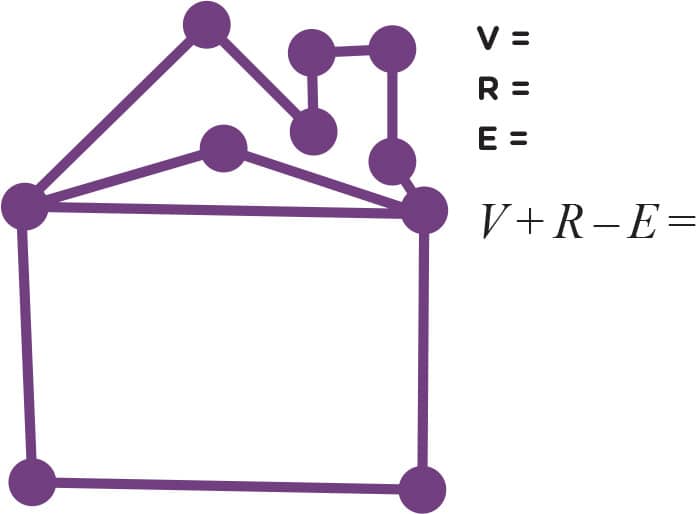
FIG. 8
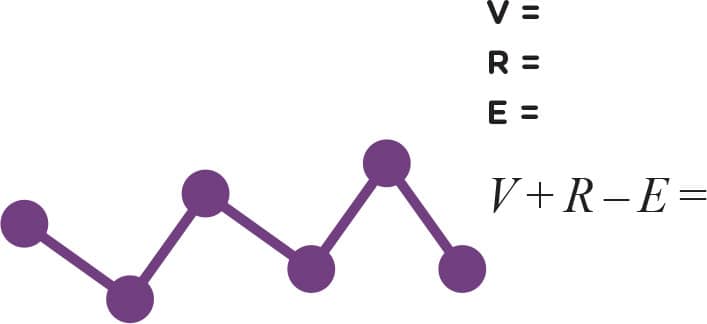
FIG. 9
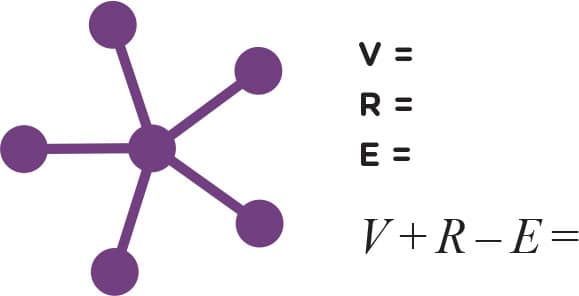
FIG. 10
SOLUTION: In every example, V + R − E = 2. That’s pretty amazing. Do you think it’s always true? (You might want to think about this for a bit before you continue on.)
LAB 37
A PROOF ABOUT THE EULER CHARACTERISTIC
In a PROOF BY INDUCTION, you first show that the simplest case (called the BASE CASE) is true. Next you prove the INDUCTION STEP, showing that a general case being true means that the following case is also true. Now you have a recipe showing how to get from any size to any other size (repeating the induction step as many times as needed, even going on forever), so you know it’s always true. (This is college-level math, so don’t worry if you find it a bit confusing.) Let’s show that the Euler Characteristic is 2 for all planar, connected graphs!
Materials
 Pencil
 Paper
Paper
CHALLENGE!: PROOF BY INDUCTION

1. Base case: Calculate V + R – E in the case of a single vertex and no edges (fig. 1). It’s 2, right?
2. Calculate V + R – E when we add a new edge and a new vertex (fig. 2). It’s still 2. We added one new vertex and one new edge, so they canceled each other out.
3. Calculate V + R – E before and after we add a new edge but not a new vertex (figs. 3–4). It’s still 2, because when we add a new edge but no new vertex, we end up adding a new region, which cancels out the new edge. Try adding one edge to some of the graphs from earlier in this chapter. Do you see how we always add one region when we add one edge? Thus, V + R – E stays the same.
4. We can build any planar connected graph by adding vertices and/or edges as in the steps above. Try adding edges and/or vertices to the graphs in figs. 5–7. Calculate V + R – E before and after.
5. Add some vertices and/or edges to a few graphs you make up yourself. Calculate V + R – E before and after. You can try this on any planar connected graph, not just the simple ones from steps 1 and 2.
If you add just an edge, that ends up adding a new region. If you add a new vertex, you have to add the edge to connect it to the existing graph. Thus, at every step of building a planar connected graph, V + R – E = 2. Amazing!
You have just done a mathematical proof by induction. Congratulations!

FIG. 1: Calculate V + R – E in the case of a single vertex and no edges.

FIG. 2: Calculate V + R – E when we add a new edge and a new vertex.
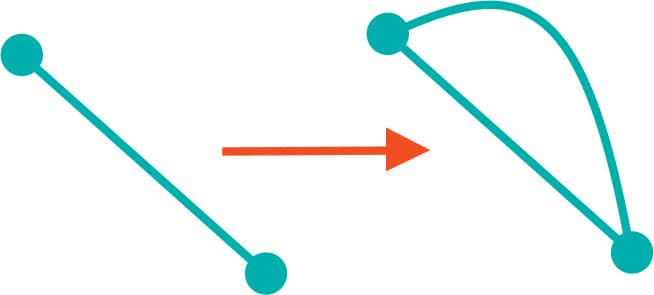
FIG. 3: Calculate V + R – E before and after we add a new edge.

FIG. 4: Calculate V + R – E before and after we add a new edge.
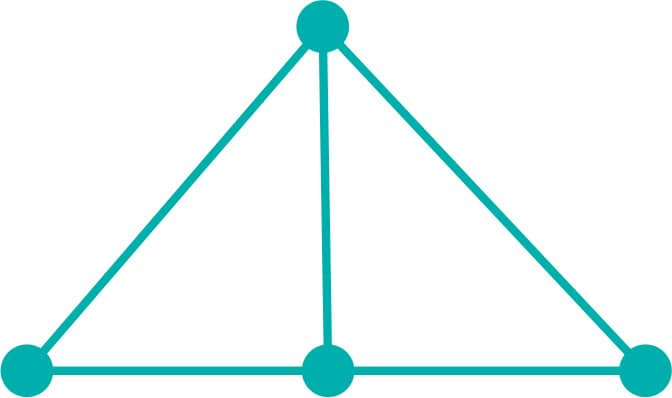
FIG. 5: Calculate V + R – E before and after adding vertices and edges.
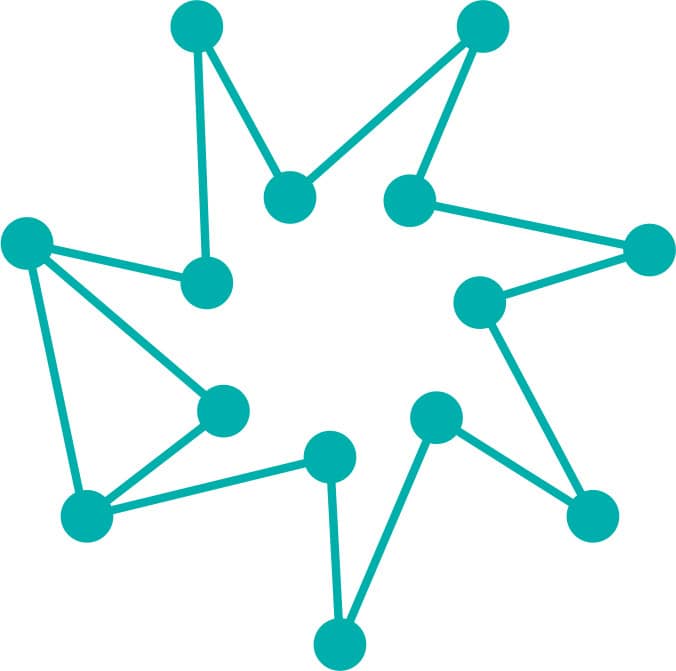
FIG. 6: Calculate V + R – E before and after adding vertices and edges.
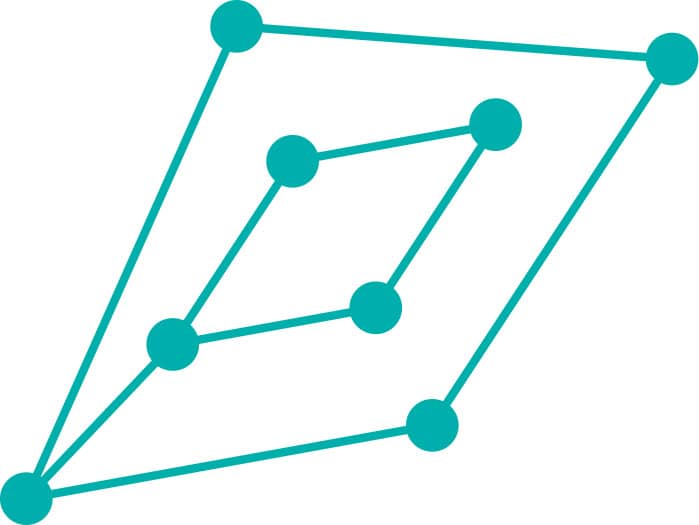
FIG. 7: Calculate V + R – E before and after adding vertices and edges.