6
ANATOMY
From Imaging to Printing Organs
The exquisite depictions of anatomy and function generated by
modern imaging technologies have blinded many physicians to the
limitations and potential harms of radiologic diagnosis.
—Bruce Hillman and Jeff Goldsmith, 2010
1THE DATE WAS December 27, 2009. That evening, I had just gotten my hands on the first Vscan—a pocket-sized digital imaging device that provides high-resolution ultrasound imaging—in the United States. Until this point, the only way to get an ultrasound of the heart, an echocardiogram, was to send patients to a lab, where they’d be studied with a $300,000 machine the size of a refrigerator. This was an exciting and liberating event. Naturally my first step was to image my own heart.
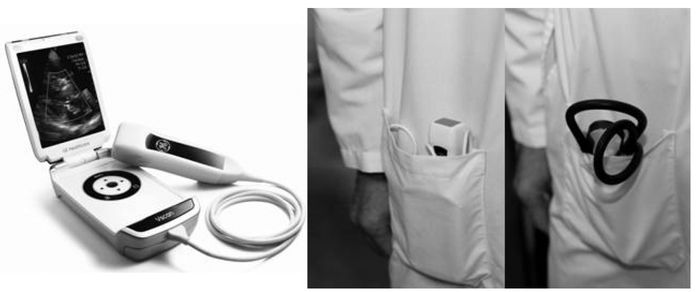
To get the images is quite simple. A transducer, which has the shape and size of an electric toothbrush with no brush, is placed on the chest after some gel is put on its tip to help transmit the ultrasonic energy (see
Figure 6.1). The transducer is moved around the chest to find a good “window” to acquire digital movie loops of the heart in multiple standard views, each revealing something different about the heart’s structure and function. Combined, the movies give us information about the heart muscle function, the thickness of the heart’s walls, the status of the four heart valves, the size of the four chambers, how the segment of the aorta near the heart looks, and whether there is any fluid in the pericardium (the sac around the heart).
Placing the transducer on my chest, I quickly got a crystal clear image of the main pumping chamber—the left ventricle—and the mitral valve. I was not surprised that my heart muscle function looked fine. But then I put the color flow on, which uses ultrasound to track the blood flow, and it showed that my mitral valve was leaking badly—so badly, in fact, that I had just become a potential candidate for open-heart surgery to repair the valve! I finished the rest of the ultrasound exam of my heart, and everything else was OK, with the minor exception of a moderate leak from my aortic valve. (At least that one wasn’t severe enough to warrant surgery.) The whole scan had taken less than five minutes, and even most of that was taken up by the shock of seeing, and repeatedly examining, my leaky mitral valve.
It just didn’t make sense. I had been feeling well and exercising vigorously almost every day. I knew, however, it’s possible to have a slow, insidious, progressive leak without showing any symptoms. So I got out my stethoscope to see what I could hear. I listened to my heart in various positions, and I could hear some leak from the valve, but it sure didn’t seem like much—maybe 1+, on the cardiologists’ scale of 1 to 4, but not the 3+ the Vscan showed. It was peculiar, but the Vscan was tracking the blood flow, and I was looking right at it—lots of leak and enough to be requiring a consultation with a heart surgeon.
FIGURE 6.1: Picture of the pocket-sized mobile echocardiogram unit known as the Vscan and comparison of a stethoscope and the Vscan in the pocket of my white coat.
It was too late in the day to go to an echocardiography lab for the forty-five-minute, gold-standard examination. I set up an appointment for the next day, went home, and had a bad night. I already knew, genomically, that I was at a high risk of a heart attack, and this discovery left me with a lot to think about: I thought about who would do the surgery (I hoped for a repair of the valve rather than a replacement); how I would have to take off a few weeks or a month from work to get this fixed; all the patients I had looked after with leaky mitral valves, especially in men, who tend to have the most severe cases, and even in a few cardiologists I had trained. I hoped I would tolerate the operation well.
My only hope was that maybe this was a mistake. After almost twenty-four hours of restlessness and high anxiety, my formal echo showed only 1+ mitral valve leak. I escaped the heart surgery. I then informed GE, the manufacturer of the Vscan, about what had happened, and after they reviewed the problem, they found there was a bug in the color-flow software. Once it was reloaded, the software showed only a minimal leak. It was a great relief and the second time I’d learned not to be the first person to try out new medical tests—not to mention another illustration of the potential hazards of treating a scan rather than the patient.
I had gotten the Vscan to demonstrate it at the January 2010 Consumer Electronics Show in Las Vegas. This is one of the largest trade shows in the country, with over 100,000 attendees, and features almost every digital gadget known to humankind. My mission was to demonstrate some exciting advances in wireless and digital medicine. With the Vscan not even yet released in the United States (it became commercially available for $7,900 in February 2010), it was an ideal technology to present. There were several thousand people at the session during which Paul Jacobs, the CEO of Qualcomm, introduced me. Feeling a bit like Dr. Gizmodo, I brought out the Vscan from my old black medical bag—the one I had since medical school in the 1970s but hadn’t used in decades. And then the thing didn’t work. The demo demons were clearly at work. Paul called out to the audience, “Is there anyone from GE here?” Less than a minute later, even though it felt like fifteen, I got the Vscan to image my heart in front of the audience. The ultrasound of my heart muscle contracting, with my valves moving to and fro, was projected on the big screen. The audience started clapping, and I thought it was pretty funny—they had no idea what an echo image ought to look like, and I sure wasn’t going to tell them about my leaky valve.
Pocket-size, high-resolution ultrasound is one of the most significant advances in medical imaging in decades and is replacing the stethoscope, which has been around since 1816.
2 I now use it to examine every patient I see in clinic, and it usually preempts the need for another appointment for a formal echocardiogram study. It not only saves time but a lot of money (a combined technical and professional charge of about $1,500 per echo). With over twenty million echocardiograms done per year in the United States, there’s certainly room to improve efficiency.
3 A further benefit, and one I had not anticipated, is that I can discuss the image and finding with the patient in real time. When a patient goes for a formal study, the ultra-sonographer does not communicate the results to the patient. They are reviewed by an attending physician, who does so off-line, and the results are then typically conveyed the next day or many days later (if at all).
Modern imaging technologies can be divided into two general categories: those that rely on some sort of ionizing radiation (either a form of light, such as X-rays, or particles, such as electrons) to generate an image and those that do not. Ultrasound, as the name suggests, relies on sound, which makes it generally very safe.
4 It is not the most accurate imaging technology, as the acquisition and interpretation of the images is influenced by the person doing it, and it has its limits: ultrasound cannot be used to image through bone (e.g., for the brain) or through gas or extensive fat tissue. But it can be considered the go-to medical imaging technology for a wide range of applications.
The only other imaging technology that does not rely on ionized radiation is magnetic resonance imaging (MRI). MRI combines the use of radiofrequency waves and magnetic fields to produce extraordinary images—highly detailed and in three dimensions—of all parts of the body.
5 Injecting dyes into a patient can delineate blood vessels. Unfortunately it’s quite unpleasant, especially compared to an ultrasound: patients must lie still for a prolonged period in a big, noisy machine, and for someone with claustrophobia, it represents a big challenge even with sedative medications. (There are “open” magnets to help minimize claustrophobia.) Likewise, the process requires a specialized facility with sophisticated multimillion-dollar equipment, with the magnets often cooled by liquid helium to nearly–270 degrees Celsius.
6 Thus MRI will never become a portable, real-time, and wireless digital device.
IONIZING RADIATION
Ionizing radiation technologies include projection radiography, such as X-ray and mammograms, fluoroscopy, CT scans, and nuclear scans. These methods, unlike sonographic or magnetic methods, involve some risk: the interaction of radiation and atoms in the body can produce free radicals and can induce DNA damage.
7 Furthermore, they can uncover what are known as incidental findings—essentially abnormalities that, although they are real, do not require further tests or procedures but nevertheless often do lead to more tests or procedures. In spite of these shortcomings, the ability to image virtually any part of the human body and obtain high-resolution pictures is extraordinary and continues to reshape current and future medical practice. There are even software applications for integrating images taken from multiple modalities in a given patient to provide an extremely high-resolution view inside the body.
8 Below I focus my discussion on the use of imaging in three major areas: heart, brain, and cancer.
The amount of ionized radiation is typically measured in millisievert units or mSv.
Table 6.1 shows typical imaging exposure and compares each to the exposure in a routine chest X-ray reference standard.
9 There is some radiation exposure—about 3.6 mSv—from natural background sources, a figure that has not changed appreciably in the past thirty years. But the dose of radiation from medical imaging has increased more than sixfold. Indeed, the use of ionizing radiation for medical imaging has skyrocketed beyond any outlandish projection. In 1980, only 15 percent of the population’s exposure to radiation was derived from medical imaging; by 2010 it had become 50 percent. In 1980 there were fewer than three million CT scans in the United States; in 2010 that number had grown to over eighty million. Each year 10 percent of the population in the United States undergoes a CT scan, and the use of CT is still growing by more than 10 percent per year.
10 As with magnetic resonance imaging, CT scanners are more than twice as common in the United States per capita than in any other country in the world.
11 There are about twenty million nuclear medicine procedures and a similar number of angiograms and fluoroscopic procedures done each year in the United States.
An annual exposure of radiation in excess of 20 mSv is considered high and correlated with an increased risk of cancer. A dose greater than 50mSv is considered “very high.” It is now estimated that approximately 2 percent of all cancers in the United States may be related to the use of ionizing radiation.
12 Evidence that radiation exposure is linked in a linear relationship with cancer, and that there is no threshold below which exposure does not matter, has been reinforced by a fifteen-country study of 407,391 nuclear industry workers. In this cohort, there was a significant association between dose of radiation and cancer-related death as well as death in general; the rates of death were excessive at lifetime (not annual) cumulative doses as low as 5 to 50 mSv. A recent Canadian study of over 82,000 patients in Quebec followed for more than ten years showed that the risk of developing cancer within five years increased 3 percent for every 10 mSv of radiation exposure.
13 Accordingly, there is really
no safe annual dose of ionizing radiation, and the cumulative dose is clearly an important metric of exposure and risk of cancer. This is especially a concern among children, who have experienced a sharp increase in radiation exposure through the liberal use of CT scans in emergency rooms.
14 One would anticipate that there is a strong genomic predisposition to DNA damage and cancer, whereby some individuals are protected and others are highly susceptible, but any variations in genes that account for this risk have not yet been identified.
15
TABLE 6.1: The amount of ionizing radiation exposure in millisievert (mSv) units for various medical imaging procedures, with comparison to airport screening and dental X-rays. Adapted from
White Paper: Initiative to Reduce Unnecessary Radiation Exposure from Medical Imaging, Center for Devices and Radiological Health, U.S. Food and Drug Administration, February 1, 2010, and R. Fazel, “Exposure to Low-Dose Ionizing Radiation from Medical Imaging Procedures,”
New England Journal of Medicine 361 (2009): 849–57.
| Procedure | mSv Adult Dose | Equivalent No. of Chest X-rays |
|---|
| Airport whole body backscatter scan | 0.002 | 0.1–0.2 |
| Dental X-rays | 0.005–0.01 | 0.25–0.5 |
| Chest X-ray | 0.02–0.1 | 1 |
| Mammography | 0.4 | 20 |
| CT scan of head | 2 | 100 |
| CT angiogram of heart | 16 | 800 |
| Nuclear lung scan | 0.2 | 10 |
| Nuclear heart scan | 41 | 2000 |
| Angiogram of brain | 5 | 250 |
| Angiogram of heart | 6 | 400 |
| Coronary stent procedure | 15 | 750 |
There is also as much as tenfold variation in the radiation dose from ostensibly identical procedures. In 2010, a
New York Times front-page investigative feature article, “The Mark of an Overdose: The Radiation Boom—A Test Turns Dangerous,” found that more than four hundred patients at eight hospital facilities in California and Alabama suffered massive radiation overdose from CT scans of their heads.
16 Multiple individuals who were interviewed suffered acute radiation toxicity with symptoms including hair loss, headaches, memory loss, and confusion. The biggest danger for these individuals is the subsequent risk of cancer. Compounding the overdose mistake is the fact that some 20 to 40 percent of CT scans are medically unnecessary.
17 Double CT scans of the chest (one scan with contrast dye, one without), with each scan equal to 350 chest X-rays, are being performed in over 30 percent of U.S. hospitals without any justification for the second scan.
18In 2009, a study of a large patient population of 952,420 adults between the ages of eighteen and sixty-four sought to quantify the radiation exposure from different procedures.
19 The largest contribution was heart-perfusion imaging, with an average dose of 15.6 mSv and accounting for 22 percent of the radiation exposure from all procedures. This was followed by CT scans of the abdomen, pelvis, and chest, with an average dose of 6 to 8 mSv, which were responsible for 18 percent, 12 percent, and 8 percent, respectively, of the radiation dose of all procedures.
20 This study also found that 2 percent of the individuals were getting an annual dose of radiation that exceeded 20 mSv. These patients were often subjected to multiple imaging studies as the result of findings that were unrelated to the indication for the scan but that might require further evaluation, although they usually proved not to be problems.
The Mayo Clinic published a study of imaging-related incidental findings in 2010. Of 1,426 imaging examinations, almost 40 percent had at least one incidental finding. CT scans of the abdomen and pelvis had the highest likelihood of this problem, almost twentyfold higher than ultrasonography.
21 CT scans of the lung and MRIs of the brain had a twelvefold risk of incidental findings. Most of the incidental findings were nodules, such as in the lung, which resulted in serial CT scans and lung specialist consultation. In very few individuals, with a three-year clinical follow-up, was there evidence of clear benefit for chasing down these incidental findings.
22The benefits and risks of CT scans are exemplified by one of the largest trials ever undertaken by the National Institutes of Health—the National Lung Screening Trial (NSLT). This trial cost over $250 million, conducted at thirty-three medical centers from 2002 to 2010, and enrolled 53,500 individuals, ages fifty-five to seventy-four, who were either former or current smokers. Instead of the usual lung CT, the trial used the helical low-dose CT that carries much lower radiation exposure, closer to that of a mammogram than that of a regular lung CT. The aim was to reduce the toll of lung cancer, which accounted for almost 160,000 deaths in the United States in 2010—more than colon, pancreatic, breast, and prostate combined. It has long been thought that lung cancer is diagnosed too late in its progression and that the late pickup, in part, accounts for the 85 percent death rate.
23By random assignment, half of the individuals in the study had lung CT screening; the other half had chest X-rays. These imaging studies were repeated twice during the next two years, and the patients were followed for five years. There was a 20 percent reduction in lung cancer deaths, but since the incidence of cancer was low in general, that works out to one person saved per three hundred screenings. Furthermore, 25 percent of the individuals had incidental findings, often prompting more procedures, and nearly all were benign. Since forty-six million Americans smoke, the researchers extrapolated that thousands of lives would be saved. But mass lung CT scanning would cost billions of dollars each year.
24
HEART IMAGING
Coronary artery disease is the most common heart disorder, so medical imaging of the heart is focused on detecting blockages in the arteries that supply the heart muscle. A treadmill stress test with multiple EKG readings is the “plain vanilla” assessment. Since this is not considered a very reliable test, imaging of the heart is done in conjunction with the stress test and EKG—either echo or nuclear. Both of these are indirect measurements, since they do not indicate whether there are any blockages in the arteries but instead show whether parts of the heart muscle are not contracting properly (in the case of echo) or if the radioactive tracer is symmetrically getting to the different regions of the heart (nuclear perfusion study).
Approximately 30 percent of the overall radiation exposure to the U.S. population related to medical imaging is attributed to heart imaging.
25 The chief culprits are nuclear perfusion scans. Most patients with established coronary artery disease have an exercise test with nuclear perfusion scan on an annual basis. There are well over ten million performed each year, increasing at a rate of more than 6 percent per year. This test alone accounts for more than 10 percent of the entire cumulative effective dose to the population from all medical imaging sources.
26 In 2010 Columbia Medical Center in New York City published a study of 1,097 patients, each of whom had at least one heart nuclear perfusion scan over a ten-year period. It found that the average patient had fifteen ionizing radiation imaging procedures, and more than 30 percent had cumulative exposure greater than 100 mSv. Multiple heart nuclear perfusion scans were performed in 38 percent of the patients with an average cumulative radiation exposure of 138 mSv.
27 Another study of 64,071 patients with heart attack found the average dose of radiation was 15 mSv as a result of having, on average, more than four ionizing radiation imaging procedures.
28That’s a lot of radiation, so finding some safer method would seem imperative. Unfortunately, not every patient is especially “echogenic,” making ultrasound images difficult to interpret. Fortunately, there are other tools available—coronary angiography and CT angiography.
Coronary angiography is considered the gold standard, the direct way to assess blockages. A tiny catheter is inserted in the artery in the arm or the leg and threaded to the area in the aorta where the coronary arteries originate, and contrast dye is injected to provide the roadmap. This procedure is not without risk: the very rare but notable risks of stroke, damage to an artery, and damage to the heart itself. What’s worse is that most people don’t need to take the risk. In a large national study of 663 hospitals and 398,978 patients, only 38 percent of those undergoing the procedure had significant blockages!
29 Still, when actually called for, the procedure can often include implanting a stent to restore the normal heart blood supply.
The other alternative to directly detecting blockages is the CT scan angiogram. This test got legs in 2004, and at the time its boosters promised it would set off a revolution in medicine, or at least cardiology.
30 Over the course of the next few years, the test evolved from sixteen to sixty-four detectors to increase image resolution, but a large multicenter comparison of the test with conventional coronary angiography did not show it was as accurate, especially for patients who did not have significant blockages.
31 Both forms of angiography use contrast dye, which carries its own risk of kidney toxicity and allergy, and if the CT scan is positive for a blockage, it would require a conventional coronary angiogram to address the narrowing (assuming the patient was suitable for a stent instead of bypass surgery). The radiation exposure for CT heart angiography is substantial and was recently demonstrated by a group of fifteen hospitals in Michigan that this can be reduced from an average of 21 mSv to 10 mSv without degradation of image quality.
32 This is still almost double the radiation dose of a conventional angiogram, but a major step in the right direction.
In cardiology, we do not have a problem in detecting significant coronary blockages, although we do far too many tests and use much too much radiation to get that accomplished. The challenge to preventing deaths and heart attacks is that we do not have a way to detect the individuals who have a minor blockage that might suddenly crack or rupture. This will likely require molecular diagnostics, such as detecting the arterial cells that are sloughing off into the circulating blood from the diseased and inflamed artery, which typically precedes a heart attack, or detecting some nucleic acid signature reflecting this vulnerability. Active research is ongoing in this area, and the good news is that, if ultimately successful, it will not likely require any radiation exposure.
BRAIN IMAGING
One of the most vital areas of biomedical research is to prevent or optimize treatment for Alzheimer’s disease, the leading cause of dementia of the aged and one that so far has defied all attempts at prevention. In 2010, 35 million individuals had Alzheimer’s disease worldwide, with 5.5 million people diagnosed in the United States. Unless something happens to stop this epidemic, those figures will triple by 2050.
33The unequivocal diagnosis of Alzheimer’s has required the clinical symptoms of memory loss and diminished ability to carry out daily activities plus the classic brain autopsy findings of two sick proteins: plaques of beta-amyloid protein and neurofibrillary tangles in the temporal lobe filled with tau protein. The diagnosis is difficult to make, since dementia is frequent among the elderly, and at least 20 percent is unrelated to Alzheimer’s disease.
34In 2010, the field underwent a big shakeup for the first time in twenty-five years, partly related to advances in imaging and biomarkers.
35 For the first time there was consensus reached by the National Institute of Aging (part of the NIH) and the Alzheimer’s Association that the disease goes through three major phases: a preclinical phase, when there is accumulation of beta-amyloid but no symptoms or clinical manifestations, lasting ten or even twenty years; a phase of mild cognitive impairment (subdivided into early and late), lasting one to four years, characterized by memory lapses and later by poor decision making; and finally progressive dementia, with inability to carry out activities of daily life.
36 During the preclinical phases and mild cognitive impairment phases, beta-amyloid deposits in regions of the brain that form new memories, and this induces damage to synapses (the connecting space between brain cells).
37 Later, approximately one to five years before the diagnosis, tau is building up inside the brain cells of the temporal lobes, and extensive phosphate groups attach to this sick protein, forming tangles and causing further damage. Ultimately, areas such as the hippocampus (the key memory area and the place where beta-amyloid markedly accumulates) and the cortex (important for higher-level cognitive function) atrophy, as a result of the substantial death of brain cells.
38
FIGURE 6.2: Different imaging modalities to show the characteristic findings in Alzheimer’s disease. At top is the Pittsburgh B Compound (PIB) PET imaging, with corresponding parts of the brain schematically depicted. Similarly, for quantitative MRI and fluorodeoxyglucose PET, the affected areas of the brain are shown. The “default network” is the part of the brain involved in mind wandering (daydreaming) and in the individual’s sense of self, which is especially affected in Alzheimer’s. Source: R. Perrin, “Multimodal Techniques for Diagnosis and Prognosis of Alzheimer’s Disease,”
Nature 461 (2009): 916–22.
Part of the acceptance of this path to Alzheimer’s was attributed to the use of brain imaging and chiefly two different modalities: magnetic resonance imaging and nuclear positron emission tomography (PET) scanning. There are two different MRI scans for Alzheimer’s—structural (also known as volumetric) and functional. Structural is used to quantify the atrophy of the brain. The functional MRI enables us to see which parts of the brain are activated by specific tasks. The PET nuclear imaging, by using glucose tagged with a radioactive isotope, reveals activity too; low uptake of the sugar reflects inactive or dead cells.
39The “new new” imaging thing in 2010 was a concept incubating for several years—the PET scan with Pittsburgh Compound B (PIB) (see
Figure 6.2), which relies on a radioactive fluoride compound.
40 There was convincing evidence that PIB could track the actual beta-amyloid plaque—for the first time, the medical field had the ability to light up the parts of the brain that had accumulated this sick protein.
41 This nuclear test (now called Amyvid) was recommended for approval by an expert panel convened by the FDA in 2011 based on data in 152 patients, but still awaits final commercial approval.
FIGURE 6.3: The pattern of various biomarkers over time in the stages of Alzheimer’s disease from presymptomatic to early and late mild cognitive impairment (eMCI and lMCI), displaying the trends in imaging, cerebrospinal fluid, activities of daily life (ADL), and cognitive performance (Cog). Source:
Future Opportunities to Leverage the Alzheimer’s Disease Neuroimaging Initiative (Washington, DC: National Academies Press, 2010).
An alternative means of detecting the process was through performing a lumbar puncture to collect cerebrospinal fluid and measuring both the tau and the beta-amyloid proteins.
42 A high tau to amyloid ratio was found to be strongly suggestive of risk of developing Alzheimer’s. The graph shown in
Figure 6.3, part of the Institute of Medicine’s 2010 report
Future Opportunities to Leverage the Alzheimer’s Disease Neuroimaging Initiative, pulls most of these concepts together.
43 In the preclinical phase PIB imaging can show the beta-amyloid deposition in the brain, and the cerebrospinal spinal fluid (CSF) will demonstrate presence of the amyloid protein species known as Abeta-42, which is especially prone to aggregation and damage. During mild cognitive impairment from early (eMCI) to late (lMCI), not only are these markers evident and progressing, but tau can be detected in the spinal fluid, MRI lights up the abnormal hippocampus, and the PET scan shows that regions of the brain are not metabolizing glucose normally. As MCI is progressing, cognitive impairment accelerates, and the deterioration of the individual’s daily life functional capacity is fully manifest.
44While all of this tracking ability for early detection or risk of Alzheimer’s is academically interesting, and will be helpful to develop effective drug or vaccine strategies, individuals will likely be reluctant to undergo spinal taps or multiple scanning procedures. There is considerable work being done to use a blood marker that would identify individuals with increased risk. Back in 2007, the company Satoris published intriguing findings using an eighteen-protein test that was nearly 90 percent accurate in detecting the likelihood of progressing from mild cognitive impairment to Alzheimer’s.
45 The National Institute of Aging reported the correlation of blood levels of a protein known as Apoε with the amount of amyloid plaque in the brain, and a group of investigators led by the University of California, San Francisco, showed the correlation between a beta-amyloid blood plasma level and subsequent cognitive decline.
46 Another recently developed blood test approach leverages the presence of auto-antibodies.
47 The Alzheimer Disease Neuroimaging Initiative (ADNI) Consortium and the pharmaceutical industry are doing ongoing work in this area.
48 But as Sanjay Pimplikar wrote in a
New York Times op-ed, “brain scans and spinal taps may do patients little good.”
49To date, there are no effective therapies and a veritable graveyard of drugs (numbering more than twenty) that have blatantly failed.
50 The only commercially approved drugs are the so-called cholinergic drugs (donepezil, rivistigmine, galantamine), and their effect is minimal. The number of theories for the root cause of Alzheimer’s is telling by itself—is it indexed to the sick beta-amyloid or tau proteins (production, accumulation, or clearance), or the damage to or intrinsic health of the synapses or the mitochondria? Part of the problem here may be that “Alzheimer’s disease” may look similar in scans and via biomarkers, but for any given individual there may be a specific gene and biological pathway that are responsible. This is “the many roads to Rome” concept. For some it may involve beta-amyloid; for others, tau protein accumulation.
There are over a hundred drugs in development for prevention of Alzheimer’s, reflecting that this condition is one of the highest priorities of the pharmaceutical industry.
51 In fact, except cancer therapies, no field in medicine has more novel drugs being pursued. The programs can be viewed as elegant, targeted approaches at nearly every level that has been theorized to play a role: blocking beta-amyloid production, preventing beta-amyloid aggregation, revving up beta-amyloid clearance, increasing brain resistance to beta-amyloid, inhibiting tau protein, improving the function of synapses, and preventing mitochondrial dysfunction.
52 Most of the drugs have had success in mice models that attempt to simulate the disease, but the failure of so many similarly validated drugs makes one wonder how good a model a mouse is. Nevertheless, the newfound ability to use imaging and biomarkers to define individuals at risk, and to intervene very early in its progress, or what in medicine is commonly referred to as “the natural history,” may ultimately lead to effective prevention.
MAPPING THE BRAIN AND CONTROLLING THE MIND
Functional MRI (fMRI) has had an extraordinary ability to read a person’s mind. A major feature of the technology is the ability to interview the subject, show images or movies, or monitor task performance, among many other stimuli or provocations, while performing the test. A recent study by Cal Tech tested the ability of individuals to deal with multiple competitive stimuli using images of Marilyn Monroe, Josh Brolin, Michael Jackson, and Venus Williams. The patients in the study had intractable epilepsy, so they also had intracranial electrodes placed in addition to the MRI scans at the time of surgery for possible resection of the part of the brain that is the culprit. The study showed the remarkable ability for the individuals to control their temporal lobe stimulation by focusing on a single image. Functional MRI has been used to determine whether an individual is lying, although the tests have not yet been permitted as evidence in the courtroom.
53Functional MRI has also been used to determine brain maps consistent with political activism, introspection, courage, confidence, feelings of romance toward and deep attachment to a significant other, the impact of learning to read on children and on those who are illiterate, the positive effect of placebo treatment, and a long list of human behaviors.
54 Medically, it has been applied to characterize autism, schizophrenia, depression, and attention deficit disorder. Mapping the brain with MRI has set the foundation for image-guided neurosurgical interventional procedures. The Japanese, in particular, have been using near-infrared spectroscopy (NIRS) as an alternative to fMRI for tracking blood flow by leveraging the property of hemoglobin to absorb much more light than other tissue constituents. In Japan it has been used to diagnose bipolar disorder and schizophrenia, along with other psychiatric disorders.
55One of the most extraordinary things I have ever seen in medicine is the effect of deep brain stimulation (DBS) in a patient with severe Parkinson’s disease. In the late 1990s, I referred a patient to Dr. Ali Rezai, a neurosurgeon who headed up the program of neuromodulation at Cleveland Clinic. The patient had such severe tremors and involuntary movement that he was unable to walk or carry out most activities of daily living. After an extensive clinical evaluation and brain imaging, and mapping during the surgery with electrodes placed on the brain tissue, doctors placed a pacemaker lead in the patient’s brain region known as the globus pallidus. A generator, placed in the neck, was connected to the lead and controlled whether the electrical activation was on or off. Following the surgery, the patient not only had a dramatic reduction of requirement for medications that he was not tolerating or responding to but was able to resume his prior activities, which were extensive and included playing golf. Not so many patients have such a dramatic impact from a brain pacemaker, and there are multiple potential complications, but it is striking to watch a patient turn on or off the generator and go from seriously physically impaired to appearing virtually nondisabled and fully ambulatory. Bringing this image to mind reinforces a relatively newfound and extraordinary capacity for a medical device implant to take control of one’s brain.
Deep brain stimulation is currently used for some other indications, including severe essential tremor, Tourette’s syndrome, and severe cases of obsessive-compulsive disorder, and it is being explored for a wide range of neurologic and neuropsychiatric conditions, including bipolar disorder, post-traumatic stress, epilepsy, depression, autism, and schizophrenia. In these investigational pursuits, the brain is mapped before surgery with an fMRI and during the operation with intracranial electrodes to define what specific region, if any, may benefit from pacemaker activation.
Dr. Rezai told me about another particularly memorable case. A patient had such severe depression that he was deemed catatonic, with no ability to show emotion and barely any physical activity. He had been this way for years, despite multiple drug treatments and the use of electroconvulsive therapy. He underwent the surgery while being only mildly sedated, which is typical for deep brain surgery, since the brain has no sensory receptors. Brain activation was mapped with electrodes on its surface. Dr. Rezai activated one region of the brain, and the patient smiled, probably for the first time in many years, and further mapping indicated it was an ideal spot for the pacemaker lead. All went well during the surgery, and the patient afterwards had an entirely different physical appearance and friendly behavior, interacting with the hospital staff and his spouse. He was discharged on a Friday. Over the weekend, however, Dr. Rezai got an urgent call from the patient’s wife, who begged him to turn off the pacemaker. The patient, who hadn’t wanted to have sex for fifteen years, now wanted to have sex continuously. Fortunately Dr. Rezai was able to titrate the electrical activity, and over time this unanticipated problem settled down.
Perhaps the most exceptional mind control story came in 2007, when Dr. Rezai and colleagues from Cornell University used brain mapping and deep brain stimulation in a thirty-eight-year-old man who, following severe traumatic brain injury, had been in a minimally conscious state, completely unable to communicate or respond, for more than six years. An fMRI showed that a large language network was preserved, so a deep brain stimulation was pursued in the hope it might restore consciousness. Indeed, within forty-eight hours of surgery, the patient became aroused, turned his head from side to side, had sustained eye opening, and over the weeks ahead became capable of naming objects, feeding himself, and being progressively interactive.
56Beyond brain pacemakers to stimulate the mind, there has been much interest in “brain training” or “brain calisthenics” with cognitive stimulation, with various tools like crossword puzzles and Sudoku; interactive computer software such as CogniFit, Posit Science, and Happy Neuron; video games like Nintendo Brain Age or Sega Brain Assist; and brain gyms. The theory, promoted particularly by companies with proprietary brain fitness products, is that training will promote brain plasticity—the ability to form new synapses. So far, this has not been convincingly proven, and a recent study of over 11,000 participants conducted in Cambridge using a six-week online stimulation program found no evidence of improvement in general cognitive functioning.
57
CANCER IMAGING
Besides the use of imaging to screen and detect early cancer, such as the massive lung cancer study using spiral CT scanning previously discussed, or MRI to back up mammography for more accurate detection of breast cancer, the major use of imaging in cancer is to characterize the tumor and the extent of metastasis (“staging”), and then to track response to treatment.
58 Imaging that demonstrates shrinkage of the tumor for at least a six-month period is encouraging, but even that has not been shown to correlate with overall, long-term clinical benefit for patients.
In the early stage of testing a new drug, a marked response by imaging may be a solid indicator to fulfill the “proof of concept” that the therapy has considerable promise. In the case of malignant melanoma, which is usually fatal within one year of diagnosis, almost 60 percent of individuals carry a specific point mutation in their tumor in the gene BRAF (known as V600E).
59 By 2011, more than three hundred fifty patients with malignant melanoma received an oral drug directed to the V600E mutation in BRAF, and 81 percent had a striking response within two weeks as manifest by PET scan (see
Figure 6.4).
60 There was a 63 percent increase in survival compared with conventional therapy (dacarbazine) at one year. Interestingly, those individuals without the BRAF mutation who received this highly targeted drug actually got worse. In the United States the use of imaging for following cancer treatment has exploded in recent years. Researchers at Duke reported on over 100,000 patients diagnosed and treated between 1999 to 2006 with a diverse array of cancers—breast, prostate, lymphoma, leukemia, colon, and lung. The annual increase in PET was from 36 to 54 percent, for nuclear bone scans 6 to 20 percent, for MRI 4 to 12 percent, and for ultrasound 1 to 7 percent. This imaging accounts for only 6 percent of the total annual costs—in excess of $250 billion—of cancer care, but it remains unclear whether the increase in imaging has led to better outcomes for patients.
61In certain situations the use of sophisticated imaging has been shown to make a difference. In a randomized trial of a particular type of lung cancer (non–small-cell), the combined use of PET with CT tomography was compared to conventional staging alone. The accuracy of the PET-CT approach was clear, with an increase in prevention of unnecessary lung surgery, which requires opening the chest. Combining ultrasound and MRI has been evaluated for improving the accuracy of breast cancer detection. The technique known as magnetic resonance elastography uses low-frequency sound waves at 60 hertz passed through plastic tubes while the patient is simultaneously undergoing the MRI. The variations in how the tissue moves by ultrasound, picked up by MRI, may help differentiate cancerous versus normal tissues. An alternative and much more practical approach for breast cancer imaging involves the use of a handheld near-infrared scanner that quantifies how light energy scatters through the tissue. Another handheld device that uses Raman spectroscopy, a technique that detects vibrational states of molecules, has been found useful for distinguishing melanoma from benign moles.
62
PRINTING ORGANS
At the 2011 TED (Technology, Entertainment, Design) conference in Long Beach, California, Dr. Anthony Atala, the director of the Institute of Regenerative Medicine Institute at Wake Forest University, talked about “printing” a human kidney.
63 He discussed how the information from an individual’s three-dimensional CT scan was sufficient to design and print a three-dimensional, working kidney for that patient. He talked about how it takes “about seven hours to print a kidney” and how it is like baking a cake, and then showed the audience a “kidney structure” that was made by the high-tech printer. As part of the presentation, patient Luke Masella, who had been born with spina bifida and ten years previously had received a bladder tissue engineered by Atala, discussed how he was now leading a regular life as a college student. The audience gave him a standing ovation. The media reports were quite dramatic: “Surgeon Prints New Kidney on Stage,” “Need a Kidney? Just Hit Print,” and “Next-Step in 3-D Printing: Your Kidneys.”
64 The reports confused the bladder tissue engineering with a kidney being printed for Luke ten years earlier. For a brief period, it seemed that we were ready to forego organ transplants, since all we needed to do would be to print organs. Then Wake Forest University issued a press release to correct the misconception: the kidney that Atala showed was just a mold (we can’t just blame the media—he certainly did not make that clear during the presentation), without any blood vessels or internal structures, even though it looked like a kidney from the outside. Nevertheless, the whole incident brings to mind exciting futuristic possibilities.
FIGURE 6.4: PET scan of an individual with malignant melanoma before and two weeks after taking an oral medication directed against the BRAF V600E mutation, showing marked resolution of the metastasis, indicated by considerably less uptake of the isotope (darkened areas throughout the chest, abdomen, and left arm). Source: G. Bollag, “Clinical Efficacy of a RAF Inhibitor Needs Broad Target Blockade in BRAF-Mutant Melanoma,”
Nature 467 (2010): 596–99.
Atala led a team in 2006 that published a report in the
Lancet on their experience of growing bladders in culture from a biopsy and then implanting the organs into seven patients, ranging from four to nineteen years old, all of whom had been affected by spina bifida.
65 (Luke Masella was one of those patients.) To grow a whole bladder from the limited tissue derived from a biopsy, and then implant that back into individuals whose bladders were not functioning, was surely a biomedical triumph. It remains unclear whether it will become widespread. More recently an entire synthetic retina was generated from embryonic stem cells in mice. The bioengineered bladder and eye are possible because given the chance in a three-dimensional culture, cells are capable of self-organizing into highly specialized tissue. Another integration of 3-D printing and self-organizing cells was recently accomplished with a successful lab-made trachea transplant for a thirty-six-year-old patient with cancer of the windpipe. A plastic trachea was produced from 3-D images of the patient’s own trachea, and stem cells derived from the patient’s bone marrow were introduced onto this scaffold before the transplant.
66Printing organs—enabled in part by the exquisite three-dimensional images we can make of any organ—is another story. In 2011, the
Economist had on its cover “Print Me a Stradivarius” and included a feature on the progress being made in three-dimensional printing, as manufacturers use the technology to make landing gear for airplanes, jewelry, boots, lampshades, racing car parts, parts of a violin, customized mobile phones, and solid-state batteries.
67 A 3-D printer is somewhat like an inkjet printer, and it works by printing successive layers according to a computer-aided design. The design itself can be extracted from 3-D CT scanning, which captures its images layer by layer. Already dental crowns and titanium medical implants for bone are now being produced via 3-D printers. The company Organovo, based in San Diego, is making solid progress in printing blood vessels. As one of their scientists was quoted in a
Wired feature article, “Sir, Your Liver Is Ready: Behind the Scenes of Bioprinting,” “Right now we’re really good at printing blood vessels. We printed ten this week. We’re still learning how to best condition them to be good, strong blood vessels.”
68 Certainly the requirement of having an intact blood vessel supply for any organ makes this step a vital building block.
Parts of the story of organ printing are beginning to come together, but despite the excitement induced by the kidney mold at TED, bioprinting of organs has to be seen as several years away from reality. Nevertheless, the exceptional progress of 3-D medical imaging is what makes it all the more likely to be eventually possible. And the ability to go from digitizing an organ to someday printing a new one reinforces the concept of where digitizing human beings can take us.