Chapter 4
Heat Transfer and Phase Transitions
This chapter will analyze the common forms of heat transfer — convection, conduction and radiation — and their accompanying effects such as expansion and phase changes.
4.1Convection
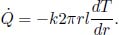
Convective heat transfers are difficult to analyze rigorously but a rule of thumb adequate for small temperature differences is Newton’s law of cooling. It states that the net heat flux density  — the net power transmitted per unit perpendicular area — between a small area on a liquid or solid surface and the surrounding air (which convects heat away) is proportional to the temperature difference between them for small differences. Concretely,

where Ts is the temperature of the small area on the surface while Ta is the temperature of the air shrouding our set-up. The negative sign hinges on the fact that a surface of higher temperature loses heat to its surroundings. h is a constant of proportionality that must be determined empirically (as this is only an approximate relationship) and is commonly referred to as the heat transfer coefficient. The total net power  transferred between a surface with uniform temperature and its surroundings is then multiplied by its surface area A.

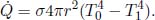
Problem:Assuming that Newton’s law of cooling holds with a heat transfer coefficient h, determine the instantaneous temperature T(t) of a cup of coffee with constant heat capacity C, whose interface with air has a constant surface area A, as a function of time. The temperature of air in the room is approximately a constant Ta as air is vast and the initial temperature of the coffee is T0 > Ta. Assume that the coffee is homogeneous at all times.
Let the instantaneous temperature of the coffee be T. By Newton’s law of cooling, its net heat flux with its environment is

Since 

Observing that T ≥ Ta at all times since T0 ≥ Ta (more specifically,  is negative only when T > Ta and becomes zero when T = Ta), we can remove the absolute value brackets.

4.2Conduction
Conduction occurs within a substance due to collisions between its constituent particles and the diffusion of particles. The collisions between excited particles and less energetic particles and the net diffusion of more energetic particles result in the transfer of energy from regions of higher temperature to regions of lower temperature. Quantitatively, Fourier’s law of conduction states that the heat flux density is proportional to the temperature gradient. In a one-dimensional heat flow along the x-direction,

where is the heat flux density and  is the temperature gradient. k is known as the thermal conductivity and is dependent on the various properties of the conducting medium. The negative sign stems from the fact that the heat flux density points in the direction of decreasing temperature. Since a one-dimensional flow is assumed, the total heat flux across a surface of area A normal to the x-direction is

Usually, we will be analyzing steady state systems where there is no longer any change in the temperature of any point on the substance with respect to time. There can, however, still be heat conducted throughout the substance as long as the heat influx is equal to the heat outflow for each point on the substance if heat is not generated anywhere in the substance. This condition is known as the continuity of heat flux which ensures that no net heat is stored anywhere in the substance. If there is heat generated by portions of the substance itself, the outflow must be greater than the influx for equilibrium to be maintained.
Problem: Consider a slab of thickness l and uniform cross sectional area A, in Fig. 4.1. Its ends are maintained at T0 and T1. Assuming that the system has reached steady state, find the heat flux through the cross section of the slab and the temperature of a layer at a distance x from the end at T0 as a function of x.

Figure 4.1:Slab
From Fourier’s law of conduction,

where the heat flux is defined to be positive rightwards. Since the system is at equilibrium, we can leverage the fact that is uniform throughout all cross sections to determine its value.
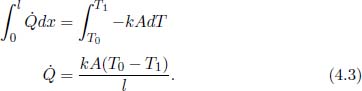
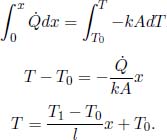
To determine the temperature T(x) of a layer at a distance x from the left end, we integrate the expression with more general limits.
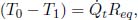
Observe that from Eq. (4.3), we can relate the temperature difference across the two ends of the slab and the heat flux in the following manner.
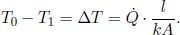
This holds for all substances with a uniform thermal conductivity and cross sectional area (slabs in general). Scrutinizing the above, one may notice that it is completely analogous to Ohm’s law for a resistor,

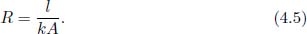
where V is the voltage, I is the current and R is the electrical resistance. Temperature and heat flux are then analogous to voltage and current in a circuit.  is the thermal equivalent of electrical resistance, which we shall refer to as thermal resistance. Observe that the expression for thermal resistance is also completely analogous to that for electrical resistance for a resistor with a constant cross section. In the case of the latter, for a resistor with conductivity σ, length l and a constant cross sectional area A,

With that said, the following two equations can be written down. For a steady state one-dimensional heat conduction with no heat generation at any point in the system, the temperature difference between two surfaces is directly proportional to the heat flux across them.

where R is the thermal resistance. Its value for a substance of uniform thermal conductivity k, length l and cross sectional area A is
The thermal resistances of more general configurations need to be calculated in other ways. Besides the similarity of resistances, analogies can be drawn between Kirchhoff’s laws and certain properties in a thermal circuit. Kirchhoff’s loop rule, which states that the sum of voltages along a loop is zero, is superficial in this context as its thermal counterpart basically asserts that the sum of temperature differences along a loop is zero. However, the analogous version of Kirchhoff’s junction rule, which enforces the condition that the net current flowing out of a junction is zero at steady state, is rather crucial. This is in fact the continuity of heat flux which asserts that the net heat flux emanating from each point in a set-up with no heat generated must be zero at steady state (else its temperature will vary). We will delve further into the ramifications of these analogies right after the following example.
Varying Contact Area
For certain geometries of substances, the contact area may vary with x. However, the heat flux should still be continuous throughout layers of the substance in the steady state regime, as long as the substance does not generate any heat by itself. Then, we may need to perform an integration to calculate the rate of heat conduction.
Problem: In Fig. 4.2, a long cylindrical shell has an inner radius r0 and outer radius r1, length l(l  r1) and a uniform thermal conductivity k. The temperatures of the inner and outer surfaces are maintained at T0 and T1 respectively. When the system has attained steady state, determine the heat flux across cylindrical shells and thus the thermal resistance of this set-up. Neglect any edge effects.

Figure 4.2:Cylindrical shell
Due to the axial symmetry and comparatively large length of this set-up, heat purely flows in the radial direction, perpendicular to the cylindrical axis, while temperature is purely a function of radial distance from the axis. Consider a cylindrical shell that is of radius r, length l and thickness dr from the center of the original cylindrical shell. The heat flux density should be uniform across this surface of area 2πrl due to symmetry. By Fourier’s law of conduction, the total heat flux through this shell is
For the system to be in steady state, the heat flux across all cylindrical shells must be the same so that the net heat flux into each layer is zero. Then,

It can also be seen that the thermal resistance is

4.2.1Equivalent Resistance
The analogy between thermal resistors and electrical resistors extends beyond a single resistor. We can determine the effective thermal resistance for parallel and series configurations of various materials with different thermal conductivity due to the analogy between continuities of heat and current fluxes in steady state systems. When no heat is generated by a substance, there must be no net heat flux entering or leaving each surface as this would lead to an accumulation or deficit in internal energy — implying that the system has not reached steady state yet. As remarked previously, this is similar to Kirchhoff’s junction rule in circuitry.
Series Configuration
Before we derive an expression for the general case, consider the following auxiliary problem. Two slabs of different thicknesses, l1 and l2, uniform cross sectional area A and thermal conductivities k1 and k2 are connected in series as shown in Fig. 4.3. The two ends are maintained at temperatures T0 and T2 respectively. Find the heat flux, the effective thermal resistance of the combined system and the temperature of the interface, T1, at steady state.
Again, it is important to note the continuity of heat fluxes at the two sides of the middle interface. If the heat flux between the left side and the interface is , the heat flux between the interface and the right surface must also be . Next, an equivalent thermal circuit can be drawn as shown above.

Figure 4.3:Slabs in series
Recalling our definition of R previously, we can define

Then applying the results derived previously,

Eliminating T1, we get

The equivalent resistance is defined such that

T1 can be solved for by eliminating in our original simultaneous equations.

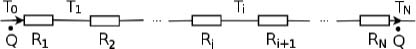
Figure 4.4:Equivalent circuit
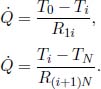
In general, for a thermal circuit constructed from an array of thermal resistors arranged in series, an equivalent thermal resistance can be derived. Referring to Fig. 4.4, let there be a total of N thermal resistors with resistances R1, R2, . . . , RN and let T0 and TN be the temperatures of the ends of the circuit (maintained at constant temperature). Then for 0 < i < N, let Ti be the temperature of the interface between the ith and (i + 1)th thermal resistors. We would like to find the equivalent resistance of this circuit Req and the various Ti’s. For a system in equilibrium, must be constant throughout. Thus,

for all 0 ≤ i < N. Summing the above for all i, we get
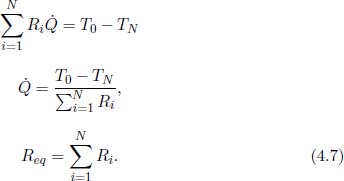
To calculate Ti we can spilt the circuit into two components, one containing resistors R1 to Ri and the other containing Ri+1 to RN. Then, we can compute the equivalent resistances for these two parts.

Then,
Eliminating ,

Parallel Configuration
Now consider another auxiliary problem of two slabs, of surface areas A1 and A2, equal thickness l and thermal conductivities k1 and k2 connected in parallel, as depicted in Fig. 4.5. Let the ends be maintained at temperatures T0 and T1.

Figure 4.5:Slabs in parallel
The definition of the equivalent thermal resistance Req is such that
where t is the total heat flux from the left end to the right end. Next, the total heat flux is simply the sum of the individual heat fluxes across the slabs as there cannot be any accumulation of energy anywhere in the system.

The total heat flux is then

In general, if we have N thermal resistors in parallel that are of resistances R1, R2, . . . , RN,
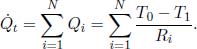
By definition of the equivalent resistance,
With these equivalent resistances, various thermal conduction problems can be solved as if they were simple circuit problems.
Incidentally, the notion of an equivalent resistance provides an alternative derivation of the thermal resistance of a cylindrical shell given by Eq. (4.6). Due to axial symmetry, the entire cylindrical shell can be divided into many shells of varying radius and infinitesimal thickness whose inner and outer surfaces individually possess uniform temperature. Furthermore, since the heat flux must be continuous across all layers, the thermal resistance of the cylindrical shell can be deemed as summing those of the infinitesimal shells in series. Lastly, because the heat flow is radial and perpendicular to each shell, the thermal resistance of a shell of radius r and thickness dr follows the format of the thermal resistance of a slab.

where the contact area in this context is now the cylindrical surface of radius r and length l, A = 2πrl. For readers who are not yet convinced that we can do this, we can further divide the shell into strips of length l, thickness dr and width rdθ (cylindrical coordinates). These strips are effectively slabs and hence have thermal resistance  . The previous shell is composed of myriad such strips placed side-by-side or connected in parallel as the heat fluxes across these strips are along different “branches” of a circuit. The effective resistance of a shell is then obtained from integrating the reciprocal of the thermal resistance of a strip
  from θ = 0 to θ = 2π and subsequently taking the inverse of this result which yields
  . With this clarification, we can proceed with determining the equivalent resistance of the entire cylindrical shell. Since the equivalent resistance of resistors in series is the sum of all the individual resistances, the equivalent resistance of the cylindrical shells at different radii is tantamount to the integral of from r0 to r1.

which is consistent with Eq. (4.6). Now, there is a pivotal warning to be made here. When we claim that a resistor is composed of different components connected in series or parallel, we must first check that the surfaces of the components are each of uniform temperature. This is because resistance is foremost, only defined for objects with surfaces of uniform temperature (e.g. the slab whose two ends have uniform, albeit different, temperatures). In the above example of a cylindrical shell, the uniform temperatures of the inner and outer surfaces of each infinitesimal shell enable us to add the infinitesimal shells in series. In general, caution must be taken in slicing a resistor into surfaces with uniform temperature if one wants to apply the technique of adding resistors.
4.3Radiation
Thermal radiation is the energy emitted in the form of electromagnetic waves. Unlike conduction and convection, these electromagnetic waves do not require any medium to propagate and in fact travel at the theoretically maximum speed. Thermal radiation is emitted by every object with a nonzero absolute temperature (i.e. measured with respect to the Kelvin scale). The Stefan-Boltzmann law states that the total heat flux density radiated by a surface across all wavelengths due to a black body can be computed as

where T is the temperature of the surface on the black body and σ is the Stefan-Boltzmann constant whose numerical value is 5.670 × 10⁻⁸ Wm–2K–4. A black body is an idealized physical entity that absorbs all incident electromagnetic radiation and emits the maximum amount of radiation for a given temperature and surface area.
For realistic bodies, the heat flux density radiated from a surface is less than that of a black body and is calculated as

where 0 ≤ ε ≤ 1 is known as the emissivity of the body. It measures the ability of a body to emit thermal radiation in comparison to a black body counterpart. Next, the luminosity L of a body is defined to be the total power emitted via radiation by a body. For a body with a uniform surface temperature T, it is simply multiplied by the exposed surface area A of the body.

4.3.1Wien’s Displacement Law
In general, each wavelength of light contributes a different proportion to the total power radiated by a black body. Wien’s displacement law relates the peak wavelength, which makes the largest contribution to this radiated power, to the temperature of the black body.

where b is Wien’s constant which has a numerical value 2.898 × 10⁻³ mK. The inversely proportional nature of temperature relative to the peak wavelength provides a rough explanation of why blue stars are actually hotter than red stars.
4.3.2Radiation at a Surface
In general, when radiation strikes a surface, a fraction of it may be absorbed, reflected or transmitted in accordance with the absorptivity (α), reflectivity (ρ) and transmissivity (t) of the surface. Since these are the only effects possible, the sum of these coefficients should be unity.

For a black body, α = 1, ρ = 0 and t = 0. That is, a black body is a perfect absorber as well. In general, these coefficients are dependent on the wavelength of radiation and the temperature of the surface. However, due to the prevalent insensitivity of these coefficients to temperature and wavelength variations in real materials, the absorptivity, reflectivity and transmissivity are assumed to be uniform across all wavelengths and temperatures. Such an ideal object is known as a gray body. Finally, it may be helpful to note that in some cases, the surfaces are thick enough such that they can be assumed to be opaque — causing t = 0 and further simplifying the set-up.
Kirchhoff’s Law of Radiation
Kirchhoff’s law states that the absorptivity and emissivity of a gray body are equal1 when the body is at thermodynamic equilibrium with its surroundings.

That is, a good emitter is also a good absorber. Kirchhoff’s law can be proven by leveraging the impossibility of heat transfer between two bodies which are at the same temperature. Consider an arbitrary gray body of an arbitrary shape and size, with an absorptivity α and emissivity ε. Now, imagine enclosing this body with a slightly larger black body replica of a similar shape and size. The arbitrary body and the black body are both at temperature T and both have surface area A. Evidently, all radiation that is emitted by the arbitrary body impinges on the surface of the black body. The luminosity of the arbitrary body is εσAT4. The power it absorbs, due to the radiation by the black body, is ασAT4. As there can be no net heat flux between these two bodies, these expressions must be equal.

Even though we have considered a particular set-up in our proof of Kirchhoff’s law, the absorptivity and emissivity of a gray body are properties that are independent of the external environment and hence identical across all types of surroundings. Furthermore, since α and ε are uniform for a gray body across all wavelengths and temperature by proposition, Kirchhoff’s law of radiation is often applied, even in the case where the gray body has not attained thermodynamic equilibrium with its surroundings. That is, α = ε is assumed to hold in all cases for a gray body.
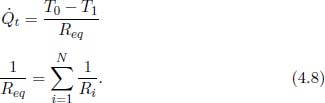
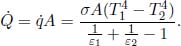
Problem: Two large, thin plates of area A are oriented parallel to each other in a vacuum in Fig. 4.6. The left plate is a black body while the right plate is an opaque gray body with an emissivity ε. If the left plate is maintained at a temperature T1, determine the equilibrium temperature of the right plate T2. Note that each plate has two surfaces.

Figure 4.6:Radiating plates
The incident power on the right plate, due to the left, is  . By Kirchhoff’s law,
  amount of power is absorbed by the right plate and
  amount of power is reflected back to the left plate. Next, the right plate also emits
  amount of power on each side. Therefore, the net heat flux between the left and right plates is
  . For the right plate to be at equilibrium, this must also be equal to the heat flux on its right side,
  . Therefore,
Notice that in the above example, we imposed the condition that the heat flux must be continuous instead of enforcing the fact that the power emitted by the second plate must equal the power absorbed. Both methods will work fine but the former is often simpler and less messy in more complicated set-ups.
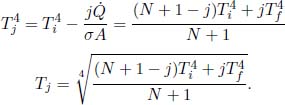
Problem: Two large black plates of area A are oriented parallel to each other and are maintained at temperatures Ti and Tf. Now, if N identical black plates are slotted between them — numbered from 1 to N from left to right, with the first plate being the closest to the plate with temperature Ti — determine the net heat flux transferred between adjacent plates at steady state and the temperature of the jth plate in the N intermediate plates.
Let be the common net heat flux between adjacent plates, positive rightwards. By the continuity of heat flux,

Summing all of the above equations,

From the previous series of equations, we have the “arithmetic progression”

with T0 being Ti. Therefore,
View Factor
In the previous problems, the emitted radiation by a plate, in the direction of another, was completely projected on the other plate. However, this is not necessarily true in general. Consider the case where there are two radiating bodies, A and B, at temperatures T0 and T1. They possess surface areas AA and AB respectively. Each body emits thermal radiation and also receives thermal radiation from the other body. The view factor, FAB, is defined as the fraction of radiation emitted by A that strikes the surface of B (note that this is not the fraction absorbed by B and that radiation reflected by A is not counted). The view factor is a purely geometric property that is dependent on many factors such as the orientations of the bodies. The reciprocity theorem states that

This can be proven, again, by imposing the condition that there cannot be a net heat flux between two objects of the same temperature. Suppose that A and B were black bodies at the same temperature T, such that there is no reflected radiation. Then, the power incident on B due to radiation by A is FBAσAAT4. Similarly, the power incident on A due to B is FBAσABT4. For the net heat flux to be zero, these quantities must be equal — implying that
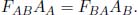
Since the view factors and surface areas are purely geometric properties, the above result must hold for non-black bodies as well — hence proving the reciprocity theorem.
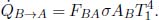
Moving on, we wish to compute the net heat flux between A and B in general. We first start off with the simplest case where A and B are both black bodies. The amount of power absorbed by B due to the thermal radiation by A is

Similarly, the amount of power absorbed by A due to B is
The net heat flux between A and B is

Employing the reciprocity theorem,

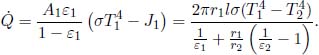
Proceeding with a new set-up, consider the special case where A is a small object with emissivity εA in a room whose surrounding temperature is T1. B in this case is the surroundings of A and acts as a black body such that εB = 1. The general system of a gray body A and black body B cannot be solved with just their view factors as FAB is not generally representative of the radiation reflected from the surface of the gray body that is incident on the black body. One would expect the distribution of reflected light to differ from that of light emitted by A. However, in this case, we know that both the emitted and reflected forms of radiation by A are completely received by B due to its all-encapsulating nature — we can thus circumvent this loophole. The power emitted by B and incident on A is

 amount of power is absorbed by A and the rest is reflected back to B. The surface area AB of the surroundings is not well-defined at the moment but we will apply the reciprocity theorem later to circumvent this muddy point. Moving on, the power emitted by A and absorbed by B is
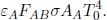
The net heat flux between the object and its surroundings is

Applying the reciprocity theorem yields

since FAB = 1 as the surroundings B receives all radiation by A. This is an extremely useful result that is expressed solely in terms of the properties of object A.
Problem: A spherical black body of absolute temperature T0 and radius r is covered by a thin, concentric, and black spherical shell of radius R. Let the temperature of the surroundings far away be T2. What is the equilibrium temperature of the shell, T1?
The view factor of the sphere to the shell is 1 since all radiation emitted from the sphere reaches the shell. The net heat flux from the sphere to the shell, , is then given by Eq. (4.15) as
The net heat flux from the shell to the surroundings, ′ is

by Eq. (4.15) again as the view factor of the shell to the surroundings is also 1. Lastly, for the shell to be at equilibrium, the heat fluxes must be equal.

Solving,

4.3.3System of Gray Bodies
Having discussed a few special systems, this section will try to analyze a more general system of gray bodies. But first, we define the following quantities for the sake of convenience. The radial exitance M of an object is the total power emitted by the surface of an object per unit area. We emphasize the fact that this is the power emitted which implies that reflected radiation is not counted. The irradiance E on an object is the total power incident (not absorbed by!) on the surface of an object per unit area. Finally, the radiosity J of an object is the total power leaving the surface of an object per unit area. Power emitted, reflected and transmitted by a surface all contribute to the radiosity.
In a system of gray bodies, radiation may be reflected back and forth between gray bodies. Then, relevant quantities such as the net heat flux between two bodies may be determined by summing an infinite series, or better yet, by solving simultaneous equations involving the quantities we have just defined. Consider the following problem.
Problem: Two large opaque plates with area A and emissivities ε1 and ε2 are parallel to each other. If the two plates are maintained at temperatures T1 and T2 respectively, determine the net heat flux between them.
By Kirchhoff’s law, the absorptivities of the two plates are ε1 and ε2 respectively. Observe that when plate 1 emits a certain amount of exitance M1, a fraction ε2 of it is absorbed by plate 2 and the rest is reflected back to plate 1. Plate 1 then absorbs a fraction ε1 of the power again and reflects the rest and so on. A similar process occurs for the exitance emitted by plate 2. The net power per unit area emitted from plate 1, in the direction of the plate 2, is then

where the negative terms involving M1 are due to the reflected portions of M1 that plate 1 absorbs back and the negative terms involving M2 stem from plate 1 absorbing part of the radiation emitted by plate 2. The heat flux between the two plates is then the above multiplied by the area of plate 1.

Substituting  and
and  ,
,

A more elegant method employs the definition of irradiance and radiosity. The radiosity J of each plate, in the direction towards the other, is only the sum of its radial exitance M and the reflected power per unit area as the opaque plates do not transmit any power. The reflected power per unit area of a plate is simply one minus its absorptivity (which is equal to its emissivity) multiplied by the irradiance on the plate E.

However, we know that the irradiance on a particular plate is simply the radiosity of the other plate. Then,

Solving these equations simultaneously would yield

The net heat flux density emanating from plate 1, in the direction towards plate 2, is the radiosity of plate 1 minus the irradiance on plate 1 which is the radiosity of the plate 2. Thus,

The net heat flux between the plates is then the net heat flux density from plate 1 multiplied by the area of plate 1 as all of the net heat flux density emerging from plate 1 is incident on plate 2.
Opaque gray Systems with Partial Capturing of Radiosity
In the previous problem, the radiosity of a plate completely impinged on the other. However, the irradiance on a component in a system due to another component is only a portion of the latter’s radiosity in general due to the relative orientations of the components. In an attempt to rectify this, one might immediately think of the view factor Fji which was defined as the fraction of radiation emitted by a component j that is projected on another component i. However, we cannot directly say that the irradiance on component i due to component j is  where Jj is the radiosity of component j. This is due to the fact that the direction of reflected light from component j will most probably be different from that of its emitted light (whose direction is arbitrary). However, if we assume that reflections off component j are diffuse — such that light is scattered off the surface of component j haphazardly — we can indeed say that the irradiance on component i due to component j is This assumption of diffuse reflections is very common.
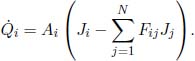
Now, consider a system of N opaque components with the ith component possessing a surface area Ai, radiosity Jj, emissivity εi and exitance Mi. The irradiance on component i is  . Then, the various Ji’s can be related by

The summation includes component i, as in general, a portion of its own radiosity may be incident on itself. By the reciprocity relation of view factors,

Therefore,

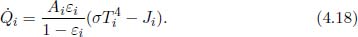
Following from this, we have a system of N variables (the various Ji’s) and N equations. Therefore, the radiosity of each surface can be solved for, in principle. Afterwards, we can compute the net heat flux (i (defined to be positive when emitted) emanating from component i by taking the product of its area Ai and by its radiosity subtracted by the total irradiance on it.
This can be further simplified by employing Eq. (4.17).

Substituting  where Ti is the temperature of the ith surface,
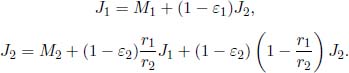
Problem: Two long concentric cylinders of radii r1 and r2, with r1 < r2 and emissivities ε1 and ε2, are maintained at temperatures T1 and T2 respectively. Determine the net heat flux between the cylinders if they have length l. Ignore any edge effects and assume that reflections off the cylinders are diffuse.
Let the exitances and radiosities of the cylinders be M1, M2, J1 and J2 respectively. Then,
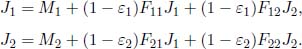
Evidently, all radiation emitted by cylinder 1 is received by cylinder 2. Then, F12 = 1 and F11 = 0. By the reciprocity theorem,

as the leftover radiosity from the larger cylinder that is not incident on the smaller one must be redirected to itself. Substituting these values into the radiosities,
Solving these (with  and
and  ) would yield

Finally, the net heat flux between the cylinders is also the net heat flux emanating from cylinder 1.
4.4Thermal Expansion
Objects usually expand when heated because their molecules vibrate and move about faster, causing intermolecular distances to increase. Similarly, objects usually contract when cooled. Empirically, it is found that for small changes in temperature, the fractional change in length along a single dimen sion is proportional to the change in temperature.

where ΔL is the change in length and L0 is the original length before the temperature change. α is known as the coefficient of linear expansion which varies across different objects and ΔT refers to the change in temperature of the object (usually in Kelvins or degree Celsius). This equation is valid for small fractional changes,  . An equivalent form of the above equation is

where L is the final length of the object.2 Similarly, we can define the coefficient of expansion for area and volume.
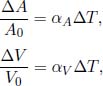
where A and V refer to area and volume respectively.

For objects that expands isotropically (the same percentage in all directions) and for small fractional changes,


To show these, let the initial lengths of an object along three perpendicular directions be x1, y1 and z1 respectively. Let the final lengths be x2, y2 and z2. We only consider the lengths in the x and y-directions in the case of area for the sake of illustration. For an isotropic expansion,

where x, y and z are the object’s dimensions. Therefore,

where second order and above terms in αΔT have been discarded. Comparing the different expressions for  and
and  , it can be seen that

Problem: Find the mean radius of curvature r when an initially straight bimetallic strip consisting of two metal strips, with coefficients of linear expansion α1 and α2 (α2 > α1) and a small common thickness x, is heated such that its temperature increases by ΔT.
Let the initial length of the bimetallic strip be L0. Let the final length of the strips with coefficients of α1 and α2 be L1 and L2 respectively. Then,
Evidently, the first strip should occupy the inner part of the arc while the second strip occupies the outer part. The mean radius of curvature is the distance between the interface of the two strips and the center of the circle. If the arc produced by the bimetallic strip subtends an angle θ,

Then,

Problem: A straight line is drawn using a marker on a uniform circular plate. It takes the form of a chord that lies a perpendicular distance h from the center of the circle. If the coefficient of linear expansion of the plate is α, determine the final shape of the line after the plate is heated such that its temperature is increased by ΔT. The expansion of the plate is isotropic. Tom claims that the line will now be bent. Is he correct?
Intuitively, an isotropic expansion is akin to us taking a photo of the plate and then enlarging the image. Therefore, we would expect that the final line takes the form of a chord that lies a perpendicular distance (1 + αΔT)h from the center of the circle and that Tom is wrong. If one is not satisfied with this argument, one can consider the following more quantitative proof. Define the origin at the center of the circle, x-axis to be parallel to the chord and the y-axis to be perpendicular to the chord. Define θ to be the clockwise angular coordinate of a point on the line from the y-axis. The radial coordinate of a point on the initial straight line as a function of θ, r(θ), is

The new radial coordinate of a point on the line as a function of θ, r′(θ), after the isotropic expansion is simply r(θ) scaled by a factor of (1 + αΔT) as the circular disk is stretched radially.
This equation takes the same form as the previous equation, except that h is replaced by h(1 + αΔT). Therefore, the new curve represents a chord that lies a perpendicular distance h(1 + αΔT) from the center of the circle.
4.5Phase Transitions
A phase is defined as a physically distinct state of matter that is homogeneous. Common phases3 include the solid, liquid and vapour (gaseous) phase. The process involving a pure substance — whose chemical composition is uniform across all molecules — that evolves from one phase to another is known as a phase transition. Consider the following phase transitions of water.
When a block of ice is heated at atmospheric pressure, one would find that its temperature rises until its melting point. At this juncture, ice begins to melt into water. However, the temperatures of ice and water stagnate at the melting point, though heat is continuously supplied, until the ice completely melts. Similarly, heating the water further would increase its temperature until its boiling point, at which water begins its transition to its vapour state (steam). Again, the heat supplied during this transition is not embodied as rises in the temperatures of the water and steam, until all water has boiled off. Afterwards, the temperature of steam continues to increase as it absorbs more heat.
There is a common trend where the temperature of a substance remains constant during such phase transitions. There must be some explanation for this seemingly missing heat that is not manifested as an increase in temperature of the substance. We name the dormant heat supplied to facilitate solid-liquid and liquid-gas transitions the latent heats of fusion and vaporization respectively.
To understand why a latent heat is necessary, we consider the first law of thermodynamics. During a phase transition, there is a change in the potential energy of the substance. During melting, the substance is transformed from an ordered lattice into a disordered liquid whose particles are further apart. Energy is required for the molecules to overcome the attractive bonding between them so that they can escape from their rigid structure. From another perspective of energy, the potential energy in a liquid is larger than that in a solid (less negative as the potential energy between two molecules is usually negative due to the attractive nature of their interactions) as molecules are further apart. In a similar vein, vapor molecules are essentially liberated during boiling and the intermolecular forces between them become negligible. Energy is required to help them overcome the attractive bonding in the liquid state. The potential energy of a vapor is virtually zero and, thus, is larger than the potential energy of a liquid.
Besides a change in potential energy, work is also performed by the substance during a phase transition between solid, liquid and vapor phases due to discontinuities in densities. Specifically, work must be performed by the substance in overcoming the external pressure when expanding or contracting during a phase transition.
Therefore, latent heat plays the roles of changing the microscopic potential energy of a substance and enabling it to perform work as it changes phase. Since the potential energy and volume changes of a liquid-vapor transition often outstrip those of a solid-liquid transition, the latent heat of vaporization is much larger than the latent heat of fusion. Moreover, the latent heat supplied does not lead to an increase in the microscopic kinetic energy of the substance — implying that its temperature remains constant.
Quantitatively, it is convenient to define the specific latent heat of fusion and vaporization, which is the latent heat per unit mass of substance, as the latent heat required to completely boil or melt a substance often scales with mass. In general, we define L as the specific latent heat of a substance during a particular phase transition. L is different for different states at which phase transition occurs as the work done by the substance varies. The amount of heat, Q, that needs to be supplied to facilitate the particular phase transition of mass m of a substance from a phase of lower internal energy to one of higher internal energy is

Since a phase transition is an internally reversible process as the different phases must coexist at the same temperature (such that there is no heat transfer between constituents of different temperatures),
where T is the temperature at which the phase transition occurs and Δs is the entropy change per unit mass of the substance (specific entropy change), in completely converting from one state to another. Then,

where the phase with a larger internal energy also possesses greater entropy.
4.5.1Phase Diagrams
To visualize the phases of a substance at different equilibrium states, a phase diagram can be drawn. Each state of a substance can be ascribed a unique pressure, volume and temperature, which are in fact connected by an equation of state (such as the ideal gas law in the case of ideal gases). Therefore, only two properties are needed to specify a state of a system. In light of this clarification, a phase diagram is usually plotted as a pressure-temperature diagram, exemplified by Fig. 4.7.

Figure 4.7:Phase diagram of common substances
The experimental phase diagram of a typical substance4 is depicted above. There are three lines that demarcate boundaries between phases in the P-T diagram. These lines are the respective coexistence lines where different phases of the substance can coexist at a single equilibrium pressure and temperature. A phase transition occurs when the state of the substance is on a coexistence line (as one phase is progressively converted to another) and is completed when the state crosses over this line. To navigate over a coexistence line from a phase with lower internal energy to one with higher internal energy, a latent heat needs to be supplied to the substance — this latent heat is dependent on the point on the coexistence line and the direction in which the state of the substance traverses. On another note, an interesting observation is that the substance can actually directly transition from a solid to vapor without passing by the liquid state at low pressures. Such a phase transition is known as sublimation and the reverse process is known as deposition.
At low temperatures and high pressures, the substance takes the form of a solid as expected. At high temperatures and low pressures, the substance is a vapor. At intermediate temperatures and pressures, the substance is a liquid.
There are a few interesting properties of the phase diagram. Firstly, there is a single temperature and pressure at which the three phases can coexist — this is known as the triple point. At pressures below that at the triple point, the substance can sublime. Furthermore, the pressure at the triple point is the lowest pressure at which a liquid can exist for all substances while the temperature at the triple point is the lowest temperature at which a liquid can exist for typical substances (not water).
Problem: Determine the specific latent heat of sublimation Ls at the triple point if the specific latent heats of fusion and vaporization are Lf and Lv at the triple point respectively.
Let the specific entropies of the solid, liquid and vapor states of the substance at the triple point be ss, sl and sv respectively. Let the temperature at the triple point be T. Then,

Moving on, interesting observations regarding the coexistence lines can be made. The solid-vapor line originates at absolute zero (0 K) and zero pressure and ends at the triple point. The solid-liquid line extends from the triple point to infinity. However, the liquid-vapor line starts from the triple point and terminates at a certain juncture! This state is known as the critical point and the temperature and pressure at this point are termed the critical temperature Tc and the critical pressure pc respectively.
So what actually occurs in the supercritical region, at states with temperatures and pressures larger than the corresponding critical values? The liquid and vapor phases become indistinguishable and the substance morphs into a homogeneous fluid (which is neither liquid or gaseous and is simply referred to as a fluid). Surface tension vanishes such that the meniscus dividing the two phases disappears. The density of the substance also evolves continuously — a stark contrast with the previously discontinuous densities of the liquid and gaseous states. Therefore, if you change the state of a substance from the liquid region to the supercritical region and back to the vapor region, you won’t actually observe a phase transition! These properties are rather counter-intuitive as the supercritical region is rather exotic. For example, the critical pressure of water is roughly 218 atm which is enormous and hard to achieve.
To better illustrate the prevalent abrupt jump in density during a liquid-vapor phase change and the seamless transition in the supercritical region, consider the temperature against volume graphs of a pure substance heated at constant pressure from a liquid state, for different values of pressure in Fig. 4.8. Note that we usually analyze heating at constant pressure as it is a decent representation of the processes on Earth which are commonly conducted under atmospheric pressure.
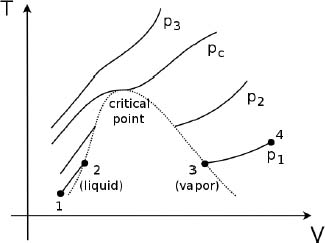
Figure 4.8:Isobars on T-V diagram
Let us focus on the curve describing the particular pressure p1 (which is the smallest out of all the pressures that we will consider and is smaller than the critical pressure pc) which is reflected by the bottom-most graph. As the liquid is heated, its temperature and volume increase from state 1 to state 2. At this juncture, the graph becomes disjoint between segments 12 and 34. The substance attains an equilibrium state where its liquid and vapor phases, which respectively correspond to states 2 and 3, coexist with different volumes. Collectively, this pair of disjoint points correspond to a single point on the liquid-vapor coexistence line on the P-T diagram and thus have the same temperature. The coexistence of phases will persist until sufficient heat (commensurate with the latent heat of vaporization at constant pressure p1) is supplied to completely vaporize the substance. To visualize this on the above diagram, we can instead define V as the average volume of the substance such that V increases from state 2 (where the substance is completely liquid) to state 3 (where the substance is completely vapor) along a horizontal line. Subsequent heating beyond this point would cause the temperature and volume of the vapor to increase indefinitely (e.g. from states 3 to 4).
At a slightly larger pressure p2 > p1, which is still smaller than pc, a similar trend of discontinuous lines occurs. However, the graph is shifted upwards and the horizontal gap between the disjoint points is reduced. Plotting the locus of the pairs of disjoint points at different pressures, we obtain the bellshaped curve depicted in dotted lines. The portion on the left of the peak corresponds to the liquid phases while that on the right corresponds to the vapor phases when the two phases coexist. Notice that there is a certain minimum pressure (defined as the critical pressure pc) where the states of the substance is a continuous curve — its point of inflexion produces the peak of the bell-shaped curve. That is, at this pressure, the supposedly disjoint pair of points converge to form a single point which is a point of inflexion. At pressures above pc, such as p3 > pc, the states of the substance during heating under constant pressure is a continuous curve such that there is no volume discontinuity as the liquid and vapor phases become indistinguishable and an “integrated fluid.”
The above analysis suggests that if we are given an equation of state that models the liquid or vapor phases of a substance, we can determine the critical pressure pc by finding the pressure that produces a point of inflexion on the T-V diagram when the substance is heated or cooled at constant pressure. Afterwards, the critical temperature Tc can also be determined.
Problem: In light of the ineptness of the ideal gas law in describing phase transitions, the van der Waals model was developed and proposes that the equation of state of a real gas is
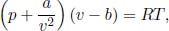
where p and T are the pressure and temperature of the gas and v is the volume of the gas per unit mole. a and b are known constants. Determine the critical pressure and temperature predicted by this model.
To determine the pressure p at which there is a point of inflexion in the T-V diagram when the gas is cooled under constant pressure, we need to determine

where the subscript p underscores the fact that we treat p as a constant in computing the partial derivative. Since the number of moles n is fixed and V = nv, the above is equivalent to finding

From the van der Waals equation of state,

From the second equation, we obtain the specific molar volume at this juncture.

Substituting this into the first equation, the critical pressure is

Finally, substituting pc and v into the equation of state, the critical temperature is

4.5.2Coexistence of Phases
This section will analyze the coexistence lines in greater detail. As an introduction, consider a closed system containing the liquid and vapor phases of a substance that has not yet established an equilibrium.
If the pressure on the liquid due to the vapor is too low, liquid molecules will escape the liquid (evaporate) at a greater rate than gas molecules entering the liquid (condensing). Thus, the liquid will vaporize to produce more gas molecules — causing the vapor pressure to increase. Conversely, if the vapor pressure is too high, there will be a net influx of molecules into the liquid — condensing the gas and reducing the vapor pressure.
Therefore, there is a tendency for the system to equilibrate until there is no net exchange of molecules between the phases. A dynamic equilibrium is established such that the rate of molecules evaporating from the liquid phase is equal to the rate of molecules condensing from the vapor phase. When such an equilibrium has been established, the liquid and vapor are referred to as a saturated liquid and vapor respectively. The vapor pressure at this juncture, for a given common temperature T between the liquid and vapor, is known as the saturated vapor pressure ps(T). Similarly, the common temperature, for a given vapor pressure p, is known as the saturation temperature Ts(p). The liquid-gas coexistence line represents the saturation pressure at various temperatures or equivalently, the saturation temperature at various pressures. Observe from the coexistence line that in general, there is a one-to-one mapping between the equilibrium pressure and temperature when two or more phases coexist. Therefore, in a certain sense, there is only a single independent variable when phases coexist.
In light of the above discussion, another important point to understand is that a substance generally does not exist as a purely liquid or a purely vapor phase at equilibrium due to evaporation and condensation. Evaporation always occurs, because the energy distribution of surface molecules in a liquid is Boltzmann-like such that some highly energetic molecules will definitely leave the liquid over time. Therefore, a purely liquid phase cannot be at equilibrium. However, there is still a slight chance for a purely vapor phase to attain an equilibrium as a vapor will in fact not condense in empty space to form small droplets. This is because, when a liquid phase has yet to form, the intermolecular forces are too weak to cause molecules to congregate together to produce a liquid. From the perspective of energy, the molecules need to provide the surface energy required to build the liquid surface — a difficult barrier to overcome. A nucleation center, such as a dust particle, is in fact required to keep the molecules together and to spark off condensation. It reduces the interface of the liquid with its vapor (as part of the surface is stuck to the nucleation center) such that the energy barrier is lowered. Therefore, in the case of extremely clean vapors, it is possible for them to attain an equilibrium. Such vapors which exist in the vapor region of the phase diagram and lie outside of the coexistence lines are known as supersaturated vapors. They exist in a state of unstable equilibrium as the presence of a nucleation center will immediately trigger condensation.
Clausius–Clapeyron Equation
The equation of a coexistence line p(T) is modeled by the Clausius–Clapeyron equation which states that

where L is the specific latent heat during the transition at the current state (T, p) on the coexistence line and Δv is the specific change in volume (volume change per unit mass) across the two phases, from one of lower internal energy to one of higher internal energy, at the particular (T, p) state.
Proof: There is a delightful proof of the Clausius–Clapeyron equation that is based on conjuring a hypothetical reversible heat engine, that utilizes two coexisting phases of a pure substance as its working substance, and imposing the efficiency of a reversible heat engine dictated by the second law of thermodynamics.
For purposes of illustration, let our working substance be a combination of a saturated liquid and vapor stored in a container (this proof also works for other coexisting phases). Now, consider the following four processes of an infinitesimal Carnot cycle performed by this working substance.
(1)The working substance is expanded isothermally at temperature T when it is put in thermal contact with a reservoir of temperature T. Mass m of the liquid is vaporized in this process such that the total volume per unit mass of the working substance changes from v1 to v2. Since this change in total volume is much steeper than the change in pressure of the working substance (this extends to all pairs of coexisting phases as well but holds especially in the case where one phase is a vapour), in the limit where v2 – v1  v1, this process on the PV diagram of the working substance is approximately depicted by a straight line at a constant pressure p.
(2)The working substance is expanded adiabatically such that its temperature and pressure decrease to (T + dT) and (p + dp) respectively, where dT < 0 and dp < 0.
(3)The working substance is compressed isothermally at temperature (T + dT) when it is put in thermal contact with a reservoir of temperature (T + dT). Mass m of the vapour is condensed in this process. Again, the pressure of this process is constant at (p + dp).
(4)Finally, the working substance is compressed adiabatically such that its pressure and temperature reverts from (p + dp), (T + dT) to p, T.
Since the graph depicting this cycle on a PV diagram is approximately a parallelogram with edge length m(v2 – v1) = mΔv and height –dp, the work done by this infinitesimal Carnot cycle is –mΔvdp. Furthermore, the working substance only receives heat during the first process which is of amount mL where L is the specific latent heat of vaporisation. Consequently, the efficiency of this cycle is
As all processes are reversible, this must be equal to the Carnot efficiency  .
.

Scrutinizing the Clausius–Clapeyron equation, one can see that the gradients of the coexistence lines are usually positive as Δv is positive for most transitions. Furthermore, the solid-liquid coexistence line should be extremely steep at Δv is small. That said, water is an anomaly as the density of ice is actually smaller than that of water — causing Δv to be negative. Then, the solid-liquid line for water has a steep, negative gradient.
Unfortunately, the Clausius–Clapeyron equation is hard to solve for in general as L and Δv are both functions of state that are difficult to model. For example, L for a liquid-gas transition decreases as temperature increases, attaining zero at the critical temperature and causing the liquid-gas line to terminate.
However, we can determine approximate solutions for solid-gas and liquid-gas transitions at temperatures much lower than Tc for a small temperature change. The specific latent heat L remains approximately constant and Δv can be taken to be the specific volume of the gaseous state, vg, which is much larger than the specific volumes of the other phases. Then,

Assuming that the ideal gas law holds,

where μ is the molar mass of the gas molecules. Then,

where (T0, p0) is a reference point on the coexistence line.
4.5.3Mixture of Gases
In this section, we will study the coexistence of the liquid and vapor phases of a substance when its vapor phase is mixed with a disparate gas. This is a ubiquitous phenomenon as Earth is brimming with air (which is a mixture of different gases) that envelopes all other substances. First and foremost, a pivotal assumption regarding gas mixtures is the Dalton model. It states that the total pressure p of a mixture of N gases that occupy a certain volume at thermal equilibrium is simply the sum of the individual pressures, referred to as the partial pressures pi, that each gas would have caused in that volume.

where pi is the partial pressure of the ith gas. This relationship is evident from the kinetic theory of gases as the different gases would simply engender their own pressures if they do not interact with each other. That is, the Dalton model is simply stating that each gas operates as if it is the only gas in that particular volume and is unaffected by the presence of other gases (assuming that there are no interactions). The partial pressure pi can be expressed as a fraction of p via the ideal gas law. If there are ni moles of the ith gas occupying the common volume V at temperature T,

for all 1 ≤ i ≤ N. Summing the above for all i,

where

is the total number of moles of gas molecules. Dividing the ideal gas law of the ith gas by the previous equation,

That is, the partial pressure generated by the ith gas is simply its mole fraction relative to the entire mixture multiplied by the total pressure.
Next, we proceed with our main topic — analyzing the coexistence of the liquid phase of a substance with a mixture of gases at equilibrium. For the sake of illustration, consider a set-up involving liquid water and its vapor (water vapor) mixed with atmospheric air. Since atmospheric air normally contains a portion of water vapor, we shall explicitly exclude this component in referring to air and instead, treat it as part of the vapor. Air, with water vapor removed from its constituents, is often referred to as dry air. Now, there are two common assumptions made in this context. Firstly, the coexistence of liquid water and its vapor is presumed to be unaffected by the presence of dry air. That is, when a dynamic equilibrium has been established such that the amount of liquid water remains constant, the partial pressure of water vapor must be the saturated vapor pressure corresponding to temperature of the mixture T, ps(T). Secondly, the experiment is often conducted at constant pressure, which is atmospheric pressure p0, such that the sum of the partial pressures of water vapor and dry air must be equal to p0 at all instances.
Let us first consider a set-up where the liquid phase has yet to form — there is solely a mixture of supersaturated water vapor and dry air in a container. Now, as this mixture is cooled at constant pressure, the partial pressure of water vapor remains constant as its mole fraction relative to the mixture remains constant. Eventually, the mixture attains a temperature at which water vapor first begins to condense — this temperature is known as the dew point. In other words, the dew point of a mixture of water vapor and air is the temperature at which liquid water first begins to form when the mixture is cooled at constant pressure. Since the partial pressure pw of water vapor remains constant during this process, the dew point is simply the saturation temperature Ts(pw) of water vapor at that constant partial pressure pw.
The above discussion implies that we need to know the partial pressure of water vapor pw in order to calculate the dew point. However, a more common measure which enables the indirect calculation of pw is the relative humidity ϕ of an air-water vapor mixture. Firstly, an air-water vapor mixture is defined to be saturated when a dynamic equilibrium has been established between the water vapor and liquid water (i.e. the state of water is on the liquid-vapor coexistence line). The relative humidity is then defined as the ratio of the mole fraction of water vapor in the current mixture to the mole fraction of water vapor in a saturated mixture at the same temperature and total pressure. This is equivalent to the ratio of the partial pressure of water vapor in the current mixture pw to the saturation pressure of water vapor at the same temperature ps(T).

Problem: Determine the dew point of a mixture of dry air and water vapor with relative humidity ϕ and current temperature T0. Suppose that you have a P-T graph of the liquid-vapor coexistence line of water.
Firstly, we need to compute the partial pressure of water vapor in the mixture which is
ps(T0) can be determined from the P-T graph by drawing a vertical line at T-coordinate T0 and finding the pressure of the point of intersection of this line and the liquid-vapor coexistence line of water. Moving on, the dew point is the saturation temperature Ts(pw) at vapor pressure pw. This can be identified by drawing a horizontal line on the P-T diagram at P-coordinate pw and finding the temperature of the point of intersection of this line and the liquid-vapor coexistence line.
Next, what occurs if we continue to cool the previous mixture at constant pressure after the dew point has been reached and wait for an equilibrium to be established (assume that its final temperature is still greater than the triple point temperature)? Firstly, note that water cannot solely exist in its liquid phase at the end of this process as we have already remarked that a purely liquid phase cannot be at equilibrium. Instead of completely condensing into liquid water, what actually occurs is that water vapor partially condenses such that its partial pressure decreases as its mole fraction decreases. Its final partial pressure must correspond to the saturation pressure at the final temperature of the set-up in order for liquid water and water vapor to attain a dynamic equilibrium. Since the pressure of the mixture is immutable, this also implies that the partial pressure of air increases.
Problem: A mixture of supersaturated water vapor, with initial partial pressure pw0, and n moles of dry air molecules is cooled at constant pressure p0 from an initial temperature T0 to a smaller final temperature T1 that is below the temperature of the dew point but above the temperature of the triple point of water. Describe the evolution of the state of water during this process on a P-T diagram and determine the number of moles of water vapor Δn that is condensed. Assume that you know the saturation pressure of water vapor as a function of temperature, ps(T).
On a phase diagram, the state of water begins as a supersaturated vapor at (T0, pw0) and travels along a horizontal line (at constant partial pressure pw0) until it intersects the liquid-vapor coexistence line (the temperature at this point of intersection is the dew point). As the mixture is further cooled, the state of water travels along the coexistence line, towards decreasing temperature, until temperature T1.
The mole ratio between water vapor and air is simply the ratio between their partial pressures. Therefore, the initial number of moles of water vapor is

The final partial pressure of water vapor is the saturation pressure at temperature T1, ps(T1). Therefore, the final number of moles of water vapor is

The moles of water vapor condensed is then

Finally, let us consider the reverse process of the previous set-up. Suppose that we start with liquid water and an air-water vapor mixture and heat it at constant pressure p0. Liquid water will first begin to vaporize and increase the partial pressure of water vapor as its mole ratio increases. The equilibrium state of water initially moves along the liquid-vapor coexistence line towards increasing temperature. However, as the partial pressure of water increases, the partial pressure of air must decrease for the pressure of the mixture to remain constant. This insinuates that there is a certain limiting temperature where it is no longer possible for water to have an equilibrium state with coexisting liquid and vapor phases as the partial pressure of air decreases below zero. At this juncture, liquid water is said to boil as the bubbles formed by evaporation can no longer be restrained by the external pressure p0. Since liquid water just begins to boil when the partial pressure of air is zero and when the partial pressure of its saturated vapor in a bubble is at least as large as the external pressure for the bubble to continue expanding, the boiling temperature Tb corresponds to the temperature at which the saturation pressure of water is the constant external pressure p0.

Note that p0 refers to the atmospheric pressure patm in most situations. During boiling, like any other phase transition, the temperature of water remains constant until sufficient latent heat has been supplied to completely vaporize liquid water.
Problem: The immiscible liquid phases of two substances A and B are stored together in an open container at atmospheric pressure patm. Given their saturation pressures as functions of temperature psA(T) and psB(T), determine the condition on the temperature T at which boiling first occurs. Afterwards, explain how one can determine which substance has a higher molar rate of boiling throughout this boiling process. Assume that the heights of the liquids are small such that the pressure is uniform throughout the set-up.
Observe that at the interface between A and B, a bubble comprising the saturated vapors of both A and B can form. If we assume that Dalton’s law holds, the total pressure of the bubble is the sum of the partial pressures of the vapors of A and B. Therefore, boiling first occurs at this interface, rather than the possible interfaces of A and B with air. The boiling temperature T satisfies

To identify the substance that boils at a greater rate, observe that the temperatures of the two substances remain constant during boiling — implying that the partial pressures of their saturated vapors contained in the bubbles remain constant too as there is a one-to-one mapping between saturation pressure and temperature. Since the molar ratio of the saturated vapors of A and B contained in a bubble is equal to the ratio of their partial pressures, the substance with a higher saturation pressure at this boiling temperature T will boil at a greater molar rate, throughout the entire boiling process since this molar ratio is constant.
Problems
Conduction
1.Concentric Spheres**
Two concentric, hollow spheres have radii r1 and r2 respectively with r1 < r2. Denote their instantaneous temperatures as T1 and T2. If the space between them is filled with a material with thermal conductivity k and negligible heat capacity, determine the instantaneous heat flux between the two spheres. Using the previous result, find T1(t) and T2(t) if the heat capacities of the spheres are C1 and C2 and if their initial temperatures are T10 and T20.
2.Cylindrical Shell with Felt**
Suppose that the cylindrical shell in Section 4.2 is now covered with felt that has a uniform thermal conductivity k2 and an outer radius r2. Let the thermal conductivity of the cylindrical shell, with inner and outer radii r0 and r1, be k1. The inner surface of the cylindrical shell is maintained at T0 while the outer surface of the felt is maintained at T1 . Determine the heat flux across cylindrical layers.
3.Current in a Wire**
Consider a long cylindrical wire with a radius R and thermal conductivity k. A current runs through it such that each unit volume of the wire produces p amount of heat per unit time. If the temperature of the cylindrical surface of the wire is maintained at T0, determine the temperature distribution in the wire T(r) as a function of its radial coordinate r.
4.Conducting Gas**
n0 moles of an ideal gas fill a container of constant cross sectional area A and length l. It is known that the thermal conductivity of a section of ideal gas is proportional to the square root of its temperature  . If the ends of the container are maintained at temperatures T1 and T2 respectively, determine the pressure of the gas at steady state. Assume one-dimensional heat flow in the direction perpendicular to the cross section of the container.
5.Truncated Cone**
A truncated cone has two circular surfaces of radii r0 and r1, r0 < r1, which are maintained at temperatures T0 and T1 respectively. The perpendicular distance between these two surfaces is h. Find the heat flux in the direction of the axis. Assume that r1 – r0 h such that the half-angle of the cone is small. Where is this assumption necessary in your working?
6.Regular Polygon**
The N vertices of a homogeneous regular N-gon are maintained at temperatures T1, T2 , . . . ,TN respectively by an external agency. Determine the steady state temperature of the centroid.
7.Slabs and Gases**
Three slabs (filled with black) have thermal conductivities k1, k2 and k3, cross sectional areas A1 = A2 = A and A3 and lengths l1, l2 and l3. They are connected by tubes filled with gases (shaded gray) of heat transfer coefficient h as shown in the figure below. The cross sectional areas of the gas tubes are not given and are irrelevant. If the left end of the left slab and the right end of the right slab are maintained at temperatures T1l and T2r, determine the condition for the middle slab to have a uniform temperature at steady state.

Radiation
8.Radiation Pressure*
A small, black plate of area A is stationary at a large distance away from the Sun which is a spherical black body with radius rs, mass M and constant temperature Ts. Determine the mass of the plate, m. Neglect all other gravitational effects and assume that the surface of the plate is perpendicular to the line joining the center of the Sun to it.
9.Spherical Space Station*
A space station takes the form of a black sphere in outer space with surroundings at zero absolute temperature. Due to the operation of the space station, its internal appliances produce a certain amount of power that is conducted isotropically within the sphere. If the equilibrium temperature of the space station under such circumstances is T, determine the new equilibrium temperature T′ of the space station after a black spherical shell, of a slightly larger radius than the space station, is used to envelope the space station. What if N thin black shields are used? What if a single thin shield, made of an opaque gray material of emissivity ε, is used?
10.Transmitting Plate**
Two plates of emissivities ε1 and ε2 are oriented parallel to each other. The first plate is opaque while the second plate has a reflectivity r. If the two plates are maintained at temperatures T1 and T2 respectively, determine the heat flux transmitted across the second plate.
11.Three Gray Plates**
Two large, gray and opaque plates with emissivities ε1 and ε3 are oriented parallel to each other and are maintained at temperatures T1 and T3 respectively. Now, another plate of equal emissivity, absorptivity and transmittivity is placed between the two plates. Determine the equilibrium temperature of this plate, T2.
12.Earth’s Atmosphere***
In this problem, we will model the effect of an atmosphere on Earth. Suppose that the Sun is a black body with temperature T1 and radius r1. The Earth is a sphere that is located at a distance R from the Sun and has a radius r3. The emissivity of the Earth is ε3.
(1)If there is no atmosphere on Earth, determine the temperature of the Earth at equilibrium, T3.
(2)Now, we consider the effects of an atmosphere. Model the atmosphere as a spherical shell of gas, with an emissivity ε2 and outer radius r2 > r3, surrounding the Earth. At thermal equilibrium, its absorptivity for both ultraviolet and infrared light is ε2. The atmosphere transmits a fraction t of ultraviolet light but is completely opaque to infrared. Assuming that the Sun emits ultraviolet light while the Earth emits and re-emits infrared, determine the temperature of the atmosphere T2 and the Earth, T3, at thermodynamic equilibrium. Assume that the atmosphere is a perfect thermal conductor such that all incident radiation is instantaneously evenly distributed across it.
Thermal Expansion
13.Ring*
A flat, circular ring has an inner radius and outer radius. If the ring is now heated such that it undergoes isotropic expansion, does the area of the hole in the middle increase or decrease?
14.Spherical Balls**
Spherical ball A is hung down from a massless, inextensible string that is connected to a wall. Spherical ball B lies motionless on a horizontal floor. The same quantity of heat Q is supplied to both balls. Assuming no heat losses, are the final temperatures of the balls the same? If not, estimate the difference in the final temperatures in terms of parameters of your choice. (International Physics Olympiad)
Phase Transitions
15.Latent Heat*
Consider a container with a piston that contains a certain amount of gaseous and liquid states of the same substance. The piston is first fixed and the system is at equilibrium at temperature T. The latent heat of vaporization per mole of gas of this configuration is determined to be L. Now, consider the case where the massive piston is not fixed and is instead, balanced by the difference between the interior pressure and atmospheric pressure. The system is initially at equilibrium at temperature T. Determine the latent heat of vaporization per mole of gas of this new configuration in terms of L and T. Assume that the gaseous form of the substance is ideal and attains thermodynamic equilibrium at every instance.
16.Gas in Rocket*
A motionless cylindrical vessel of cross sectional area A in outer space initially contains an ideal gas of total mass M and initial pressure p ps where ps is the saturation pressure at its current temperature (which is above the triple point temperature but below the critical temperature). The vessel is then given a constant acceleration a along its cylindrical axis while its temperature is maintained. Determine the mass of liquid m formed by condensation due to this motion after the system has equilibrated. Hint: you have to consider different regimes of a.
17.Melting Ice**
1kg of ice at 0°C floats in 5kg of water at 50°C. The whole system is thermally isolated. Determine the change in entropy of the whole system when thermal equilibrium has been reached. The specific heat capacity of water is 4.2kJkg–1K–1 and the latent heat of fusion of ice is 333kJkg–1.
18.Boiling Point**
Model the atmosphere as a spherical shell of uniform gas with molar mass μ and uniform temperature Ta that envelopes the spherical, uniform Earth. If the atmospheric pressure and boiling point of water at the surface of the Earth is p0 and T0 respectively, determine the boiling point of water at a small height z from the surface of the Earth. Assume that the latent heat of vaporization is a constant L in this regime and that the specific volume of water vapor is much larger than that of water.
19.Heating a Container**
A closed container of constant volume currently contains certain amount of gaseous and liquid states of the same substance at equilibrium. If the current temperature of the system is T and the specific latent heat of vaporization in the current state is L, determine the fractional change in the moles of gaseous molecules due to evaporation if the equilibrium temperature of the system is slightly increased by ΔT T. The specific volume of the gas can be assumed to be much greater than that of the liquid. The gas molecules have molar mass μ.
Solutions
1.Concentric Spheres**
Similar to the case of a cylindrical shell, the isotropic nature of the set-up implies that the heat flux is purely radial. Let the heat flux between adjacent spherical shells be (positive towards the outer shells). Then, consider the heat flux across a spherical shell of radius r.

Since is uniform throughout all spherical shells (as the material cannot absorb any heat else it will experience an infinite temperature change),

Another method is to calculate the thermal resistance between the two shells as the sum of the thermal resistances of many infinitesimal shells of varying radius in series. Because the heat flux density is perpendicular at every point on a spherical shell, the thermal resistance of an infinitesimal shell of radius r and thickness dr is analogous to that of a slab,  . The total resistance between the two shells is then

so the heat flux is

In the second part of the problem, we have

where  . To decouple this pair of equations, multiply the first equation by C2 and subtract the second equation, multiplied by C1, from it.

The solution to this differential equation in variable (T1 – T2), after substituting the initial conditions, is

On the other hand, since the total internal energy of the spheres must be conserved,

Solving these equations simultaneously,

2.Cylindrical Shell with Felt**
Recall that we derived the thermal resistance of a cylindrical shell as

The shells and the felt are connected in series. Thus, the equivalent thermal resistance is

Thus, the rate of heat conduction is

3.Current in a Wire**
Consider a cylindrical shell between radii r and r + dr. The heat flux entering this shell is (r) while the heat flux emanating from it is (r + dr). Let the length of the wire be l. Then, the volume of this shell is 2πrldr which implies that the heat generated per unit time is 2πrldr. At equilibrium, the net heat flow through this shell must be equal to the heat generated.

Shifting dr to the left-hand side and applying the first principles of calculus,

Separating variables and integrating, we can determine the heat flux through a cylindrical shell between radial distances r and r + dr.

where we have used the fact that the heat flux must be zero at r = 0 as the shell at r = 0 has negligible volume and thus generates negligible heat. Now, to determine the temperature distribution, we apply Fourier’s law of conduction.

Then,

Integrating this and imposing the limit T = T0 at r = R, the temperature T(r) is

4.Conducting Gas**
At steady state, the heat flux and pressure must be continuous throughout the gas. By Fourier’s law of conduction, the heat flux across a cross section is

where the x-direction has been set to be the direction perpendicular to the cross section, pointing from the end at T1 to the end at T2. Shifting dx to the left and integrating,

Since is a constant,

To determine the temperature at a distance x from the end at temperature T1, we perform the previous integration over more general limits.

Substituting the expression for ,

Now, we need to ensure that the total number of moles is n0. We know from the ideal gas law that

where η is the molar density of molecules. Then,

Now, we need to ensure that
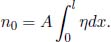
In this integration, remember that p must be uniform at steady state. Then,

Substituting 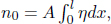

5.Truncated Cone**
Let h2 be the height of the truncated part of the cone. Let the origin be at the center of the circular surface with radius r0 and let the positive x-axis be directed perpendicular towards the other surface. We can calculate h2 by using similar triangles,

The half-angle of the cone, θ, is

Now we consider a circular surface with thickness dx that is at x-coordinate x from the origin. The radius of this circular surface is
By Fourier’s law of conduction, the heat flux through this surface is

Since the system is in thermal equilibrium, is constant.

The assumption of a small half-angle is necessary in ensuring that all circular surfaces possess uniform temperatures such that we can approximate the heat flow to be solely one-dimensional (perpendicular to the bases of the truncated cone) in the above working.
An alternative method is to deem the truncated cone as many circular disks of infinitesimal thickness dx connected in series. Firstly, the uniform temperatures of the two surfaces of each infinitesimal disk cause the resistance of an infinitesimal disk to be well-defined. Next, because the heat flux density is perpendicular at all points on each disk, the thermal resistance of an infinitesimal disk at x-coordinate x is analogous to that of a slab.
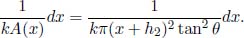
Integrating the above from x = 0 to x = h, the total thermal resistance of the truncated cone is
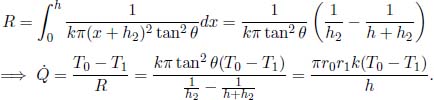
6.Regular Polygon**
Let the external power supplied to the ith vertex be i and the temperature at the centroid be Tc when an equilibrium has been established. At steady state, the net power received by the polygon must be zero. This implies that

Now, rotate the entire set-up by  radians (N – 1) times to obtain (N – 1) rotationally symmetric set-ups. Superposing these (N – 1) set-ups with the original set-up,
  power flows into each vertex to establish a vertex temperature
  and centroid temperature NTc at steady state. Since
  , no external power is delivered to any point on the polygon — implying that its temperature must be uniform at steady state. Equating the temperature of the centroid and the temperature of a vertex in this set-up,

7.Slabs and Gases**
Let the steady state temperatures of the right end of the first slab, left end of the second slab and the top and bottom ends of the third slab be T1r, T2r, T3t and T3b respectively. Furthermore, let the steady state temperatures of the gases in the top and bottom sections be Tg1 and Tg2 respectively. Drawing the thermal circuit of the set-up, we obtain Fig. 4.9.

Figure 4.9:Thermal circuit
The thermal resistance between the surface of a slab of area A′ and a gas of heat transfer coefficient h is  as Newton’s law of cooling states that = –hA′ΔT. For the temperature of the middle (third) slab to be uniform, T3t = T3b which implies that there is no heat flux in the middle branch. Then, Tg1 and Tg2 must be equal. For this to occur, the ratio between the left and right portions of the bottom and top horizontal segments must be equal (since they are connected in parallel between predetermined temperatures T1l and T2r). That is,

8.Radiation Pressure*
The luminosity of the Sun is

Let the plate be located at a distance r from the center of the Sun. The irradiance on the plate at a distance r from the center of the Sun, due to the Sun’s radiation, is

Since the plate is a black body, all incident radiation is absorbed. This implies that its absorbed power is

For a photon, its energy E is related to its momentum p by

where c is the speed of light. Since P is the average energy per photon multiplied by the rate of photons incident on the plate and because the force on the plate is the average momentum per photon multiplied by the rate of impinging photons,
This force must balance the gravitational force on the plate due to the sun.

9.Spherical Space Station*
Let the heat flux density produced by the internal appliances of the space station be . Since the original equilibrium temperature of the black space station was T, by the continuity of heat flux,

Now, observe that when a black shield is used to cover the space station, the heat flux density throughout the space station and the shield must still be by the continuity of heat flux as the internal appliances still operate in the same manner. This directly implies that the equilibrium temperature of the shield is T (as the shield is akin to the original space station) and that the shield emits an exitance (heat flux density) , both radially inwards and outwards. The space station therefore receives heat flux density from the internal appliances and heat flux density from the shield — for a total of 2 which must also be the heat flux density radiated by it at steady state. Consequently,

When N black shields are used, we can repeat the above arguments to show that the exitance of the outer-most shield is , which causes the exitance of the second outer-most shield to be 2, which causes the exitance of the third outer-most shield to be 3 and so on as the interior of a shield always transmits a heat flux density to that shield by the continuity of heat flux. The space station therefore receives heat flux density from the internal appliances and N heat flux density from the inner-most shield — for a total of (N + 1).

In the second scenario, the equilibrium temperature of the shield is not T but it still emits an exitance , both radially inwards and outwards. The space station then receives 2 from the heat produced by its internal appliances and from the exitance of the shield. However, even though the space station emits exitance σT″4 (where T″ is its equilibrium temperature), a fraction (1 – ε) is reflected back by the shield and reabsorbed by the space station. Therefore, the space station effectively only radiates a heat flux density εσT″4. Balancing the heat flux densities received by and emanating from the space station,

10.Transmitting Plate**
Let M1, Jl and M2, J2 be the exitances and radiosities of the first and second plates in the directions towards each other respectively. Then,

Note that the coefficient of J1 in the second equation is not (1 – ε2) as some radiation is transmitted as well. Solving the two equations above simultaneously,

The net heat flux from the first plate to the second is then

Part of this heat flux is transmitted and the rest is absorbed by the second plate (note that the reflected portion has already been excluded). The portion of radiation transmitted is then

where t is the transmissivity of the second plate and where we have substituted  and
and  .
.
11.Three Gray Plates**
The emissitivity, absorptivity and transmittivity of the middle plate are each  . Define J1 and J3 to be the radiosities of the first and third plate, towards the middle plate. Define J21 and J23 to be the radiosities of the middle plate in the directions of the first and third plates respectively. Finally, let M1, M2 and M3 be the respective exitances of the plates. Then,

In relating the radiosities of the middle plate, we must take extra care.
The second term J3 is the contribution to the radiosity towards the first plate, due to the transmitted radiation from the third plate. The third term J1 stems from the reflected irradiance on the second plate, due to the first plate. Similarly,
Now, J1 is the transmitted portion and J3 is the reflected portion. We immediately realize that

When the second plate has attained thermodynamic equilibrium, the net heat fluxes on both sides of this plate must be equal. Then,
Substituting this expression into the previous equation in J21 yields

Then,

Adding these equations together and using  ,
,

Substituting  and
and  ,
,
12.Earth’s Atmosphere***
When there is no atmosphere, there must be no net heat flux between the Sun and the Earth. The Sun emits a total power of  . The intensity of this radiation at a distance R from the sun is then

The power absorbed by the Earth at thermodynamic equilibrium is then the intensity multiplied by the cross sectional area of the Earth  and its absorptivity ε3.
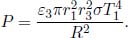
This must be equal to the power radiated by the Earth which is . Equating these powers,
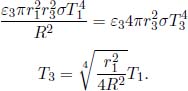
In the presence of an atmosphere, we can use a similar process to first determine the equilibrium temperature of the atmosphere T2.
Referring to Fig. 4.10, we first define the power, radiated by the Sun and incident on the atmosphere, spread per unit area of the atmosphere, as

Now, note that the net heat flux between the atmosphere and the Earth must be zero at equilibrium. Then, the net heat flux between the atmosphere and exterior surroundings (including the Sun) must also be zero for the heat flux to be continuous. The atmosphere reflects a fraction 1 – ε2 – t of the incident radiation by the Sun. Therefore, the net heat flux between the atmosphere

Figure 4.10:Earth with atmosphere
and its exterior surroundings is

where  . Imposing the condition that the above expression is zero and substituting the expression for E,

Now, we move onto the condition that there must be no net heat flux between the atmosphere and the Earth. When an atmosphere is present, there will be infrared light repeatedly bouncing between the atmosphere and the Earth. However, no infrared light that is emitted or reflected by the Earth escapes the combined system of the atmosphere and Earth due to the opacity of the atmosphere to infrared. That said, the atmosphere still permits a portion of the Sun’s ultraviolet radiation to be transmitted. Define J2, M2, J3 and M3 to be the respective radiosities and exitances of the atmosphere and the Earth, in the direction towards each other. Then,
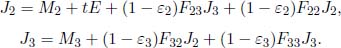
Since the spherical Earth is enclosed by the atmosphere, it is evident that F32 = 1 and F33 = 0. Then, F23 and F22 can also be determined. By the reciprocity theorem, reciprocity theorem,

Substituting  and
and  ,
,

The fraction of radiation emitted by the atmosphere that is not received by the Earth must be returned to the atmosphere. Thus,

Then,
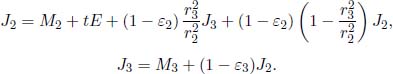
Solving these equations simultaneously and sparing the gory details would yield

The net heat flux between the atmosphere and the Earth is then by Eq. (4.18),

Since must be zero,

Substituting M2 = (ε2 + t)E (this was previously derived when computing the temperature of the atmosphere),
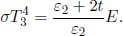
Substituting the expression for E would yield

This temperature is  times of the equilibrium temperature of the Earth without an atmosphere — the model in this problem then implies that the presence of an atmosphere warms the Earth.
13.Ring*
Since the ring undergoes isotropic expansion, the entire ring, including the hole, is scaled radially by a certain factor. Therefore, the size of the hole increases. An alternate perspective to this scaling is that we are enlarging an image of the ring such that the hole becomes larger.
14.Spherical Balls**
An important observation is that the balls expand when heated. However, the center of mass of the ball connected by a string drops while the center of mass of the ball on the horizontal ground rises when the balls expand. Thus there is positive work done on the ball by gravity in the former case while there is negative work done on the ball by gravity in the latter case. Let r be the initial radii of the spheres and Δr1 and Δr2 be the respective changes in radii of the spheres due to thermal expansion. Applying the first law of thermodynamics to both balls (we use the subscript 1 to denote the ball hung by a string and 2 for the other ball),
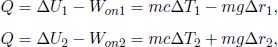
where ΔT1 and ΔT2 are the changes in the temperatures of the balls. c is the standard specific heat capacity of the balls which accounts for the slight work done against the atmosphere due to thermal expansion of the balls when they are heated, in addition to their changes in internal energy. Lastly,

where α is the coefficient of linear expansion. Thus,

where we have used the Maclaurin expansion  and discarded second order and above terms in α.
15.Latent Heat*
In the first case, the heat supplied to the system is entirely embodied in the increase in potential energy of the molecules of the substance as they transition from the liquid phase into the solid phase. Assuming that Δn moles of liquid become gas,

where ΔU is the increase in potential energy of the n moles of molecules. In the second case, part of the heat supplied to the system is also manifested as work performed by the expanding gas molecules.

Since the gas is always at thermodynamic equilibrium, its pressure must be constant so that the piston does not move. Stemming from this constant pressure, the temperature of the gas must also be maintained at T in order for it to attain equilibrium with the liquid state (remember that there is a one-to-one mapping between equilibrium pressure and temperature along a coexistence line). The first law of thermodynamics then yields

Furthermore, from the ideal gas law,
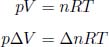
as p and T are constant. Then,

The latent heat of vaporization per mole of gas in this configuration is thus L + RT.
16.Gas in Rocket*
After the system has equilibrated, the gas at the rear of the rocket (relative to its direction of acceleration) must have the largest pressure prear while the front of the rocket has the lowest pressure pfront as the force engendered by the pressure at the back of any gas section exceeding the pressure at its front causes that gas section to accelerate forwards at a at equilibrium. As we will be comparing prear to ps, pfront is negligible when computing the net force on the entire gas remaining in the vessel for the following reason. The initial pressure  where ρi, T and μ are the initial density, temperature and molar mass of the gas. After the system has equilibrated, there will be a new density distribution ρ(x) of the ideal gas where x is the x-coordinate along the cylindrical axis of the vessel. However, as some gas molecules are condensed,
  where the integral is performed over the length of the cylindrical axis. Since
  where p′(x) is the pressure distributifn after the system has equilibrated, this further implies that
  . Since p′(x) is monotonic and p′(x) at the rear end of the cylinder (prear) is possibly comparable to ps, p′(x) at the front end (pfront) must be much smaller than ps to satisfy the above inequality. Therefore, only the rear pressure prear effectively produces the force required to accelerate the remaining gas of mass M′ at a.

If none of the gas condenses, prear must be smaller than the saturation pressure ps while M′ = M.
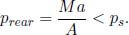
Therefore, the gas does not condense if  If a does not satisfy this bound, a dynamic equilibrium will be established between the liquid and vapor phases of the substance. Then, prear must correspond to the saturation pressure ps.

The number of moles condensed is thus

17.Melting Ice**
We must first do a preliminary check on whether all the ice melts. Assuming that the ice does not completely melt, the final equilibrium temperature of the system will be 0°C. The amount of heat lost by the water is then

The amount of heat required for the ice to completely melt is

Since |Qwater| > Qmelt, the ice completely melts. Now we can calculate the final equilibrium temperature of the system, T, using the fact that

The total change in entropy of the system is the sum of the changes in entropy due to the melting of ice, heating of the melted ice and the cooling of water respectively.

18.Boiling Point**
From balancing forces on individual sections of the atmosphere or from the Boltzmann distribution, the pressure of an isothermal atmosphere of temperature T and molar mass μ at an altitude z above the surface of the Earth can be shown to be

where p0 is the pressure at the surface of the Earth. When water starts to boil, the saturated vapor pressure must be equal to the external pressure due to the atmosphere. We then need to determine the temperature corresponding to p(z) on the coexistence line. Applying the Clausius–Clapeyron equation and neglecting the specific volume of water,

where vg is the specific volume of the gas that can be expressed as  via the ideal gas law. Then,

Equating the saturation vapor pressure and the external atmospheric pressure,
Solving for T,

19.Heating a Container**
The Clausius–Clapeyron equation yields the following case when the specific volume of the gas vg is dominant.

By the ideal gas law,

We also obtain from the ideal gas law that

Taking the total derivative of both sides,

where V has been taken to be a constant as the volume of the gas does not change significantly (as the volume of the liquid is negligible and the volume of the container remains constant). Dividing the above by  ,
,

Substituting the previously derived expression for  ,
,

Since ΔT is small, the fractional change  can be approximated by substituting ΔT for dT and taking T to be the initial temperature in the above equation.

1Actually, a stronger version states that the absorptivity and emissivity of a body for all wavelengths of radiation are equal at thermodynamic equilibrium. However, this is not particularly enlightening as it implies that we would need to define an absorptivity and emissivity for each wavelength. Thus, we shall just consider all wavelengths of radiation as a whole by adopting the gray body assumption.
2You may worry that the above expression gives different results for the same rise in temperature if we intersperse the heating of the object, as compared to the case where its temperature is increased on only one occasion. However, such disparities are second order and can be neglected.
3There are in fact other exotic phases but we shall only consider the three common ones.
4Water is an atypical substance. Its solid-liquid coexistence line has a negative gradient for reasons that will be elaborated later.