To earn your highest possible score on the Science test, you need an efficient and strategic approach to working the passages. In this chapter, we’ll teach you how to apply your scientific reasoning skills to quickly assess the content of the passage and figures and make your way methodically through the questions.
HOW TO CRACK THE SCIENCE TEST
The most efficient way to boost your Science score is to pick your order of the passages and apply our 3-Step Basic Approach to the Charts and Graphs passages and Experiments passages. Follow our smart, effective strategy to earn as many points as you can.
Step 1: Work the Figures
Take 10–30 seconds to review the figures. In the last chapter, we taught you how to look for and identify trends, patterns, and relationships. Your goal in Step 1 is to quickly identify the main point of the passage and the relationships between the variables that convey the main point. Consistent trends are the fastest to assess, but all trends and patterns tell a story. In Chapter 20, we gave you a way to spot the Now passages, which are chiefly characterized by consistent trends.
Now Passages
Small tables and graphs: No more than 3–4 curves on a graph, no more than 3–4 rows and columns on a table.
Easy-to-spot consistent trends: All lines headed in same direction, numbers in a table in easy-to-spot order.
Numbers, not words or symbols: Look for tables and graphs with more numbers and fewer words and symbols.
Short answers: Numbers or trend words like increase and decrease or higher and lower.
Graphs
Graphs visually represent the relationship between the variables. When you work a graph, identify the relationship, and take note of the variables and their units.
Figure 1
Look at the direction of the curves: They are all headed up.
Take note of the variables and their units. Temperature, in °C, is on the x-axis; solubility, in g solute/mL H2O is on the y-axis.
Identify the relationship. A positive slope means it’s a direct relationship. As temperature increases, solubility increases.
Fighting Scientists
The Fighting Scientists passage is fundamentally different from the Charts and Graphs passages and Experiments passages, and it requires a different approach. In Chapter 23, we teach you the approach for Fighting Scientists.
Tables
For tables, you need to make the trends visual. Take a look at the table below.
Table 1
Length (m)
Resistance (Ω)
0.9
7.5
1.8
15.0
3.6
30.0
What is length doing? It’s increasing. Mark it with an arrow.
What is resistance doing? It’s increasing. Mark it with an arrow.
What are the units of the variables? m and Ω.
Identify the relationship. Both variables move in the same direction, so it’s a direct relationship.
Here’s what your table should look like.
Try another table from the same passage.
Table 2
Cross-sectional area (mm2)
Resistance (Ω)
0.8
30.0
1.6
15.0
3.2
7.5
What is the cross-sectional area doing? It’s increasing. Mark it with an arrow.
What is resistance doing? It’s decreasing. Mark it with an arrow.
What are the units of the variables? mm2 and Ω.
Identify the relationship. As the cross-sectional area increases, resistance decreases. It’s an inverse relationship.
Here’s what your table should look like.
Last, identify the relationship between the tables. Each table has the variable resistance in common.
Step 2: Work the Questions
Once you’ve marked the figures, go straight to the questions.
Acronyms Rule!
You’ve seen our favorite Princeton Review acronyms before and you’ll see them again: POOD, LOTD, POE.
Now, Later, Never
There is no set order of difficulty of these questions. Follow your Personal Order of Difficulty (POOD): If a question is fairly straightforward, do it Now. Most of the questions you consider straightforward will likely ask you to identify a trend, look up a value, or make a prediction. Now questions will have values or trend words like increase or lower in the answers. If a question strikes you as confusing or time- consuming, come back to it Later. Occasionally, you’ll judge a question tough enough you may Never want to do it. Select your Letter of the Day (LOTD), and move on to the next passage. In Step 3, we’ll address how smart use of Process of Elimination (POE) may eliminate the need for any Never questions on a Now passage. But for now, let’s look at a sample Now question.
1.Based on the figure, as temperature increases, the solubility of HgCl3:
A.increases.
B.decreases.
C.increases, then decreases.
D.decreases, then increases.
Here’s How to Crack It
This question is asking you to identify a trend. You already cracked this question in Step 1, when you worked the figures and identified the trends. All the curves are headed up, so as temperature increases, the solubility of HgCl3 increases. The correct answer is (A).
Try another.
2.According to Figure 1, KNO3 and KCl have the same solubility at what temperature?
F.Between 0° and 10°
G.Between 10° and 20°
H.Between 20° and 30°
J.Between 30° and 40°
Here’s How to Crack It
This question is asking you to look up a value in the figure. Find where KNO3 and KCl have the same solubility. They have the same solubility when the lines intersect, at a solubility of 30 g/100 mL H2O. Draw a line down to the x-axis to see what the temperature is when solubility is 30; it’s just over 20°, so the correct answer is (H).
Many questions on Science passages will entail nothing more than looking up a trend or value in a figure. Both of these are great Now questions.
Let’s try one more question from the same passage.
3.Based on the figure, at 100°C the solubility of HgCl3 would most likely be:
A.less than 5 g/100 mL H2O.
B.between 10 g/100 mL H2O and 20 g/100 mL H2O.
C.between 20 g/100 mL H2O and 30 g/100 mL H2O.
D.greater than 30 g/100 mL H2O.
Here’s How to Crack It
If a question cites a specific value, first check to see if that value is in the figure. If it’s not, the question is asking you to make a prediction. Because the trend is consistent, you can predict what the curve will do. At 90°C, the solubility of HgCl3 is already over 30 g/100 mL H2O. Therefore, at 100°C, the solubility will be greater than 30 g/100 mL H2O. The correct answer is (D).
Read If and Only When You Need To
On most of the questions, particularly on Now passages, you will be able to answer the questions based on the figures. Whether it’s a Charts and Graphs passage or Experiments passage, waste no time reading any of the introduction, or in the case of the Experiments passages, the descriptions of each experiment/study. It’s only when you can’t answer a question from the figures that you should read.
Let’s take a look at some questions from an Experiments passage. We’ve already marked the tables from this passage.
Passage III
The resistance of a material that obeys Ohm’s Law can be calculated by setting up a potential difference at the ends of a wire made of that material and then measuring the current in the wire; the resistance is the ratio of potential difference to current. Because resistance is dependent on length and cross-sectional area, scientists created a standard measure, resistivity, which is the measure of how strongly a material opposes the flow of current. In the experiments below, scientists examined the factors affecting resistance in an Ohmic material that they invented.
Experiment 1
In their first experiment, scientists examined the relationship between the length of a wire and its resistance. The resistivity of the wires used in this experiment was 27.5 ρ, and the cross-sectional area of the wires was 3.2 mm2.
Experiment 2
In their second experiment, scientists examined the relationship between the cross-sectional area of a wire and its resistance. The resistivity of the wires used in this experiment was 27.5ρ, and the length of the wires was 0.9 m. The results are shown in Table 2.
4.Conductivity measures a material’s ability to conduct an electric current, and it is defined as the reciprocal of a material’s ability to oppose the flow of electric current. If the scientists wanted to increase the conductivity of the material they invented, they would:
F.increase the length.
G.decrease the cross-sectional area.
H.increase the resistivity.
J.decrease the resistivity.
Opposites
Whenever there is only one pair of answers that are exact opposites, the correct answer is frequently one of the two opposites.
Here’s How to Crack It
The question defines a new term, conductivity, and asks how the scientists would increase the conductivity of their specific material. As part of the definition, the question states that conductivity is the reciprocal of a material’s ability to oppose the flow of current. The tables do not feature an obvious variable for this quality, so you have to read the introduction and studies.
In the introduction, the term resistivity is defined as a material’s ability to oppose the flow of electric current. The question adds the information that conductivity is the reciprocal of resistivity. Therefore, to increase the conductivity, the scientists would decrease the resistivity. The correct answer is (J). Notice that (H) and (J) are exact opposites. Whenever there is only one pair of exact opposites, the correct answer is frequently one of the pair.
When to Read
Read if and only when you can’t answer a question from the figures. If a question introduces a new term that you can’t identify as one of the variables on the figures, look for information about that term in the introduction and/or experiments.
Step 3: Work the Answers
On more difficult questions, POE will be much faster and more effective than scouring the text or figures to find an answer. If the answers are wordy—that is, anything but a simple value or trend word like increase or lower—use POE. Read each answer choice, and eliminate any that are contradicted by the figures.
The term solubility refers to the amount of a substance (solute) that will dissolve in a given amount of a liquid substance (solvent). The solubility of solids in water varies with temperature. The graph below displays the water solubility curves for four crystalline solids.
6.A solution is saturated when the concentration of a solute is equal to the solubility at that temperature. If a saturated solution of potassium chloride (KCl) at 10°C were heated to 80°C, would the solution remain saturated?
F.Yes, because solubility decreases with increasing temperature.
G.Yes, because concentration decreases with increasing temperature.
H.No, because solubility is unaffected by increasing temperature.
J.No, because concentration is unaffected by increasing temperature.
Here’s How to Crack It
The question defines a new term, saturated, identifies KCl as saturated at a given temperature, and asks if KCl will remain saturated at a new temperature. If you’re familiar with the topic of saturation, you may already know whether it’s yes or no. If so, cross off the two answers you know to be wrong, and examine the reasons given in the two remaining answers.
But if you didn’t understand the new information and can’t process what will happen at a new temperature, use POE on all four answers. Ignore the yes/no, and focus on the reasons given in each answer.
Choice (F) says that solubility will decrease with increasing temperature, but the figure disproves this. No matter what the new information in the question is, this cannot be the correct answer. Cross it off. Choice (G) brings in a new variable, concentration. Quickly check the introduction to see if concentration is defined. It’s not, so you have to leave (G). You can’t eliminate an answer about a variable that you know nothing about. You can eliminate (H), however, because the figure disproves the reason. Choice (J) revolves around concentration, so you have to keep that as well.
At worst, you have a fifty-fifty chance of getting this question right if you guessed from here and moved on. We can offer one extra tip to help sway you in your guess. Avoid an answer that provides either a value or describes a trend of an unknown variable if you have no proof of how that new variable will behave. Thus, between (G) and (J), the smart money is on (J), and it is the correct answer. Concentration is the number of grams of the substance per unit volume, and the concentration will not change with temperature.
POE and Pacing
POE is so powerful on Science, you should be able to eliminate at least one, sometimes two, wrong answers even on questions that look like Never questions. This is particularly true on a Now passage.
Depending on your pacing, you may try to reason between the remaining answers, or you may just guess and move on. Don’t spend more than another minute. Even if you get the question right eventually, spending too much time on one question will likely cost 2–3 questions later on.
THE 3-STEP BASIC APPROACH AND LATER PASSAGES
The 3-Step Basic Approach works on all passages with figures, not just the Now passages featuring consistent trends in tables and graphs.
Take a look using the 3-Step Basic Approach at a Later passage in the following section.
Step 1: Work the Figures
Some ACT passages will feature an illustration, a diagram, or tables and graphs with no consistent trends. Take 10–15 seconds to review the figure. When there are no consistent trends, a figure doesn’t reveal the main point as readily. You’ll learn the main point as you work the questions and answers. Spend the limited time devoted to Step 1 looking for any patterns or terms.
Try this figure.
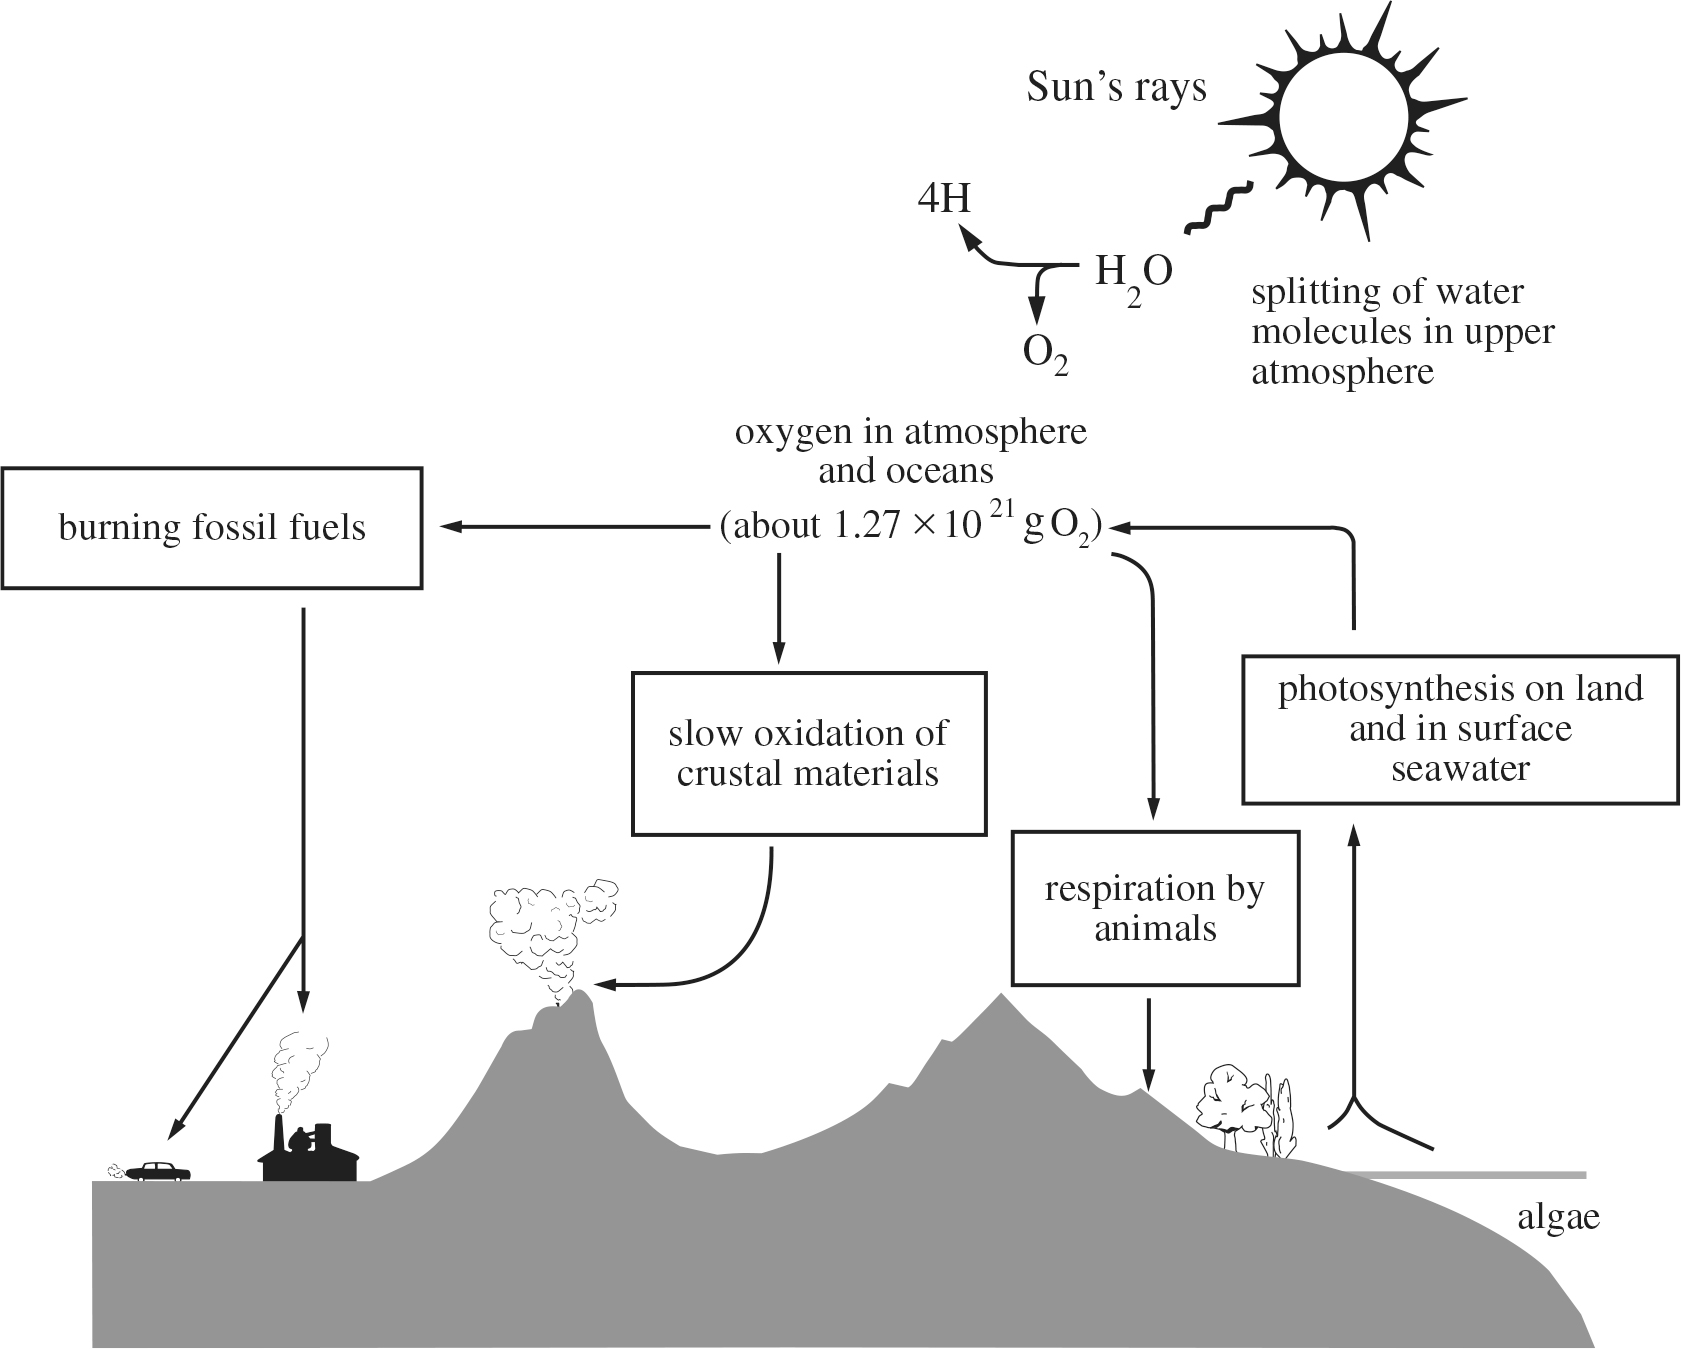
The terms oxygen, fossil fuels, oxidation, respiration, and photosynthesis all appear.
Step 2: Work the Questions
Even on Later passages, several questions will ask you to look something up in the figure. The more confusing the figure, however, the more likely you are to waste valuable time trying to figure everything out from staring at the figure, waiting for a flash of inspiration to hit. As we mentioned before, spend 10–15 seconds looking for any patterns or terms. Your time is better spent moving to Steps 2 and 3. Working the questions and answers will help you crack the main point of the passage.
Try a question.
13.Based on the information provided, which one of the following statements concerning the oxygen cycle is true?
A.Photosynthesis on land and in surface seawater uses up oxygen.
B.Photosynthesis on land and in surface seawater produces oxygen.
C.Respiration by animals produces oxygen.
D.Slow oxidation of crustal materials produces oxygen.
Step 3: Work the Answers
The wordier the answers, the more you should use POE. Read each answer, and then review the figure: Does the answer choice accurately describe the figure?
Here’s How to Crack It
Pay attention to arrows. They provide a pattern that tells the story. Choice (A) says that photosynthesis uses oxygen, but the arrows lead toward oxygen, not away. Eliminate (A). Choice (B) is the exact opposite and matches the direction of the arrows. Keep it. Whenever there is only one pair of exact opposites, the correct answer is frequently one of the two opposites. Choices (C) and (D) both describe producing oxygen, but the arrows move away from oxygen, not toward it. Both descriptions are contradicted by the arrows. The correct answer is (B).
Basic Approach Drill 1
Use the Basic Approach on the passage below. For the answers to this drill, please go to Chapter 25.
The kinetic molecular theory provides new insights into the movement of molecules in liquids. It states that molecules are in constant motion and collide with one another. When the temperature of a liquid increases, there will be an increase in the movement of molecules and in the average kinetic energy. The figure below depicts the distribution of the kinetic energy of two volumetrically identical samples of water at different temperatures (T).
Water has attractive intermolecular forces that keep the molecules together. When enough heat is added to water, it will weaken these forces and allow some molecules to evaporate and escape the liquid as a gas. The activation energy (Ea) is the minimum energy necessary for molecules to escape the liquid and undergo a phase change.
Distribution of Kinetic Energy for Two Samples of Water
Figure 1
1.Which of the following statements best describes the changes observed in the graph?
A.At T1, Sample 1 has a lower kinetic energy than does Sample 2.
B.At T2, Sample 1 has a lower kinetic energy than does Sample 2.
C.An increase in temperature leads to a decrease in kinetic energy.
D.Water never undergoes a phase change.
2.Assume that water undergoes a phase change to a gas. Which of the following statements would be true?
F.The attractive intermolecular forces of the escaping molecules are weak.
G.The average kinetic energy of the water remains the same.
H.The rate of movement of the gas molecules decreases.
J.The gas will undergo no further phase changes.
3.Suppose a third sample of water is heated to a higher temperature than Sample 2. It is then found that a greater number of molecules escaped the liquid in Sample 3 than in Sample 2. Would these results be consistent with the results depicted in Figure 1?
A.Yes, an increase in temperature leads to a decrease in the number of escaping molecules in the liquid.
B.Yes, as the temperature increases, it leads to more molecules escaping the liquid.
C.No, the temperature reading of Sample 2 would be five times as high as that of the third sample.
D.No, the average kinetic energy of the water will decrease.
4.It can be inferred from the passage that when a substance undergoes a phase change from a liquid to a gas it will:
F.evaporate.
G.condense.
H.disintegrate.
J.remain the same.
5.Given the samples at T1 and T2, and the kinetic energies measured and shown in Figure 1, which temperature produces the highest single kinetic energy measurement?
A.Both T1 and T2
B.T2
C.T1
D.Neither T1 nor T2
6.Another volumetrically identical sample of water is heated to an average temperature of A. If no molecules escape the liquid in the sample, which of the following is most likely true?
F.The Ea for this sample is greater than the Ea for the samples shown in Figure 1.
G.The Ea for this sample is less than the Ea for the samples shown in Figure 1.
H.Temperature A is less than T1.
J.Temperature A is greater than T2.
Basic Approach Drill 2
Use the Basic Approach on the passage below. For the answers to this drill, please go to Chapter 25.
Amphibians are unique organisms that undergo drastic physical changes during the transformation from an immature organism into an adult form. This process, called metamorphosis, begins with the determination of cells at the tadpole stage. A study was conducted using tadpoles to determine the influence of thyroxine (a hormone) on metamorphosis.
As shown in the graph below, tadpoles were placed in solutions containing various concentrations of thyroxine. Increased levels of thyroxine correlated with increased rates of tail reabsorption and the appearance of adult characteristics such as lungs and hind legs.
Figure 1
1.Suppose that a tadpole was immersed in a 0.3 µg/ml solution for 72 hours. What would be the expected approximate decrease in tail width?
A.22%
B.30%
C.41%
D.50%
2.Which of the following generalizations about tadpoles is supported by the results of the study?
F.They will not undergo metamorphosis if they are not given thyroxine.
G.Metamorphosis in a normal tadpole takes at least five days.
H.The most rapid disappearance of the tail is associated with the immersion of tadpoles in the most dilute thyroxine solution.
J.Temperature plays a major role in metamorphosis.
3.After four days, the tadpoles are checked for development. In all samples other than the control, which of the following concentrations of thyroxine would the tadpoles be likely to show the LEAST development?
A.0.5 µg/ml
B.0.2 µg/ml
C.0.1 µg/ml
D.All of the tadpoles would show the same development.
4.Based on the information in the passage, which of the following would be a correct order of the stages of tadpole development?
F.Tadpole → adult → reabsorption of tail → cell determination
G.Tadpole → cell determination → reabsorption of tail → adult
H.Tadpole → reabsorption of tail → cell determination → adult
J.Cell determination → tadpole → adult → reabsorption of tail
5.According to Figure 1, immersing the tadpoles in solutions containing various concentrations of thyroxine does not begin to affect the rate of tadpole metamorphosis until when?
A.No time at all; the thyroxine affects the rate of metamorphosis immediately.
B.0–12 hours after immersion
C.12–24 hours after immersion
D.24–36 hours after immersion
6.A tadpole is immersed in a 0.15 μg/ml thryroxine solution. If after t hours, the tadpole has undergone a 22% decrease in tail width, which of the following is likely closest to t?
F.60
G.72
H.84
J.96
Basic Approach Drill 3
Use the Basic Approach on the passage below. For the answers to this drill, please go to Chapter 25.
Each element is arranged in the periodic table according to its atomic number, which represents the number of protons in the nucleus. In every neutrally charged atom, the number of electrons equals the number of protons. The table below lists some of the properties of row 2 elements in the periodic table. Electronegativity is a measure of the relative strength with which the atoms attract outer electrons. Within a row of the periodic table, the electronegativity tends to increase with increasing atomic number, due to the tighter bonding between protons and electrons. The highest value for electronegativity is 4.0.
Table 1
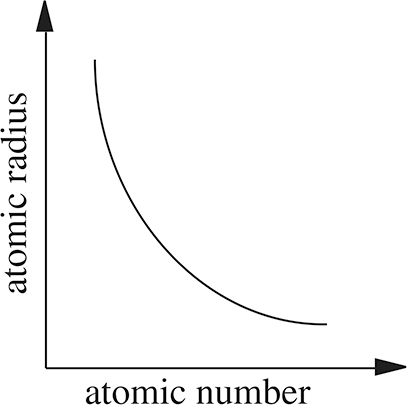
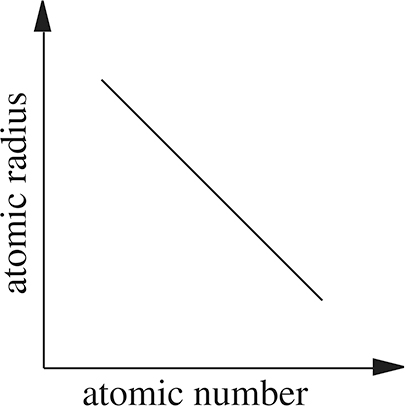
1.Which of the following graphs best represents the relationship between atomic number and atomic radius for row 2 elements?
A.
B.
C.
D.
2.What conclusion could be appropriately drawn from the data regarding electronegativity in Table 1 ?
F.An element with high electronegativity has an even atomic number.
G.An element with high electronegativity will be a metal.
H.An element with high electronegativity will have little tendency to attract outer electrons.
J.An element with high electronegativity will be a non-metal.
3.What generalization can one make concerning the relationship between two properties of elements?
A.As the atomic radius decreases, the electronegativity decreases.
B.As the atomic radius decreases, the electronegativity increases.
C.All metals have higher electronegativity values than non-metals.
D.The atomic radius of F is larger than that of N.
4.Which of the following is true regarding the comparative electronegativity of fluorine (F) and lithium (Li)?
F.The electronegativity of F is greater than Li because F has fewer electrons in its outer shell.
G.The electronegativity of F is greater than Li because F electrons are more tightly bound.
H.The electronegativity of Li is greater than F because Li has a greater metallic character.
J.The electronegativity of F is greater than Li because Li has a greater metallic character.
5.Generally speaking, ionization energy follows the same trends as does electronegativity. Elements with a high electronegativity also have a high ionization energy. Which of the following is a correct order of elements with INCREASING ionization energies?
A.Li, N, F
B.F, N, Li
C.B, N, Be
D.Be, O, Li
6.Element X and Element Y are two row 2 elements, one metal and one non-metal. Element X has tighter bonds between protons and electrons than Element Y. Which of the following could be Element X and Element Y?
Element X
Element Y
F.
Li
Be
G.
B
Be
H.
C.
B.
J.
Be.
C.
Summary
All Charts and Graphs passages and most Experiments passages come with figures.
Use the 3-Step Basic Approach on passages with figures.
Step 1. Work the Figures. Look at the trends and patterns in the figure to identify the relationship between the variables. Mark trends in tables with arrows.
Step 2. Work the Questions. Do Now the straightforward questions that involve looking up a trend or value on the figure or making a prediction of what a variable will do. Read if and only when you can’t answer a question from the figures. Do Later any question that strikes you as more difficult or time-consuming.
Step 3. Work the Answers. For tougher questions, POE should help you eliminate at least one wrong answer if not three.
Pace yourself. If you’ve eliminated at least one wrong answer on a tough question, guess and move on.