5.6 Supplier Management
In this section, we’ll review the key concepts of supplier management and how it helps business users classify suppliers and generate analytical reports on supplier performance. We’ll also describe supplier classification, purchasing categories, and supplier evaluation in SAP S/4HANA.
5.6.1 Classification and Segmentation
In SAP ERP, there is no option to classify suppliers by means of strategic importance. In SAP S/4HANA, however, you can classify suppliers by spend, strategic importance, and supply risk. The supplier classification and segmentation functionality in SAP S/4HANA is an ongoing process that helps you classify suppliers at periodic intervals and allocate suppliers to segments of different importance. SAP S/4HANA offers the following features to support classification and segmentation:
-
Purchasing category
The purchasing category allows you to manage suppliers according to specific categories of goods and services. The purchasing category plays an important role in the supplier evaluation process and helps to compare evaluations of all suppliers in the same purchasing category. One or more suppliers can be managed under a purchasing category, and one or more material groups can be managed under a purchasing category. Figure 5.16 shows the creation of a purchasing category with Suppliers and Materials Groups.
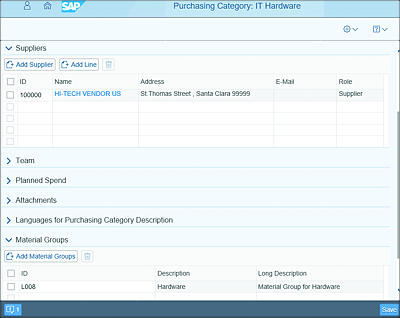
Figure 5.16 Purchasing Category Creation
-
Supplier classification
Suppliers can be classified as A, B, and C to identify strategic importance, and information about a relationship, such as “preferred supplier” is also maintained. -
Procurement activities and tasks
Supplier-related activities and tasks can be managed under the purchasing category in SAP S/4HANA, as seen in Figure 5.17. In SAP ERP, supplier-related tasks and supplier activities are managed outside of the system, and no options are available to track supplier activities.
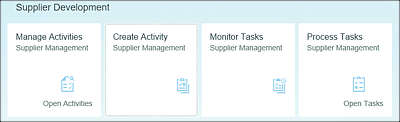
Figure 5.17 Supplier Development SAP Fiori Apps for Activities and Task Management
5.6.2 Supplier Evaluation
In SAP ERP, supplier analytics requires data warehousing and doesn’t provide any real-time visibility. No option is available in SAP ERP to perform supplier evaluation from internal stakeholders.
On the other hand, SAP S/4HANA provides real-time insights into supplier evaluation by quantity, price, and delivery date based on transactional documents through analytical SAP Fiori apps. Supplier evaluation in SAP S/4HANA offers drilldown options By Supplier, By Purchasing Group, By Purchasing Organization, By Purchasing Category, By Material Group, By Plant, Document, Trend by Supplier, and Trend by Purchasing Category. Let's explore these further:
-
Supplier Evaluation By Price
This app provides a score for suppliers based on variance in price (Figure 5.18). The score is calculated based on the variance between the purchase order amount and the invoice amount over the period of one year.
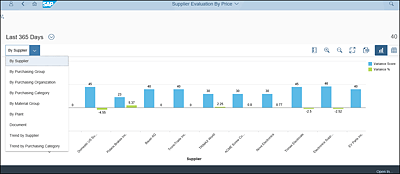
Figure 5.18 Supplier Evaluation by Price App
-
Supplier Evaluation By Quantity
This app provides a score for suppliers based on variance in quantity. The score is calculated based on variance between the ordered quantity in the purchase order and the delivered quantity recorded in goods receipt over a period of one year. Excess and less delivered quantities are considered as variance. Figure 5.19 shows the Supplier Evaluation By Quantity app and options for users to navigate to other related SAP Fiori apps.
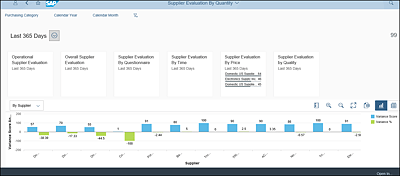
Figure 5.19 Supplier Evaluation by Quantity App
-
Supplier Evaluation By TIME
This app provides scores to suppliers based on the delivery date. The score is calculated based on the variance between the delivery date in the purchase order and the delivered date of the item goods received date. Late and early deliveries of items are considered as variance.
SAP S/4HANA also provides options to generate a supplier evaluation scorecard based on evaluation questionnaires. Evaluation questionnaires are sent to internal stakeholders within the company to collect information about suppliers. An evaluation response includes answers and scoring from internal stakeholders. This helps you to generate the questionnaire score (soft score).
The overall supplier evaluation score can be seen holistically by combining the operational score (hard facts, e.g., supplier evaluation by price and quantity) with the questionnaire score (soft score). Figure 5.20 shows the Overall Score by combining the Operational Score and Questionnaire Score.
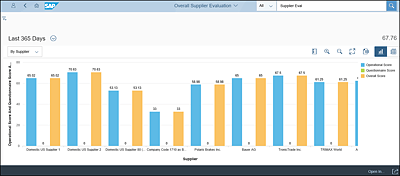
Figure 5.20 Overall Supplier Evaluation Score