9 Reporting and Analytics
One of the benefits of implementing SAP S/4HANA is the availability of better data faster to make agile business decisions. Although each previous functional chapter has discussed relevant process-specific reports and analytics, this chapter focuses on the big picture, showcasing what levels of reporting are available and how they can be deployed.
The SAP S/4HANA system allows you to have transactional data and analytical data in the same SAP HANA instance without the need to extract, transform, and reload it. Having the online transaction processing data and online analytical processing data in the same instance both reduces the system’s size (due to fewer data redundancies) and reduces the time to deliver business intelligence analytical reporting.
In this chapter, we’ll explain the definition of the business intelligence maturity level, and the differences among tactical reporting, strategic reporting, and predictive and cognitive reporting. This will help you understand the current analytical status of your organization, as well as how to use SAP S/4HANA and the available analytical tools to achieve a better system for analysis. We’ll also discuss integration with SAP BusinessObjects Business Intelligence (SAP BusinessObjects BI).
Finally, we’ll give you a quick view of the dynamic data fabric concept to help you understand the current architecture approach, to integrate Internet of Things (IoT) generated data into big data storage, and to use the SAP Leonardo Machine Learning applications and the SAP S/4HANA system.
9.1 Business Intelligence Maturity Level
Recognizing the current capabilities to collect, process, and report on your current set of available data across your organization is the first step to implementing a successful analytical system. In fact, one of the most common mistakes made by organizations with a long history of relying on operational reporting is to not consider capabilities that are beyond the standard operational reports available in their legacy systems.
Operational reporting is provided to run business processes, such as lists of pending activities, reports of past transactions executed in a certain period of time, or even exceptional reporting based on missing actions to complete a particular business process.
The concept of the Business Intelligence (BI) maturity level will allow you to understand and measure your organization’s current analytical level and then define a road map to increase the analytical strength of your organization.
9.1.1 What Is the Business Intelligence Maturity Level?
The BI maturity level defines the ability of your organization to collect and transform data and to provide the right amount of analysis across your organizational functions and roles.
The complexity and types of questions asked by executives, managers, and operators, as well as the number of those questions that can be answered by the analytical system, define the level of analytical maturity level. These questions can be classified as questions related to operational or management reporting, or questions that predict possible outcomes based on historical data.
They are two main levels of analysis of a business event in your organization: descriptive analytics and predictive analytics. The first level is the descriptive analysis, and the second level is the predictive and prescriptive analysis of the information at the business functional levels of your organization.
9.1.2 Descriptive Analytics
Descriptive analytics refer primarily to management reports used to complete tactical operations. Usually, they are middle management reports that explain what happened.
The use of exceptional reporting is also considered part of the descriptive analytics group, and those type of reports find deviations to standard behaviors of data (e.g., a sales report that finds and shows abnormal discounts to a client belonging to a particular sector).
Descriptive analytics can be further detailed as descriptive hindsight, descriptive insight, and descriptive foresight analytics.
-
Hindsight
Includes tactical operations based on “rear-view mirror” assessments of operations-generated data. -
Insight
Uses data to drive changes here and now. -
Foresight
Understands signals generated across your ecosystem.
Descriptive analytics is based on enterprise data management, management reporting, slice-and–dice queries and drill downs, exceptions and alerts, and role-based performance metrics.
9.1.3 Predictive Analytics
At the second level, predictive analytics takes data and uses statistical regression models and probabilistic calculations to predict a future event based on ratios of accepted probability.
Organizations that can integrate and use predictive and prescriptive analytics can achieve a higher BI maturity level, and allow the implementation of quantitative analysis, predictive modeling, scenario simulations, and optimization algorithms to generate strategic reporting.
The higher levels of BI maturity permit organizations to increase their level of business advantage and sophistication.
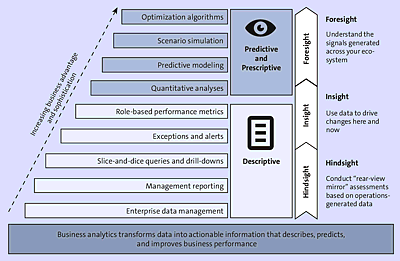
Figure 9.1 shows the different levels of analytics and the hierarchies, complexities, and maturity levels achieved.
In our experience, the majority of corporations today have a low to medium BI maturity level. The main reasons are normally related to higher dependencies on operational reports provided by the current transactional systems and BI systems that depend on duplications of data, limiting the ability to process, store, and use data for mature applications.
SAP introduced SAP S/4HANA to target the resolution data duplication issue in the SAP ERP platform. The speed of the in-memory platform allows complex data processing operations and allows complex calculations models to be used.
Figure 9.1 Business Intelligence Maturity Level
Legacy SAP ERP systems provide strong Online Transaction Processing (OLTP) and reporting capabilities based on programs that integrate and transform transactional data. Descriptive operational reports support operators and supervisors to perform their daily tasks. In the SAP ERP world, these reports are commonly identified as ABAP reports, which provide a basic or low BI maturity level.
The SAP S/4HANA system integrates analytical and transactional data in the same SAP HANA instance to deliver slice-and-dice queries and drilldowns, exceptions and alerts, and role-based performance metrics, along with the implementation of predictive and prescriptive reporting.
9.1.4 Tactical Reporting
Tactical reporting refers to reports created in the transactional system—SAP ERP or SAP S/4HANA—using transactional data and programmed in ABAP. These reports support operations by providing data in the form of lists, pending and open objects in a process step, or basic reports that explain what happened in the past in a particular business process.
SAP S/4HANA has a frontend new user experience (UX) based on integrated SAP Fiori applications and the backend look and field of the previous SAP ERP versions.
The SAP S/4HANA backend standard online transactional functional reporting (commonly called ABAP Reporting) maintains most of the previous SAP ERP functionality, including specific improvements per functional area.
You can find details for each logistics area in previous chapters of this book, including sales and operations, SAP Extended Warehouse Management (EWM), procurement and logistics, and all available reporting classified by list, objects status, and objects completion by date and process.
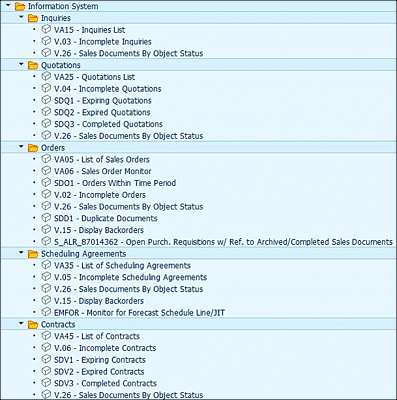
For example, from the SAP ERP Sales and Distribution (SAP ERP SD) module, the standard ABAP reports are available in the SAP S/4HANA system. The available reports are shown in Figure 9.2, listed by transaction and report title.
Figure 9.2 SAP S/4HANA Information Systems, Sales, and Distribution
For each Logistics functional area, you’ll find the Information Systems application available. The execution of this standard reporting is improved by the SAP HANA aggregation, speed, and consequently high performance, compared with the legacy SAP ERP versions running in traditional relational databases.
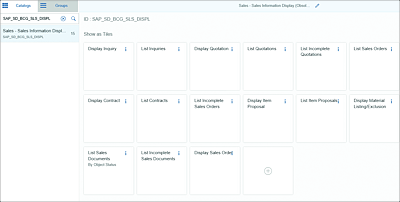
The same example of transactional sales reports, available in the new SAP S/4HANA frontend using SAP Fiori is shown in Figure 9.3.
Figure 9.3 SAP Fiori Sales Information Display
The Display Inquiry tile will call the business process step to display an inquiry document, which is same functionality as Transaction VA11 in the SAP S/4HANA backend view.
The SAP Fiori apps can be adjusted to specific user needs, offering a new digital view of transactions and reports.
9.1.5 SAP S/4HANA Embedded Analytics and SAP Fiori
The SAP S/4HANA embedded analytics and SAP Fiori UX are part of the SAP S/4HANA system. As the new frontend of your SAP transactional system, SAP Fiori UX is a digital, agile, and flexible user interface designed for the new system’s digital generation. The SAP Fiori apps are designed to follow the specific needs of a role in your organization. SAP Fiori has already predefined specific roles per functional area, and you can also customize these roles and presentation tiles according to your own business organization needs.
SAP’s new design approach emphasizes ensuring a consistent UX across all analytical applications and support applications. The concept of consistency refers to all applications having the same look and feel, supporting functionality in a similar way, and working consistently. The integration component with other SAP analytical applications and offerings is a major area of concern in the new SAP S/4HANA design. Other SAP analytical applications, such as SAP BusinessObjects and SAP Lumira, are seamlessly integrated with the SAP S/4HANA embedded analytics architecture.
9.1.6 SAP S/4HANA Embedded Analytics Architecture
The SAP S/4HANA embedded analytics architecture ensures that the data generated at the transactional level is integrated with the generated analytical data. This architecture surpasses the old designs that extract, transform, duplicate, and store transactional data into analytical repositories to later provide the relevant models and transformations with analysis.
The SAP S/4HANA embedded analytics has virtual data models (VDMs) as its foundation or first layer, which are based on the SAP S/4HANA transactional tables. These VDMs are the foundation to feed the second layer of the architecture—the analytical layer.
The required analysis is produced in the analytical layer by SAP Fiori apps, multidimensional reports, Query Designer functions, ABAP for Eclipse reports, query browsers, and the SAP Smart Business cockpit.
The third layer is the presentation layer, where other analytical tools can be integrated to present the data in forms of dashboards, explorer views, mobile applications, and other presentation tools.
The new SAP S/4HANA embedded architecture and SAP S/4HANA VDMs will allow you to use data created in an SAP S/4HANA transaction, analyze the transactional data, and link a new transaction to take action based on the analysis—all in the same SAP S/4HANA system.
For example, your sales representative enters a sales order, and with the use of specific analytics generated in SAP S/4HANA embedded analytics tools, you can analyze and check the probabilities of issues with the overall status of the approval, fulfillment, and handling of the order. After the analysis, you can execute and adjust a specific action to remediate the situation. All of this deep analysis beyond the standard traditional reports occurs embedded in the same SAP S/4HANA system.
The SAP embedded architecture also can integrate with your BI systems such as SAP HANA Enterprise or SAP BW/4HANA system to execute more complex analytics.
Note
A list of all SAP Fiori apps available in your SAP S/4HANA system is provided in the appendix for your reference.
9.1.7 SAP Fiori App Example
The purpose of this section is to give you one example of an SAP Fiori app explained in detail to help you understand what the design logic is and the intended application per function and its use.
The purpose of this book isn’t to cover in detail the analysis and integration of SAP S/4HANA and SAP Fiori, but rather to give you a sense of what you can expect and how the SAP Fiori apps are designed and integrated into SAP S/4HANA.
We recommend that you explore each particular SAP Fiori app you’re interested in, followed by reading the standard SAP support documentation.
Order-to-Cash Management
The standard Order to Cash Management SAP Fiori app is designed to support the role of the order-to-cash process manager to get an overview of all sales orders in the process in your company. With this SAP Fiori app, your manager can track any delivery or billing blocks, detect changes made to critical fields of a sales order, and monitor lead times, such as order to delivery times and a goods issue to billing times.
The Order to Cash Management app contains a general overview page, which enables your order-to-cash manager to get a quick overview of potential issues and to compare the current and past performance of the order-to-cash process.
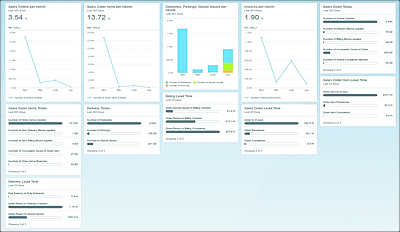
The order-to-cash performance in the past month view shows all process Key Performance Indicators (KPIs) aggregated over the past 28 days; this particular view uses the SAP Smart Business generic drilldown. The time series analysis included in this SAP Fiori app displays the history of performance in the past 365 days. This view uses the analytical drilldown based on the Analysis Path Framework (APF). Figure 9.4 shows the order-to-cash key performance indicators of SAP S/4HANA embedded analytics using the SAP Fiori front-end.
Figure 9.4 Order-to-Cash Performance


