Alisha Coleman-Jensen and Barry Steffen1
INTRODUCTION
Families living in or near poverty may struggle to meet their most basic needs for adequate food and shelter. In extreme cases, some families experience outright persistent hunger or homelessness. Although most Americans, even those in poverty, do not experience food and housing hardships that severe, they may face serious hardships referred to as “food insecurity” and “housing insecurity.” Being unable to obtain adequate nutritious food and decent, affordable housing can have negative effects on families and individuals, as evidenced by poor physical and mental health of both adults and children and adverse developmental outcomes for children. An idyllic scene of rural America often depicts vegetable gardens, family farms, and welcoming porches. As is made clear throughout this book, however, such situations are not the reality for many rural poor. In rural areas across the United States, food is not always in abundance, and living arrangements are not always ideal. This chapter explores these issues further, examining what the federal government means by the terms food insecurity and housing insecurity, considering what experiencing these difficulties means for rural residents, and comparing how their experiences differ from similar households in other “residence areas”—suburban areas and principal cities.2
FOOD INSECURITY
Most U.S. households are able to obtain adequate food for all their members. Each year, however, a minority of American households experience food insecurity at times. In 2014, 14 percent of U.S. households struggled to put enough food on the table (figure 10.1). In rural or nonmetropolitan counties, 17.1 percent of households were food insecure. The U.S. Department of Agriculture (USDA) defines food-insecure households as those that “were, at times, unable to acquire adequate food for one or more household members because they had insufficient money and other resources for food” (Coleman-Jensen, Rabbitt, Gregory, and Singh 2015, 8). During 2014, the severe range of food insecurity, described as very low food security, affected 5.6 percent of U.S. households overall and 7.3 percent of households in rural counties. Households with very low food security “were food insecure to the extent that eating patterns of one or more household members were disrupted and their food intake reduced, at least some time during the year, because they could not afford enough food” (Coleman-Jensen et al. 2015, 8). Households classified as experiencing very low food security report cutting the size of or skipping meals, being hungry because they could not afford enough food, and in some cases going a whole day without eating.

Figure 10.1 U.S. households sorted by food security status, 2014.
Research shows that food insecurity is related to poor health outcomes for adults. For example, it appears that food insecurity contributes to reduced nutrient intake, postponing medical care, inability to afford prescriptions, diabetes and other chronic conditions, and poor mental health (for a review, see Bread for the World Institute 2016, and Food Research and Action Center 2014). Food insecurity is a risk factor for problematic health, developmental, and educational outcomes for children as well. For example, household food insecurity has been linked to poorer health, anemia, more illnesses, behavioral problems, depression, chronic health conditions, and lower educational achievement among children (for a review, see Coleman-Jensen, McFall, and Nord 2013). Difficulty obtaining adequate food is problematic in its own right, and the associated consequences carry high costs for individuals, communities, and the nation.
HOW IS FOOD SECURITY MEASURED?
U.S. food security measurement began in 1995 (for a brief history, see Coleman-Jensen 2015). The prevalence and severity of food insecurity in U.S. households is monitored annually by the Economic Research Service of USDA (U.S. Department of Agriculture 2017). The questions used to assess food security are included in the Current Population Survey Food Security Supplement (CPS-FSS). The CPS is a federal survey that is the source for national unemployment and poverty statistics.3 Food security status is determined by responses to a series of survey questions about conditions and behaviors that characterize households having difficulty meeting basic food needs (see “Questions Used to Assess the Food Security of Households in the CPS Food Security Survey” on p. 287 and figure 10.2). Each question asks about experiences in the past twelve months and specifies a lack of money and other resources to obtain food as the reason for the hardship, thus excluding voluntary fasting or dieting from the measure (Coleman-Jensen et al. 2015).4

Figure 10.2 Percentage of households reporting each indicator of food insecurity, by food security status, 2014.
RECENT TRENDS IN U.S. FOOD INSECURITY
Food insecurity increased substantially with the 2007–2009 recession and has remained at a relatively high level (figure 10.3). In 2007, 11.1 percent of U.S. households were food insecure, but by 2008, the prevalence had increased to 14.6 percent. Food insecurity reached a high of 14.9 percent of U.S. households in 2011 and declined to 14.0 percent in 2014, but remained above prerecession levels (Coleman-Jensen et al. 2015).
Figure 10.3 Trends in the prevalence of food insecurity and very low food security in U.S. households, 1995–2014.
Trends in food insecurity rates across rural and urban residence areas (measured here as nonmetropolitan counties or metropolitan areas divided into principal cities and suburban areas) followed a similar pattern to that of the United States as a whole (figure 10.4).5 Since the recession, however, food insecurity has continued to worsen in rural areas (nonmetropolitan counties) while improving somewhat in more urban areas (metropolitan areas divided into suburban areas and principal cities). The prevalence of food insecurity in principal cities had begun to decline, from 17.7 percent in 2008 to 16.7 percent in 2013. However, food insecurity in rural counties continued to increase after the recession officially ended, from 14.2 percent in 2008 to 15.1 percent in 2013. This increase in rural food insecurity is counter to the trend observed immediately after the recession when rural counties appeared less affected by rising food insecurity rates than urban areas (Coleman-Jensen 2012). It appears that the recession may have had a less immediate effect in rural areas, but food insecurity in rural areas continued to worsen after the official end of the recession. There is evidence that economic recovery in rural counties has lagged behind the recovery in urban areas. Rural employment gains since the recession have been lower than employment growth in urban areas, and in mid-2015 rural employment remained below the prerecession employment peak in 2007. Meanwhile, urban employment growth has been consistently rising and by mid-2015 had far surpassed the prerecession urban employment peak (Kusmin 2015). Nationally, trends in employment are closely linked to trends in food insecurity (Nord, Coleman-Jensen, and Gregory 2014). This important relationship is borne out in rural areas.
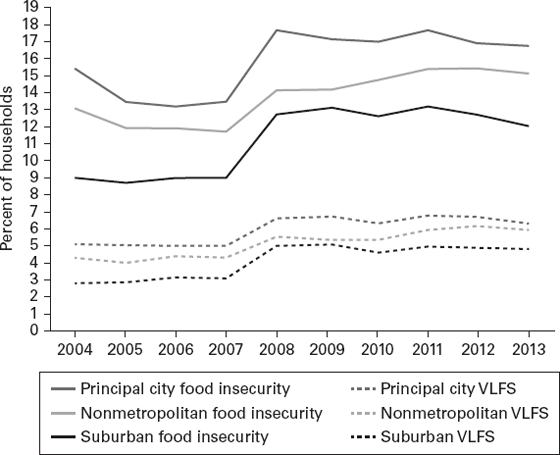
Figure 10.4 Trends in the prevalence of food insecurity and very low food security (VLFS) in U.S. households, 2004–2013.
Source: Calculated by USDA, Economic Research Service, using data from the Current Population Survey Food Security Supplement, 2004–2013.
Food security statistics by area of residence for 2014 are not precisely comparable to those for 2013. Therefore, changes from 2013 in the prevalence of food insecurity by area of residence should be interpreted with caution (Coleman-Jensen et al. 2015). In 2014, 17.1 percent of households in rural counties were food insecure (table 10.1). Of these, 7.3 percent were in the severe range of food insecurity described as very low food security. Across the residence area classifications, food insecurity was highest in rural counties (labeled nonmetropolitan in table 10.1), intermediate in principal cities (15.7 percent), and lowest in suburbs and other urban areas outside principal cities (11.8 percent; labeled metropolitan, not in principal cities).
Table 10.1 Prevalence of Food Insecurity and Very Low Food Security by Residence Area and Selected Household Characteristics (% of Households), 20141
| Category |
Metropolitan, in principal cities |
Metropolitan, not in principal cities |
Nonmetropolitan |
| Food insecure |
Very low food secure |
Food insecure |
Very low food secure |
Food insecure |
Very low food secure |
| All households |
15.7S |
5.9S |
11.8 |
4.8 |
17.1C,S |
7.3C,S |
|
Household composition2 |
| With children <18 years |
22.3S |
6.8S |
15.4 |
4.9 |
23.6S |
7.6S |
| Married-couple families |
14.3S |
2.9 |
10.0 |
2.8 |
17.9C,S |
4.3C,S |
| Female head, no spouse |
37.1S |
13.7 |
31.7 |
12.0 |
36.0 |
12.5 |
| Male head, no spouse |
23.00 |
7.3 |
18.7 |
4.6 |
24.0 |
14.4C,S |
| With no children <18 years |
12.8S |
5.5S |
9.9 |
4.8 |
14.4C,S |
7.1C,S |
| More than one adult |
11.1S |
4.6S |
8.1 |
3.7 |
11.5S |
5.1S |
| Women living alone |
15.3 |
6.5 |
13.9 |
7.0 |
19.9C,S |
9.8C,S |
| Men living alone |
14.2 |
6.7 |
12.3 |
6.6 |
17.2C,S |
10.4C,S |
| With elderly |
11.5S |
4.2S |
7.6 |
2.7 |
10.1S |
3.8S |
| Elderly living alone |
10.2 |
4.4 |
8.2 |
3.4 |
11.4S |
4.8 |
| Race/ethnicity of households |
| White non-Hispanic |
9.2 |
3.8 |
8.7 |
3.9 |
14.9C,S |
6.8C,S |
| Black non-Hispanic |
28.4S |
11.9S |
22.0 |
9.0 |
29.1S |
8.7C |
| Hispanic3 |
22.4 |
6.7 |
21.2 |
6.7 |
27.2C,S |
8.8C |
| Other non-Hispanic |
9.0 |
2.6S |
9.8 |
4.6 |
25.2C,S |
12.4C,S |
| Household income-to-poverty ratio |
| Under 1.00 |
39.0 |
16.6 |
38.3 |
18.0 |
41.1 |
19.8C |
| Under 1.30 |
37.1 |
15.5 |
36.1 |
16.6 |
38.9 |
18.6C |
| Under 1.85 |
33.9 |
14.0 |
32.6 |
14.4 |
34.3 |
15.4 |
| 1.85 and over |
7.3S |
2.1 |
5.6 |
2.1 |
7.0S |
2.4 |
| Income unknown |
11.4S |
4.2 |
9.0 |
3.3 |
10.7 |
4.3 |
| Census geographic region |
| Northeast |
17.6S |
6.1S |
10.7 |
4.4 |
14.4S |
6.1S |
| Midwest |
18.6S |
6.9S |
10.6 |
4.8 |
14.8C,S |
6.8S |
| South |
15.2S |
6.3 |
13.2 |
5.5 |
19.5C,S |
7.8C,S |
| West |
13.5S |
4.9S |
11.3 |
4.0 |
17.2C,S |
7.4C,S |
Source: Calculated by author using data from the USDA Economic Research Service, Current Population Survey Food Security Supplement, December 2014.
S = Prevalence estimate is significantly different from corresponding prevalence estimate for suburban areas, “Metropolitan, not in Principal Cities,” at the 90-percent confidence level.
C = Prevalence estimate is significantly different from corresponding prevalence estimate for “Metropolitan, in Principal Cities,” at the 90-percent confidence level.
1 Metropolitan area residence is based on 2013 Office of Management and Budget Delineation. Sample sizes (N) by residence area are 10,443 households in principal cities; 15,288 metropolitan households not in principal cities; 9,667 households in nonmetropolitan areas. N’s exclude households for which food security status is unknown (0.2 percent of all households).
2 A residual category, “other household with child,” is not shown due to small sample sizes.
3 Hispanics may be of any race.
The prevalence of food insecurity varies substantially not only across place but also across population subgroups. The prevalence of food insecurity tends to be higher in single-parent families and low-income families than in married-couple families and higher-income families. Similar patterns in the incidence of food insecurity by household characteristic emerge within each of the three residence areas.
Comparing across residence areas by household characteristics, food insecurity rates tended to be highest among those in rural counties. In 2014, food insecurity was higher among married couples with children in rural counties than among married couples with children in suburban or principal city areas. Single-mother households residing in rural areas and principal city areas were worst off, with food insecurity rates of 36 and 37 percent, respectively (table 10.1). Women and men living alone experienced the highest food insecurity rates when they lived in rural areas. The elderly face higher food insecurity rates in rural and principal city areas than in suburban areas.
Across all residence areas, minority groups had higher food insecurity rates than non-Hispanic whites in 2014. Non-Hispanic blacks had similar food insecurity rates in principal cities and rural counties (about 29 percent). Non-Hispanic whites, Hispanics, and other non-Hispanics all faced higher food insecurity rates in rural counties than in urban areas. Other non-Hispanics had particularly high food insecurity prevalence rates in rural areas. Fully one-quarter of other non-Hispanics face food insecurity. Other non-Hispanics in rural areas are primarily Native Americans or Alaskan Natives.6 Other research has shown very high food insecurity rates on rural Native American reservations (Bauer et al. 2012). High food insecurity prevalence rates among Native Americans are likely related to high poverty rates.
Across all residence areas, households with incomes below or near the federal poverty line face higher food insecurity rates than higher-income households. Within each income category, there were not significant differences in the prevalence of food insecurity by residence area in 2014. Food insecurity was experienced by about four in ten households living with incomes below the poverty line. In 2014, the federal poverty line was $24,008 for a family of two adults and two children. Poverty is clearly an important risk factor for food insecurity given the high incidence of food insecurity among those with incomes below the poverty line.
In the South and the West, food insecurity was more prevalent in rural counties than in principal city or suburban areas. In the Midwest, food insecurity was most prevalent in principal cities.
FACTORS RELATED TO FOOD INSECURITY
Food insecurity, an indicator of economic hardship, is related to poverty and low-income, as is evident in the statistics discussed previously. A number of other factors also are correlated with food insecurity. A report by Gundersen and Ziliak (2014) reviewed the recent literature on correlates of food insecurity. Research has examined factors related to currently being food insecure, to transitioning into or out of food insecurity, and to persistence of food insecurity. Some factors that have been shown to be particularly important to food insecurity are disabilities, poor physical health, poor mental health and mental illness, unemployment and type of employment, exposure to violence and other negative life events, low education, immigrant status, marital status and family composition, and changes in income. Most individual and household correlates of food insecurity appear to affect food insecurity similarly across residence areas; for example, having an adult with disabilities increases the likelihood of food insecurity regardless of where a household is located.
To understand factors that cause or are associated with food insecurity we must look beyond individuals and families. Local, state, and national conditions also affect a family’s chances that they will be food insecure. Economic conditions, such as the availability of jobs and their wages, and policies such as the availability of public assistance are important predictors of food insecurity. At the national level, unemployment, inflation, and the price of food relative to other goods and services are strong predictors of the national food insecurity rate (Nord et al. 2014). Following the recession that ended in 2009, food insecurity rates appear to have remained relatively high due to high inflation (prices) and high food costs, in particular. These factors offset declines in unemployment. Put another way, as unemployment declined, food insecurity would be expected to decline, but prices increased, forcing families to stretch their incomes further to cover all their expenses. At the state level, numerous factors are associated with increased rates of food insecurity, including low average wages, high unemployment rate, high cost of rental housing, low participation in food assistance programs, and a high tax burden on low-income families (Bartfeld, Dunifon, Nord, and Carlson 2006). At the state and local level, food prices are important to a household’s likelihood of food insecurity (Gregory and Coleman-Jensen 2013). Those in high-food-cost areas have a higher likelihood of food insecurity than similar households in low-food-cost areas. Another local or community-level factor related to food insecurity is the availability of emergency food assistance and local groups working to end hunger in their community (Morton, Bitto, Oakland, and Sand 2005). When food assistance is available, families are less likely to experience food insecurity.
FOOD INSECURITY IN RURAL AREAS
Some factors are particularly relevant to understanding food insecurity in rural areas. By definition, rural areas are sparsely populated, and residents tend to travel greater distances to stores and service providers. Households in rural areas may then face substantial time and financial costs to access food and food assistance. Data on food prices in rural areas across the country are poor because price data tend to be urbancentric. Some research does suggest that rural households often pay higher prices in small local stores or face greater costs to travel to larger stores farther away (Blanchard and Lyson 2002; Hardin-Fanning and Rayens 2015; Zimmerman, Ham, and Frank 2008). Traveling longer distances to a grocery store is related to a greater likelihood of food insecurity, which has an even greater impact for households lacking a vehicle (Stracuzzi and Ward 2010) or facing high gasoline prices (Webber and Rojhani 2010). One characteristic of the rural food environment that limits food access is a lack of a transportation infrastructure for those without a personal vehicle (USDA 2009).
Rural households also may have to travel to access emergency food providers because rural food pantries may have larger service areas and tend to be less formalized than urban emergency food providers (Molnar, Duffy, Claxton, and Bailey 2001). Because emergency food providers are locally run, their characteristics, eligibility guidelines, service hours, and availability vary widely. Rural food pantries may provide a smaller variety of foods, provide less food overall, and may provide food on a less frequent basis than urban pantries because rural pantries are more often volunteer run and do not have dedicated space to store items (Whitley 2013). However, most rural households responding to the CPS-FSS in recent years have indicated that food pantries are available in their local communities and that use of food pantries is as prevalent, or more prevalent, in rural areas as in urban areas (Coleman-Jensen 2012).
An idyllic view of rural America includes gardens, farms, hunting, and fishing as ways for rural families to produce or obtain their own food supply without as much reliance on typical grocery stores. Some research has found that rural low-income households are more likely to garden or receive foods from family’s and neighbors’ gardens than are urban low-income households (Morton et al. 2008). Research indicates that some rural poor families view hunting and fishing as a preferred way to obtain food rather than relying on federal or charitable food assistance (Sherman 2006). However, there are no large-scale studies to show that a significant portion of rural households use these means to cover a significant portion of their dietary needs. Having a garden is not significantly related to household food insecurity when other social and demographic factors are taken into account (Morton et al. 2008; Olson, Rauschenbach, Frongillo, and Kendall 1997). In general, gardening, farming, hunting, and fishing are not likely to make major contributions to improving food security in rural areas. These activities are costly, time-intensive, and skill-intensive and despite financial inputs (purchasing seeds, fishing supplies, etc.) and time investments may not result in significant food production due to factors outside the family’s control (drought, pests, etc.). Community and school gardens, farm-to-fork programs, and farmers’ markets tend to be more urban focused; spreading these programs to rural areas may benefit rural households at risk for food insecurity (Piontak and Schulman 2014).
Rural America is characterized by diversity. Rural counties are spread across the United States, which means that rural counties vary by race/ethnicity of residents, the presence of immigrants and their country of origin, the dominant industry or economic drivers, weather, geography, inequality, food environment, levels of poverty and unemployment, availability of community food assistance, cost of living, and influence of local, state, and federal policies on residents. Given this level of diversity across rural America, the incidence and severity of food insecurity surely differs within and across these rural counties. Local efforts to improve household food security must take the local context into account.
POLICIES AND PROGRAMS TO IMPROVE FOOD SECURITY
The USDA is the primary federal agency responsible for administering programs aimed at improving American diets and reducing food insecurity. The USDA administers fifteen domestic food and nutrition assistance programs, and these programs constitute about three-quarters of USDA’s entire budget. The three largest food and nutrition assistance programs are SNAP (Supplemental Nutrition Assistance Program, formerly food stamps), WIC (Special Supplemental Nutrition Program for Women, Infants, and Children), and the National School Lunch and Breakfast Programs (Oliveira 2015). SNAP provides monthly benefits to households that meet income cutoffs and other eligibility guidelines. SNAP benefits are distributed on electronic benefit transfer (EBT) cards that function as debit cards; households can use the benefits to purchase approved foods at authorized food stores for home preparation. SNAP benefits also can be used to purchase seeds and plants that will produce food for the household to consume. The WIC program enables families with infants, young children, or pregnant/lactating women who are low-income and at nutritional risk to acquire supplemental nutritious food packages at authorized food stores. The program also provides health care referrals and nutrition education to participants. The National School Lunch Program serves nutritious meals to students in both public and private schools. Free or reduced-price lunches are available to low-income students. A number of other food and nutrition assistance programs target specific populations. One such program that is particularly relevant to rural food insecurity is the Food Distribution Program on Indian Reservations (FDPIR). This program provides monthly food packages to income-eligible households. Households cannot participate in both SNAP and FDPIR. FDPIR can be particularly important on Indian reservations where households must travel long distances to reach a food retailer; the food packages are distributed directly without requiring participants to visit a food store.
Research has shown that SNAP ameliorates food insecurity. A variety of different methods and approaches have been used to examine the effect of SNAP participation on household food insecurity. Strong recent evidence finds that SNAP improves household food security (Mabli et al. 2013; Nord and Prell 2011; Ratcliffe and McKernan 2011). SNAP appears to be effective at ameliorating food insecurity in both urban and rural areas. The prevalence of food insecurity decreased among both rural and urban households participating in SNAP for six months. The magnitude of the decline was similar across residence areas (Mabli 2014). Estimated participation rates suggest that SNAP reaches most eligible rural residents. In fiscal year 2013, the SNAP participation rate was about 90 percent among eligible rural residents and 84 percent among eligible urban residents (USDA 2015). This finding is consistent over time (Bailey 2014; McConnell and Ohls 2002). The absolute number of SNAP participants is lower in rural areas than in urban areas, given the smaller rural population, but the participation rate is higher in rural areas.
In qualitative research, the rural poor indicate that they prefer to rely on their earnings rather than government welfare assistance to make ends meet. Making ends meet without assistance is hard to realize as families make trade-offs between equally vital goods, struggle to get enough paid hours at their jobs, or struggle to find a job that pays enough to support a family (Tickamyer and Henderson 2011). Some rural poor residents express reluctance to utilize food assistance because they worry about how they will be perceived by their community members and prefer to rely on other strategies to obtain food (Sherman 2006). As such, in some rural communities, stigma may be a barrier for accessing and using assistance.
Federal food and nutrition assistance are important pieces of the puzzle in combating U.S. food insecurity, but these programs do not function in isolation. Local food assistance programs also are important in reducing poverty and unemployment nationally and locally, increasing incomes, supporting those with disabilities and other health conditions, providing access to physical and mental health services, and ensuring that all communities have access to affordable, healthful food. Finally, the rural poor must be willing to accept assistance when it is needed without risking judgment from their neighbors and communities.
HOUSING INSECURITY
Housing insecurity is another type of economic hardship that can result from poverty or low income. For most U.S. households, shelter is the most costly item in the household budget. After paying for shelter costs, such as rent and utilities, many poor and near-poor households become “shelter poor,” meaning they have little discretionary income left to pay for other crucial needs such as food, health care, transportation, and education (Deidda 2015; Stone 2004). They may not be able to obtain safe and decent housing units within their price range or to maintain suitable indoor environments, putting their families at physical risk. They may have little opportunity to build cash buffers against personal financial crises, increasing their housing insecurity by increasing risk of missed payments, eviction, and homelessness. Housing hardships thus range from spending a large share of income on housing (housing cost burden), to lacking an adequate, stable, and permanent residence (housing insecurity), to completely lacking housing (homelessness). Rural residents are not exempt from such challenges, but they experience them in somewhat different ways than do residents of U.S. metropolitan areas. The housing insecure and the homeless in rural areas face different combinations of challenges and resources than similar individuals in urban areas, and they may be more invisible in the absence of service centers or homeless shelters that draw them together.
Housing is best understood as a somewhat lumpy bundle of services (Mitchell 1985). Any given housing unit offers a package of basic shelter, neighborhood security and amenities, access to transportation and social networks, personal consumption, productivity potential,7 and financial investment potential. Such complexity and the household’s role in choosing units account for the difficulty researchers have had in understanding how the quantity, quality, affordability, and public assistance of housing affect its occupants.
In recent decades, 30 percent of household income has become a conventional rule-of-thumb standard for housing costs that remain “affordable” (Pelletiere 2008). Households paying more than 30 percent of their income are defined as having a housing cost burden. The U.S. Department of Housing and Urban Development (HUD) defines housing costs between 30 and 50 percent of income as a moderate cost burden, and housing costs exceeding 50 percent of income as a severe cost burden (Steffen et al. 2015).
Housing has been recognized as a strong social determinant of health (Cutts et al. 2011). Housing cost, housing problems, neighborhood disorder, residential instability, and homeownership interact in ways that affect child development and well-being (Coley, Kull, Leventhal, and Lynch 2014). Parents may choose to spend a greater fraction of income for housing that offers a better and safer environment for children, but such choices require the sacrifice of other life-enhancing economic goods, especially for poor families. Predicted child achievement scores provide some empirical support for the conventional standard of housing affordability because scores increase as housing expenditures approach 30 percent of income, then decrease as cost burdens worsen (Newman and Holupka 2014).
Elevated housing cost burdens can lead directly to housing insecurity, frequent moves, and forced trade-offs involving crowded or physically inadequate units and deteriorated and hazardous neighborhoods. Housing insecurity is associated with food insecurity, poor health, lower weight, and developmental risk among young children (Cutts et al. 2011; Meyers et al. 1995). By increasing maternal stress, housing insecurity is directly associated with risk of child neglect and abuse (Warren and Font 2015). For poor children, moving three or more times in a child’s first five years is significantly associated with decreases in school readiness as measured by attention problems and internalizing and externalizing behavior (Ziol-Guest and McKenna 2014). Ortiz and Zimmerman (2013) found that, in California, the observed benefits of homeownership for health are insignificant for racial and ethnic minorities even after controlling for socioeconomic status and suggest that lower levels of housing security among these populations may account for such differences. Unexpected health costs are found to be associated with the likelihood of family homelessness, particularly in areas with high housing costs (Curtis, Corman, Noonan, and Reichman 2013). Furthermore, both housing instability and food insecurity are linked with poor access to ambulatory care and high rates of acute care, suggesting that such challenges may lead to delays in seeking health care and lead to more use of acute care (Kushel, Gupta, Gee, and Haas 2006). Families in poverty are particularly susceptible to housing cost burdens and such negative outcomes because, by definition, they have less income to spend on housing.
When families are unable to afford housing, homelessness may result. Homelessness is less common, but still significant, in rural areas. Rural areas had an estimated 14 homeless individuals per 10,000 people in 2007, compared with 29 per 10,000 in urban areas. About 4 percent of the U.S. homeless population was in rural areas in 2007 (Henry and Sermons 2010).8
UNIQUE FEATURES OF RURAL HOUSING MARKETS
Through 2010, rural regions as a whole were continuing to gain population, although diminishing in their share of the U.S. population. From 2010 to 2014, however, rural America experienced its first overall loss of population, posting a net loss of 116,000 people. The population loss occurred in 1,300 rural counties in regions dependent on farming, manufacturing, or resource extraction (Kusmin 2015).
Rural populations have been declining for a longer period in the rural Midwest, central Appalachia, the South, and the midwestern and northeastern Rust Belt (Housing Assistance Council [HAC] 2012). Although a shrinking population can help reduce the demand for affordable housing, the housing stock in such areas tends to be older, less well maintained, and sometimes hazardous or obsolete. Furthermore, population loss has important implications for housing markets because vacant units quickly fall into disrepair.
Homeownership has a robust presence in rural areas. During 2013, a greater proportion of rural households were homeowners (73 percent) than of the nation as a whole (65 percent). Rural homeowners are more likely to be free of mortgage debt (48 percent) than the nation as a whole (36 percent), and their median remaining mortgage principal is less at $80,000 than the $121,324 in the nation as a whole. Several factors contribute to more prevalent homeownership in rural areas. Home prices are lower, reflecting the lower land values. During 2013, the median estimated value of owner-occupied dwellings was $120,000 in rural areas, compared with $160,000 nationwide. This difference reflects greater affordability: although the median home value in rural areas was 75 percent of the national median, the median household income in rural areas was 85 percent of the national median. A greater proportion of housing units are single-family detached structures: 72 percent in rural areas versus 64 percent nationwide. Even renters in rural areas are twice as likely to live in single-family units (43 percent) than are urban renters (HAC 2012).9
Despite typically lower housing costs in rural areas, those living in poverty may be unable to afford to purchase homes. In 2014, the personal poverty rate in rural areas was 16.5 percent, compared with 14.8 percent nationwide (DeNavas-Walt and Proctor 2015). A greater proportion of rural renters are in poverty than rural homeowners. Poverty rates among rural renters, at one-third, are much greater than they are for rural homeowners, with only 7 percent poverty (HAC 2012, 37).
Manufactured housing accounts for part of the greater homeownership rate and the single-family dwelling share in rural areas. It is an important source of rural housing, especially for poor households. Manufactured housing represents 5 percent of the occupied U.S. housing stock, but almost 13 percent within rural areas. Of the nation’s 5.9 million occupied manufactured housing units in 2013, the majority (53 percent) were in the South. Homeowners occupied 77 percent of such units and renters 23 percent. Manufactured homes struggled against a bad reputation for decades, but safety, durability, and energy efficiency of the stock has increased dramatically since HUD began regulating manufactured housing in 1976.10 Of the nation’s 5.9 million occupied manufactured housing units in 2013, only 1 percent were reported with severe physical problems and another 4 percent with moderate physical problems; these rates differ little from those of standard site-built housing stock.11 Improved quality and designs have helped make manufactured housing an attractive low-cost alternative to renting, but manufactured homes nevertheless lose value and offer little inherent asset-building potential without ownership of the underlying land (Boehm and Schlottman 2004).
The Housing Assistance Council (2012) highlights unique housing challenges that pertain to certain distressed rural regions. Such areas include the “colonias” settlements along the Mexican border that lack basic infrastructure, the farmworker housing of California’s Central Valley, the flood-prone areas of the Lower Mississippi Delta, and remote tribal areas that have inadequate and crowded conditions. Other rural areas involved in oil and gas fracking face shortages of affordable housing that reach critical levels, but this potentially could wane when the drilling boom ends. Scenic rural areas such as the Rocky Mountains or southern Appalachia also are experiencing population growth, as are Sunbelt areas that continue to experience retiree migration (Kusmin 2015). Such upper-income migration could increase housing insecurity among lower-income residents who face rising home costs or displacement.
DEFINING AND MEASURING WORST-CASE HOUSING NEEDS
For more than twenty years, HUD has regularly measured and reported to Congress on severe housing problems that occur among renter households with very low incomes (less than 50 percent of area median income [AMI]), which qualify them for admission to federal housing assistance programs. For perspective, there were 3.4 million very low income renters in rural areas in 2013, constituting 14.8 percent of rural households.
HUD defines “worst case housing needs” as very low income renters who do not receive housing assistance and who have either a severe cost burden or live in a severely deficient housing unit. Over time, worst case needs have been increasingly dominated by severe rent burdens, which are present in almost 97 percent of worst case needs cases. About 6 percent of worst case needs cases have severe physical housing deficiencies, but only 3 percent of worst case needs result from deficiencies alone (Steffen et al. 2015).
Worst case needs increased dramatically across the nation in the past decade. Following the recession of 2007–2009, home mortgage foreclosures, job losses, and shrinking household incomes combined to increase the number of very low income renters, straining the already inadequate supply of affordable units and driving up rental costs. As a result, the number of worst case needs hit 8.5 million in 2011 before decreasing to 7.7 million in 2013 (table 10.2). Yet worst case needs were increasing even before the recession. During the ten-year span between 2003 and 2013, the tally increased 49 percent—five times the 10 percent increase in the number of U.S. households.12
Table 10.2 Very Low Income Renters and Those with Worst Case Needs, Nationwide and in Nonmetropolitan Areas, 2003–2013
| |
2003 |
2005 |
2007 |
2009 |
2011 |
2013 |
| All very low income renters (thousands) |
15,658 |
16,072 |
15,940 |
17,118 |
19,266 |
18,501 |
| All worst case needs (thousands) |
5,175 |
5,992 |
5,905 |
7,095 |
8,475 |
7,721 |
| Prevalence of worst case needs |
33.1% |
37.3% |
37.0% |
41.4% |
44.0% |
41.7% |
| Nonmetropolitan very low income renters (thousands) |
2,686 |
3,149 |
5,239 |
6,119 |
3,358 |
3,416 |
| Nonmetropolitan worst case needs (thousands) |
657 |
991 |
2,052 |
2,632 |
1,323 |
1,261 |
| Prevalence of worst case needs |
24.5% |
31.5% |
39.2% |
43.0% |
39.4% |
36.9% |
Source: Calculated by author from HUD reports to Congress on worst case housing needs, tables A-1A, A-6A, A-7 (Steffen et al. 2015).
In rural areas, worst case needs have both increased and decreased more rapidly than in the nation overall. There were 1.3 million very low income renters with worst case needs in rural areas in 2013—almost double (92 percent more than) the 2003 estimate. The statistics in table 10.2 also suggest that the surge in the number of very low income renters during the recession both began sooner and ended sooner in rural areas than it did in the nation as a whole, probably reflecting differences in rural employment markets.
In rural areas during 2013, severe housing problems afflicted 36.9 percent of the 3.4 million very low income renters, 20.1 percent of the 6.2 million renters of all incomes, and 5.5 percent of the 23.1 million households.
HOUSEHOLD TYPES AND POVERTY STATUS
Among the 3.4 million rural very low income renter households in 2013, a plurality of 1.3 million were families with children. Those that had no children included 0.8 million elderly households, 0.3 million other family households, and 1 million other nonfamily households. A majority, 60.8 percent (2.1 million), of very low income renter households in rural areas have extremely low incomes (defined as income not exceeding 30 percent of AMI). This ratio is similar to the 60 percent proportion of all very low income renters in the extremely low income group.
In considering the impact of rural poverty on housing insecurity, it is useful to understand the extent to which households classified as “poor” using the federal poverty threshold overlap with households that HUD classifies as “very low income” or “extremely low income” using AMI-based definitions (which are adjusted for family size). The national median income for a family of four was $64,400 in fiscal year 2013, but only $52,400 in rural areas (HUD 2012). Accordingly, a very low income limit, based on 50 percent of the national rural median, would be $26,200 on average in rural areas. Such a very low income definition only slightly exceeds the four-person poverty threshold of $23,834 in 2013 (U.S. Census Bureau 2013). The extremely low income limit for a family of four, at 30 percent of median, would be $15,720 on average in rural areas, significantly below the poverty threshold, but in high-cost urban areas, the extremely low income limit can exceed the poverty threshold. An estimated 58 percent of very low income renters and 88 percent of extremely low income renters are poor, showing that extremely low income is a good proxy for poverty overall.13
PUBLIC HOUSING ASSISTANCE
Across the nation, most deeply subsidized rental housing is provided by HUD. The Housing Choice Voucher, public housing, and assisted multifamily housing programs assist about 5 million renter households. The subsidies provided through these programs generally reduce the tenant’s rent obligation to 30 percent of household income. In addition to HUD-assisted housing, the USDA’s Rural Housing Service provides about 400,000 units in rural areas through the Section 515 program (HAC 2012). Similar to some of HUD’s assisted multifamily programs, the Section 515 program provides interest credit rate subsidies to support affordable rental housing developments in rural areas. Another 2.2 million units of affordable rental housing have been placed in service through the Low Income Housing Tax Credit (LIHTC) program, of which roughly one-half may receive monthly rental assistance, in some cases including the deep rental assistance of HUD’s Housing Choice Vouchers.14
The availability of housing assistance for very low income renter households is greater in rural areas than in central city and suburban areas,15 and somewhat more prevalent in the Rust Belt regions—the Northeast and Midwest. The scatterplot (figure 10.5) illustrates that availability of housing assistance is inversely associated with the prevalence of worst case housing needs (Steffen et al. 2015). Although this reflects the definition that only unassisted very low income renters can have worst case needs, it also relates to the fact that rapid population growth within Sunbelt regions has occurred during an era of diminished federal resources for expanding housing assistance. Housing assistance has not kept up with growing need in many areas of the country.
Figure 10.5 Geographic shares of worst case needs by prevalence of housing assistance and worst case needs, 2013.
In rural areas in 2015, 25.7 percent of renters with very low incomes received housing assistance, and 41.7 percent were unassisted and had worst case housing needs. The prevalence of housing assistance among rural very low income renters varies substantially across the country, from a low of 24.7 percent in the West to 26.6 percent in the South, 36.0 percent in the Midwest, and 40.0 percent in the Northeast. The prevalence of worst case needs in rural areas displays an inverse relationship, with a low of 30.0 percent in the Midwest, 37.5 percent in the South, 38.5 percent in the Northeast, and 42.7 percent in the West.
AFFORDABLE HOUSING SUPPLY
The principal cause of worst case needs is severe rent burdens that result from a shortage of affordable rental units. Nationwide in 2013, there were only 97.2 affordable units for every 100 very low income renters, and substantially fewer (65.3) affordable units per 100 extremely low income renters (table 10.3). Furthermore, because of suboptimal allocation, a substantial fraction of affordable units is not necessarily available to renters who need them the most. Higher-income renters often occupy less costly units than they can afford, and the most affordable vacant units of decent quality are quickly leased. Nationwide, there were only 65.2 affordable and available units per 100 very low income renters, and 39.0 affordable and available units per 100 extremely low income renters.
Table 10.3 Sufficiency of Affordable Rental Housing Stock, by Residence Area and Relative Income, 2013
| Income |
Income as percent of AMI |
Housing units per 100 households |
| Affordable |
Affordable and available |
Affordable, available, and adequate |
| Central cities |
0–30 |
56.6 |
38.2 |
33.0 |
| |
0–50 |
87.8 |
64.3 |
56.1 |
| |
0–80 |
132.5 |
101.5 |
90.0 |
| Suburbs |
0–30 |
64.4 |
35.3 |
32.5 |
| |
0–50 |
93.5 |
58.8 |
54.0 |
| |
0–80 |
138.4 |
98.1 |
91.1 |
| Nonmetropolitan |
0–30 |
87.5 |
45.3 |
40.7 |
| |
0–50 |
128.2 |
79.0 |
71.1 |
| |
0–80 |
142.0 |
105.9 |
95.9 |
| Total |
0–30 |
65.3 |
39.0 |
34.2 |
| |
0–50 |
97.2 |
65.2 |
58.1 |
| |
0–80 |
136.4 |
101.1 |
91.5 |
Source: HUD report to Congress on worst case housing needs, tables 2.6 and 2.8 (Steffen et al. 2015).
The affordable housing gap is somewhat less severe in rural areas. In 2013, there were 128.2 affordable units in rural areas per 100 very low income renters and 87.5 per 100 extremely low income renters. The ratios of affordable units that were actually available were also less constrained than in the nation overall, with 79.0 units per 100 very low income renters and 45.3 per 100 extremely low income renters. The differences, however, are modest at best. Despite a looser housing market in rural areas than in the nation at large, a majority of the poorest renters in rural areas are forced to accept moderate or severe rent burdens to remain housed.
Severe housing cost burdens contribute greatly to housing insecurity or instability. When gross rent (contract rent plus utilities) consumes more than half of income, households become quite vulnerable to sudden expenses such as medical emergencies and to loss of income due to job layoffs. Such economic shocks can lead to nonpayment of rent and eviction, leaving poor options such as doubling-up with friends and family, which is often a crowded, stressful, and unstable housing situation, or becoming homeless.
EVIDENCE OF HOUSING INSECURITY
American Housing Survey (AHS) trend data suggest that renter evictions waxed and waned with the economic recession, but the changes are not statistically significant. Among renters in rural areas who moved within two years, eviction caused 1.4 percent of moves in 2007 and 2.1 percent in 2009, before declining to 1.1 percent in 2011 and 0.7 percent in 2013 (HUD 2015a).
Mortgage foreclosures also have produced new renter households. Homeownership rates in rural areas have decreased in most years since the 2005 record high of 76.3 percent, reaching 71.6 percent in 2015. The new renters helped absorb vacant rental units in rural areas, reducing the vacancy rate from 10.5 percent to 8.9 percent during the same period (HUD 2016). In 2013, an estimated 1.9 percent of recent-moving renters in rural areas were motivated by foreclosure, not significantly different from the rates of 1.7 percent in the suburbs and 0.8 percent in central cities.16
Among households experiencing severe housing problems, whether severe cost burdens or severe physical problems, housing insecurity is significantly higher. Table 10.4 presents estimates of the proportion of renters and owners that report various precursors and types of housing insecurity, such as missing one rent payment, missing two to three rent payments, having utilities shut off, or being threatened with eviction—as well as the self-reported prevalence of actual eviction or foreclosure. The data include breaks by residence area and household income relative to area median income. The results suggest that the lower incomes associated with poverty generally exacerbate housing insecurity among renters, regardless of residence area, whereas housing insecurity among homeowners may have a different relationship with income. Because of limited sample sizes in rural areas, however, the differences between residence areas and income groups are not statistically significant, so no reliable conclusions can be drawn about such differences.
Table 10.4 Housing Insecurity Reported by Households with Severe Problems, by Residence Area, Tenure, and Relative Income, 2013
Source: HUD-PD&R tabulations of 2013 American Housing Survey data.
Note: Estimates based on fewer than five sampled cases are suppressed because they are unreliable. Foreclosure variables are percentages of owner-occupied homes with a loan secured by the property.
DOUBLING-UP IN RURAL AREAS
The American Housing Survey contains questions that shed light on households who may be doubled-up. According to 2013 AHS data (HUD 2015a), 916,000 households in rural areas (4 percent) had a household member who moved out during the previous twelve months. Some of those move-outs doubtless result from natural family dynamics and household formation, but in 27 percent of those cases the individual had been staying because he or she lacked money or financial support—which is not significantly different for central city or suburban households.17 Among rural households with move-outs, 22 percent had more than one individual staying there. Most move-outs in rural areas, 58 percent, moved to a place of their own, similar to the 57 percent in central cities and 61 percent in the suburbs.
OPTIONS FOR THE HOUSING INSECURE
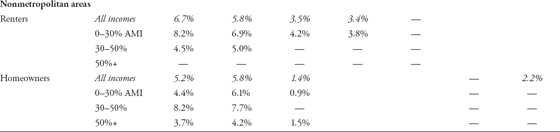
The 2013 AHS also provides insight into where renters think they would go if evicted, and where homeowners who have received a foreclosure notice would go if their loans were actually foreclosed (table 10.5). Homeowners who are facing foreclosure in central cities are significantly more likely than those in suburbs or rural areas to report that they will find a new home of their own (not necessarily an owned home).
Table 10.5 Perceived Housing Options If Households Should Be Evicted or Foreclosed, by Residence Area, Housing Tenure, and Relative Income
| |
Income as percent of AMI |
New home (%) |
Friends (%) |
Family (%) |
Different places (%) |
Shelter (%) |
Not reported (%) |
| Central cities |
|
|
|
|
|
|
|
| Renters |
All incomes |
59.6 |
9.4 |
20.4 |
1.3 |
2.1 |
7.2 |
| |
0–30% AMI |
44.9 |
11.0 |
27.6 |
1.6 |
4.7 |
10.3 |
| |
30–50% |
57.9 |
10.1 |
22.5 |
0.8 |
3.0 |
5.7 |
| |
50%+ |
66.0 |
8.5 |
16.8 |
1.3 |
0.9 |
6.5 |
| Homeowners |
All incomes |
62.8 |
— |
24.4 |
— |
— |
— |
| Suburbs |
|
|
|
|
|
|
|
| Renters |
All incomes |
59.4 |
8.0 |
21.5 |
1.6 |
1.7 |
7.9 |
| |
0–30% AMI |
42.0 |
10.9 |
29.1 |
1.0 |
4.9 |
12.1 |
| |
30–50% |
55.5 |
7.2 |
26.8 |
1.3 |
1.1 |
8.2 |
| |
50%+ |
65.8 |
7.3 |
17.6 |
1.9 |
0.9 |
6.6 |
| Homeowners |
All incomes |
45.0 |
8.6 |
30.4 |
5.2 |
— |
10.3 |
| Nonmetropolitan areas |
|
|
|
|
|
|
|
| Renters |
All incomes |
56.2 |
6.5 |
27.4 |
1.2 |
1.7 |
7.0 |
| |
0–30% AMI |
41.9 |
5.5 |
38.5 |
2.1 |
3.9 |
8.2 |
| |
30–50% |
54.1 |
7.9 |
28.8 |
1.1 |
1.8 |
6.4 |
| |
50%+ |
62.2 |
6.5 |
22.9 |
0.9 |
0.9 |
6.8 |
| Homeowners |
All incomes |
42.8 |
— |
30.8 |
— |
— |
— |
Source: HUD-PD&R tabulations of 2013 American Housing Survey data.
Note: Estimates based on fewer than five sampled cases are suppressed because they are unreliable. Homeowners are included if they reported receiving a foreclosure notice.
Across all residence areas, renters with greater incomes are significantly more likely to think they would simply find a new home. Family, friends, and shelters are common resorts for the poorest families after eviction, but recent ethnographic research has shown that such alternatives do not necessarily increase housing stability (Desmond 2016). The prevalence of the “not reported” response to the AHS seen for extremely low income families suggests the possibility—consistent with Desmond’s findings—that for some of these vulnerable households, typical responses to eviction are not feasible or forethought has not occurred.
Overall, the distribution of perceived housing options for renters in case of an eviction does not differ greatly on the basis of residence area. In each residence area, evicted renters having extremely low incomes are significantly more likely than their higher-income counterparts to rely on their families.
Rural renters overall also express a significantly greater preference than central city or suburban renters for turning to family after eviction. City dwellers are more likely than rural renters to rely on friends.
Homelessness, defined as being forced to sleep in a place not intended for human habitation, is the most extreme variety of housing insecurity. Homelessness in rural areas is somewhat distinct from urban areas. Urban homeless individuals have greater access to shelters and transitional housing than do their rural counterparts. Rural homeless individuals and families may be living in cars, at campgrounds, “couch surfing” among friends or relatives, or doubling-up in the homes of family or friends (Trella and Hilton 2014). As such, rural homelessness tends to be somewhat hidden.
It is difficult to obtain reliable data on homelessness because federal surveys typically rely on address-based samples of respondents. HUD’s Annual Homelessness Assessment Reports (AHAR) use different strategies to summarize the extent and nature of homelessness nationwide. The reports compile two types of data from state and local consortia of homeless service providers known as Continuums of Care (CoCs): annual point-in-time counts of sheltered and unsheltered homeless populations18 and the administrative data that homeless service providers collect about sheltered populations through Homeless Management Information Systems. The 2014 AHAR thus represents the best available data about the state of homelessness, but it has limited information about rural areas because they are captured by CoCs covering the nonurban “balance of state” or entire states. The available data show a diverging trend between homelessness in urban areas and the rest of the country. The national point-in-time count during January 2014 found 578,000 homeless people, including 362,000 individuals and 216,000 people in families (HUD 2015b).
HOMELESS INDIVIDUALS IN THE 2014 POINT-IN-TIME COUNT
Forty-two percent of homeless individuals were unsheltered in 2014. CoCs in the fifty largest cities accounted for the largest share of homeless individuals: 46.1 percent of homeless individuals were found in major cities; 40.6 percent in smaller cities, suburbs, or regional CoCs; and 13.4 percent in the balance of state or statewide CoCs (Henry, Cortes, Shivji, and Buck 2014).
The count of homeless individuals in 2014 was 2 percent less than in 2013 and 13 percent less than in 2007. However, the change between 2013 and 2014 includes a slight increase of 0.4 percent in major cities, offset by decreases of 3.8 percent in the less populous smaller cities, suburbs, or regional CoCs, and of 4.7 percent in the balance of state and statewide CoCs.
HOMELESS FAMILIES IN THE 2014 POINT-IN-TIME COUNT
Homeless people in families were substantially less likely (11.3 percent) to be unsheltered during the count than the homeless individuals were. The distribution of the family homeless across CoC types was similar to homeless individuals: 45.3 percent in major city CoCs; 39.0 percent in smaller cities, suburbs, or regional CoCs; and 15.7 percent in the balance of state and statewide CoCs (Henry, Cortes, Shivji, and Buck 2014).
Like the trend for homeless individuals, the overall 2.7 percent decrease of homeless people in families conceals differences on the urban–rural dimension. Major city CoCs saw a slight increase of 1.2 percent; and the count decreased by 6.7 percent in smaller cities, suburbs, or regional CoCs and by 3.3 percent in the balance of state and statewide CoCs (Henry, Cortes, Shivji, and Buck 2014).
HOMELESS FAMILIES IN ADMINISTRATIVE DATA
Between 2007 and 2014, the number of people in families with children using shelters decreased by 5 percent in cities but increased 48.1 percent in suburban and rural areas. The number of poor families in such areas increased 29.5 percent over the same period. In the shorter period between 2013 and 2014, this sheltered family homelessness measure declined slightly (0.7 percent) in urban areas and increased 14.8 percent in suburban and rural areas (24,000 more individuals) (Solari et al. 2015, 3–12).
The sheltered families with children in suburban and rural areas during 2014 comprised 189,000 individuals, of whom 60.5 percent were children. Of the adults, more than three-fourths, 77.7 percent, were female, and 20.5 percent had a disability. The diversity on the basis of race and ethnicity reflects the economic cause of family homelessness: 38.1 percent white non-Hispanic, 15.9 percent white Hispanic, 34.6 percent black or African American, 3.9 percent other one-race, and 7.6 percent multiple races. Between 2013 and 2014, the black or African American sheltered individuals decreased in number and share, and white non-Hispanic individuals increased in number and share (Solari et al. 2015, 3–13).
As suggested by the AHS data, the homeless report shows that a substantial share of families with children who show up in shelters had been doubled-up: 27 percent of the adults nationwide had been staying with family and 15 percent had been staying with friends; 19 percent had been living in their own rented or owned home; 6 percent had been staying at a hotel or motel; and 24 percent came from an unsheltered situation (Solari et al. 2015, 3–14).
Follow-on research from a HUD-sponsored demonstration of policy options for homeless families with children suggests that those seeking shelter are as connected to the safety net as other deeply poor families and participate in SNAP at similar or higher rates. Among families in shelter in the sampled communities, 88 percent participated in SNAP, compared with 69 percent for families below 50 percent of the poverty line in the same counties. For homeless women with infants, however, families in shelter used WIC at lower rates than other families with eligible children (Burt, Khadduri, and Gubits 2016). Thus, homeless families with children seeking shelter are often connected to other elements of the public safety net such as food and nutrition assistance.
CONCLUSION
The twin forms of material deprivation discussed in this chapter, food insecurity and housing insecurity, share at least one important underlying cause: the insufficient level of household income known as poverty. The work of Ma, Gee, and Kushel (2008) demonstrates the high correlation between food insecurity and housing insecurity using the National Survey of America’s Families. Their analysis of low-income19 families with children finds that 61.9 percent of the severely food insecure have housing instability, and 66.9 percent of those with housing instability have food insecurity.
More empirical research is needed about the interrelationship between housing insecurity and food insecurity, and their causes, outcomes, and geographic distribution. The rapid increase in severe housing cost burdens since the turn of the twenty-first century has drawn awareness in the research and policy community to the need for better definition, standardization, validation, and measurement of housing insecurity in a way that better parallels successes in food insecurity research. Ma et al. (2008) noted that there is no standard definition of housing instability at present; their working definition as “inability to pay mortgage, rent, or utility bills sometime in the prior year” is reasonable for a household with a home, but it does not capture doubling-up or homelessness, for example. This deficiency points to the inherent difficulty of measuring housing instability with a survey of households, or of housing units such as the AHS.
Despite such conceptual challenges, research about the intersection of food insecurity and housing insecurity is poised to advance in the near future. The Food Insecurity module included in the 2015 American Housing Survey should enable analysis of how severe housing cost burdens and other housing problems affect food insecurity, particularly in rural communities. Further, recent linkage of HUD administrative data with two surveys of the National Center for Health Statistics is opening new opportunities to explore the association of housing assistance programs with health and health care access, as well as food insecurity (Lloyd and Helms 2016).
Rural people and households are affected by food insecurity and housing insecurity, just as a notable portion of all American households are. In many ways, the solutions to these problems are the same for both rural and urban families. Federal nutrition and housing assistance certainly play important roles in ameliorating economic hardship for low-income families throughout the country and in rural communities. The nature of rural places creates unique challenges for the rural poor. In rural communities, limited geographic access can affect both housing and food insecurity. Housing insecurity is exacerbated by a lack of affordable rental housing units; food insecurity is exacerbated by a lack of affordable healthy food; and both problems relate to neighborhood characteristics and access. Rural poor families who face deprivation may also have limited access to local social service institutions such as food pantries or transitional housing that can provide immediate assistance to those in need.
Food insecurity and housing insecurity can be addressed by not only focusing on the symptoms of the problems—lack of adequate food and affordable housing for specific families—but also by addressing the underlying social and economic causes of the problems. Poverty and lack of economic opportunity in America’s rural towns and countryside affect families in the most basic ways by limiting their ability to access the necessities of food and housing.
Questions Used to Assess the Food Security of Households in the CPS Food Security Survey
1. “We worried whether our food would run out before we got money to buy more.” Was that often, sometimes, or never true for you in the last 12 months?
2. “The food that we bought just didn’t last and we didn’t have money to get more.” Was that often, sometimes, or never true for you in the last 12 months?
3. “We couldn’t afford to eat balanced meals.” Was that often, sometimes, or never true for you in the last 12 months?
4. In the last 12 months, did you or other adults in the household ever cut the size of your meals or skip meals because there wasn’t enough money for food? (Yes/No)
5. (If yes to question 4.) How often did this happen—almost every month, some months but not every month, or in only 1 or 2 months?
6. In the last 12 months, did you ever eat less than you felt you should because there wasn’t enough money for food? (Yes/No)
7. In the last 12 months, were you ever hungry, but didn’t eat, because there wasn’t enough money for food? (Yes/No)
8. In the last 12 months, did you lose weight because there wasn’t enough money for food? (Yes/No)
9. In the last 12 months did you or other adults in your household ever not eat for a whole day because there wasn’t enough money for food? (Yes/No)
10. (If yes to question 9.) How often did this happen—almost every month, some months but not every month, or in only 1 or 2 months?
[Questions 11–18 were asked only if the household included children age 0–17.]
11. “We relied on only a few kinds of low-cost food to feed our children because we were running out of money to buy food.” Was that often, sometimes, or never true for you in the last 12 months?
12. “We couldn’t feed our children a balanced meal because we couldn’t afford that.” Was that often, sometimes, or never true for you in the last 12 months?
13. “The children were not eating enough because we just couldn’t afford enough food.” Was that often, sometimes, or never true for you in the last 12 months?
14. In the last 12 months, did you ever cut the size of any of the children’s meals because there wasn’t enough money for food? (Yes/No)
15. In the last 12 months, were the children ever hungry but you just couldn’t afford more food? (Yes/No)
16. In the last 12 months, did any of the children ever skip a meal because there wasn’t enough money for food? (Yes/No)
17. (If yes to question 16.) How often did this happen—almost every month, some months but not every month, or in only 1 or 2 months?
18. In the last 12 months did any of the children ever not eat for a whole day because there wasn’t enough money for food? (Yes/No)
Sarah Whitley
This case study is from 2011 in a rural county in Washington State with seventeen towns and a population of approximately 45,000 residents (U.S. Census Bureau 2010). The poverty level was twice the national average, and many of the towns were experiencing population and job opportunity declines, changes in grocery retailing to food deserts, and aging populations. As rural areas experience a lack of employment opportunities, increasing poverty, and declining population totals, communities also often experience local businesses closing, such as retail grocery stores (Blanchard and Lyson 2006; Kaufman 1998, 2000; Lyson and Raymer 2000). Researchers describe “food deserts” as places with no grocery or food retailing or only having a small grocer or convenience store that carries limited and expensive food items (Bitto, Morton, Oakland, and Sand 2003; Morton et al. 2005; Schafft, Jensen, and Hinrichs 2009).
Residents using community food pantries were interviewed. Charlie Wilson1 is a 52-year-old lifelong single-male resident of Cloverdale, and his story illustrates the challenges rural low-income food-insecure individuals face with few community resources available to address hunger. Charlie discusses the changes in the area he has noticed:
The county has changed a lot. Many of the smaller towns, like Cloverdale, had more businesses and more residents, but the area lost a lot of farming jobs. I remember as a kid driving through the different towns and the downtowns were full with different shops and cafes, most have hardly anything left anymore. It’s also hard keeping the younger residents here.
For the majority of his adult life, Charlie farmed the family land passed down to him. Then, in early 2000, a major agricultural accident left him disabled. He reluctantly sold all but two acres of his land to a neighbor. He lives in the home in which he grew up and that his grandparents built, but the house is in need of major repairs. Charlie lives on limited resources and has found it very difficult to acquire enough food to last him through each month:
Things used to be easier when I was still farming, but after the accident I just couldn’t do it anymore. To be honest, I would say that for a while I was depressed because my family had the land for so long and then I lost it [looks down at the floor]. I live on my savings and disability check, but I barely have enough to get me through each month.
Charlie answered some questions about how the issue of food deserts was affecting his food security in the changing rural landscape:
| Q: |
Do you shop in town for your groceries? |
| A: |
When we had a grocery store I shopped in town, but the store closed about two years ago and so now I travel to Point View about 35 miles one-way to get groceries. Point View is the closest place I can get to that has a store with fairly good prices. Cloverdale has one convenient store left, but if you want a gallon of milk you will pay about twice as much as what you can get it for in Point View, and the expiration date is usually pretty close to being up. |
The changing retail environment further challenges Charlie’s ability to deal with his food insecurity. Charlie is living on a limited income, and now that he travels to purchase food the transportation expense cuts into his food budget. He shops once per month, and he has to be extremely strategic about what he buys. He eats more processed food than he would like because the shelf life of processed food is longer and his refrigerator and freezer space is limited.
| Q: |
Do you use any other resources to get food throughout the month? |
| A: |
Yes, once a month Cloverdale has a food give-away at the local Grange community building. As a member of the Grange I used to provide resources [breaks eye contact and looks at the floor]; funny now I am receiving. The give-away is a blessing, but it would be nice if we got more food. Some of my friends told me I should apply for food stamps, but I just can’t make myself do it. I know it might help, but I see and hear how people talk about other folks who use that assistance. |
| Q: |
You’ve heard people talk negatively about residents who use food stamps? |
| A: |
For sure, you go hungry or ask the community for support before accepting government hand-outs. |
Charlie’s reluctance to use food stamps speaks to the stigma this resource symbolizes in this rural setting. Charlie’s views of using public assistance also mirror what other low-income individuals in the county expressed, that while going to a community pantry was embarrassing but necessary, applying for and using food stamps was out of the question.
| Q: |
How much food do you generally get at a give-away? |
| A: |
One grocery bag, but if you have more people in your household then you get a little more food. One problem is [that the pantry] is only one time a month and it’s not enough food to last someone for a week. |
| Q: |
What types of items do you get at the food give-away? |
| A: |
That’s the other thing. It’s a lot of food that is pretty bad for you, I mean nutritionally. You get a couple of cans of vegetables or fruit, which have high sodium or sugar, some cereal, pasta, pasta sauce, usually some sort of canned meat, and then snack items that are not very good for you. Sometimes we get fresh fruits and vegetables, but they are usually close to being rotten. I used to have a garden and would trade vegetables with my neighbors for meat. That all changed when I got hurt, I couldn’t grow vegetables anymore, but my neighbors still gave me meat until they passed away. |
| Q: |
Are there any other food resources you could use in the county? |
| A: |
Other towns have food give-aways, but you are only supposed to go if you live in that town. I usually eat only once or twice a day; that way I have an easier time making it through the month. |
Charlie’s story mirrors many of the food-insecure residents in the county. The community assistance is limited by how often pantries take place and the items offered. Residents also are very reluctant to use food stamps as a strategy to address their hunger, and many participants discussed the challenges of food deserts and traveling farther to acquire food. The limited resources available in the rural setting left many residents in a perpetual cycle of food insecurity and a compromised diet.
1. The views expressed in this chapter are those of the authors and do not necessarily represent any views or policies of the U.S. Department of Housing and Urban Development, the U.S. Department of Agriculture, or the Economic Research Service.
2. In this chapter, residence area geographies supported by available government data are used. The food security and housing security estimates are for metropolitan and nonmetropolitan residence categories. Nonmetropolitan is not technically synonymous with “rural” but rural is used throughout the chapter for simplicity. Rural areas are defined as nonmetropolitan counties, in contrast to suburban areas and principal (or central) cities. Note, however, that metropolitan areas frequently include areas that are “rural” in the sense of being non-urbanized, and nonmetropolitan areas sometimes include micropolitan or other urbanized areas. Because the American Housing Survey used to describe housing characteristics is based on a panel of housing units tracked for several decades, the central city, suburb, and nonmetropolitan geographies presented follow the Metropolitan Statistical Areas defined in 1983 on the basis of the 1980 census. (The AHS for 2015 began a new sample of units.)
3. Each December the Food Security Supplement (FSS) is added to the basic monthly CPS. The monthly CPS includes about 54,000 households and is representative of the U.S. civilian, noninstitutionalized population. In 2014, 43,253 households completed the FSS. Statistics shown were calculated using CPS-FSS weights so the statistics are nationally representative. Standard errors were calculated using balanced repeated replication methods based on replicate weights computed for the CPS-FSS by the Census Bureau.
4. All households respond to ten questions about the household as a whole and adults in the household. Households with children respond to an additional eight questions about children’s food conditions. The food security of each household is determined by the number of affirmative responses to the food security questions (affirmative responses to food-insecure conditions are “often,” “sometimes,” “almost every month,” “some months but not every month,” and “yes”). Households reporting no food-insecure conditions, or only one or two food-insecure conditions, are classified as food secure. Households are classified as food insecure if they report three or more food-insecure conditions. Food-insecure households without children are classified as having very low food security if they report six or more affirmative responses to food-insecure conditions. Food-insecure households with children are classified as very low food secure if they report eight or more conditions.
5. Figure 10.4 only shows food insecurity statistics by residence for the years 2004–2013. Food security prevalence statistics by area of residence are not precisely comparable with those from earlier or later years. Revised metropolitan statistical areas (MSAs) and principal cities within them were delineated by the Office of Management and Budget in 2013, based on revised standards developed by the U.S. Census Bureau in collaboration with other federal agencies. The revised delineations were implemented beginning with the 2014 Current Population Survey Food Security Supplement, so the 2014 food security statistics by area of residence are not precisely comparable with those from earlier years.
6. In these data, 73 percent of rural other non-Hispanics are Native Americans or Alaska Natives. In contrast, about 15 percent of other non-Hispanics in suburbs and 9 percent of principal city other non-Hispanics are Native Americans or Alaska Natives.
7. In 2013, 24 percent of owner-occupied dwellings overall, and 23 percent in rural areas, included one or more rooms used partially or totally for business. American Housing Survey, 2013 National Summary Tables (version 1.2), C-02-OO (HUD 2015a).
8. The most recent available data on homelessness are presented later in this chapter.
9. Homeowner statistics are drawn from the American Housing Survey, 2013 National Summary Tables (version 1.2), C-01-AO, C-01-OO, C-13-OO, and C-14A-OO (HUD 2015a). The median income statistics are from DeNavas-Walt and Proctor (2015), table 1.
10. Despite the improvements to newer manufactured housing stock, 22 percent of the occupied stock predates the 1976 HUD Code, and 66 percent predates the energy efficiency requirements of the 1996 HUD Code update (Talbot 2012).
11. Manufactured housing statistics are drawn from the American Housing Survey, 2013 National Summary Tables (version 1.2), C-01-AO and C-05-AO (HUD 2015a).
12. Estimates drawn from tables A-1a and A-1b of the corresponding Worst Case Needs reports, Steffen et al. (2015), and Hardiman et al. (2005).
13. Author’s calculations from HUD report to Congress on worst case housing needs, tables A-6A, A-6B, A-7, A-8, based on tabulations of the American Housing Survey (Steffen et al. 2015).
14. Of 58.9 percent of LIHTC properties reported by state housing finance authorities in 2012, rental assistance status was reported for 68.5 percent of units, and 53 percent of those units had rental assistance. See tables 1 and 10 of Hollar (2014).
15. In HUD’s classification of nonmetropolitan areas for worst case needs analysis, some rural areas within metropolitan regions are included as suburbs.
16. The authors gratefully acknowledge the assistance of George Carter of HUD’s Office of Policy Development and Research for tabulating American Housing Survey data on recent movers and housing insecurity (tables 10.4 and 10.5). Statements about statistical significance related to tables 10.4 and 10.5 are based on formulas for 90 percent confidence intervals presented in HUD 2015b.
17. AHS 2013 National Summary Tables (version 1.2), S-07-AO (HUD 2015a).
18. The 2014 AHAR (Henry et al. 2014) states: “In 2014, the PIT estimates of both homeless people and beds were reported by 414 Continuums of Care (CoC) nationwide, covering virtually the entire United States. Sheltered counts are mandatory each year, and unsheltered counts are required every other year. Unsheltered counts were not required in 2014. Nonetheless, 323 CoCs (or 78 percent of all CoCs) reported unsheltered counts in 2014. For the CoCs that did not report unsheltered counts, the unsheltered counts from 2013 were rolled over into 2014.”
19. Low-income for this work was defined as less than 200 percent of the federal poverty level.
REFERENCES
Bauer, Katherine W., Rachel Widome, John H. Himes, Mary Smyth, Bonnie Holy Rock, Peter J. Hannan, and Mary Story. 2012. “High Food Insecurity and Its Correlates Among Families Living on a Rural American Indian Reservation.” American Journal of Public Health 102(7):1346–52.
Bitto, Ella A., Lois Wright Morton, Mary Jan Oakland, and Mary Sand. 2003. “Grocery Store Access Patterns in Rural Food Deserts.” Journal for the Study of Food and Society 6:35–48.
——. 2006. “Food Availability and Food Deserts in the Nonmetropolitan South.” Southern Rural Development Center: Food Assistance Policy Brief Series, No. 12. Starkville, MS: Mississippi State University.
Boehm, Thomas P., and Alan Schlottmann. 2004. Is Manufactured Housing a Good Alternative for Low-Income Families? Evidence from the American Housing Survey. Washington, DC: U.S. Department of Housing and Urban Development, Office of Policy Development and Research.
Bread for the World Institute. 2015. “The Nourishing Effect: Ending Hunger, Improving Health, Reducing Inequality, 2016 Hunger Report.” http://hungerreport.org/2016/.
Coleman-Jensen, Alisha. 2012. “Predictors of U.S. Food Insecurity Across Nonmetropolitan, Suburban, and Principal City Residence During the Great Recession.” Journal of Poverty 16(4):392–411.
Coley, Rebekah Levine, Melissa Kull, Tama Leventhal, and Alicia Doyle Lynch. 2014. “Profiles of Housing and Neighborhood Contexts Among Low-Income Families: Links with Children’s Well-Being.” Cityscape: A Journal of Policy Development and Research 16(1):37–60.
Curtis, Marah A., Hope Corman, Kelly Noonan, and Nancy E. Reichman. 2013. “Life Shocks and Homelessness.” Demography 50:2227–53.
Cutts, Diana Becker, Alan F. Meyers, Maureen M. Black, Patrick H. Casey, Mariana Chilton, John T. Cook, Joni Geppert, Stephanie Ettinger de Cuba, Timothy Heeren, Sharon Coleman, Ruth Rose-Jacobs, and Deborah A. Frank. 2011. “U.S. Housing Insecurity and the Health of Very Young Children.” American Journal of Public Health 101(8):1508–14.
Deidda, Manuela. 2015. “Economic Hardship, Housing Cost Burden and Tenure Status: Evidence from EU-SILC.” Journal of Family and Economic Issues 36(4):531–56.
DeNavas-Walt, Carmen, and Bernadette D. Proctor. 2015. “Income and Poverty in the United States: 2014.” Current Population Reports. P60–252. Washington, DC: U.S. Census Bureau.
Desmond, Matthew. 2016. Evicted: Poverty and Profit in the American City. New York, NY: Crown Publishers.
Gregory, Christian A., and Alisha Coleman-Jensen. 2013. “Do High Food Prices Increase Food Insecurity in the United States?” Applied Economic Perspectives and Policy 35(4):679–707.
Hardiman, David, Marge Martin, Mark Shroder, Barry Steffen, Scott Susin, David Vandenbroucke, and David Yao. 2005. Affordable Housing Needs 2003: A Report to Congress on the Significant Need for Housing. Washington, DC: Office of Policy Development and Research, U.S. Department of Housing and Urban Development.
Hardin-Fanning, Frances, and Mary Kay Rayens. 2015. “Food Cost Disparities in Rural Communities.” Health Promotion Practice 16(3):383–91.
Henry, Meghan, Alvaro Cortes, Azim Shivji, and Katherine Buck. 2014. The 2014 Annual Homeless Assessment Report (AHAR) to Congress: Part 1—Annual Point-in-Time Counts. Washington, DC: Office of Community Planning and Development, U.S. Department of Housing and Urban Development.
Hollar, Michael K. 2014. Understanding Whom the LIHTC Program Serves: Tenants in LIHTC Units as of December 31, 2012. Washington, DC: Office of Policy Development and Research, U.S. Department of Housing and Urban Development. www.huduser.gov.
Kaufman, Phil R. 1998. “Rural Poor Have Less Access to Supermarkets, Large Grocery Stores.” Rural Development Perspectives 13:19–26.
——. 2000. “Consolidation in Food Retailing: Prospects for Consumers & Grocery Suppliers.” Agricultural Outlook 273:18–22.
Kushel, Margot B., Reena Gupta, Lauren Gee, and Jennifer S. Haas. 2006. “Housing Instability and Food Insecurity as Barriers to Health Care Among Low-Income Americans.” Journal of General Internal Medicine 21(1):71–77.
Lyson, Thomas, and Annalisa Raymer. 2000. “Stalking the Wily Multinational: Power and Control in the U.S. Food System.” Agriculture and Human Values 17(2):199–208.
Ma, Christine T., Lauren Gee, and Margot B. Kushel. 2008. “Associations Between Housing Instability and Food Insecurity with Health Care Access in Low-Income Children.” Ambulatory Pediatrics 8(1):50–57.
McConnell, Sheena, and James Ohls. 2002. “Food Stamps in Rural America: Special Issues and Common Themes.” In Rural Dimensions of Welfare Reform, ed. Bruce A. Weber, Greg J. Duncan, and Leslie A. Whitener, chap. 14. Kalamazoo, MI: Upjohn Institute.
Meyers, Alan, Deborah A. Frank, Nicole Roos, Karen E. Peterson, Virginia A. Casey, L. Adrienne Cupples, and Suzette M. Levenson. 1995. “Housing Subsidies and Pediatric Undernutrition.” Archives of Pediatric Adolescent Medicine 149(10):1079–84.
Mitchell, J. Paul. 1985. Federal Housing Policy and Programs: Past and Present. New Brunswick, NJ: Center for Urban Policy Research.
Molnar, Joseph J., Patricia A. Duffy, Latoya Claxton, and Conner Bailey. 2001. “Private Food Assistance in a Small Metropolitan Area: Urban Resources and Rural Needs.” Journal of Sociology and Social Welfare 28:187–209.
Morton, Louis Wright, Ella A. Bitto, Mary Jane Oakland, and Mary Sand. 2005. “Solving the Problems of Iowa Food Deserts: Food Insecurity and Civic Structure.” Rural Sociology 70:94–112.
——. 2008. “Accessing Food Resources: Rural and Urban Patterns of Giving and Getting Food.” Agriculture and Human Values 25:107–19.
Newman, Sandra J., and C. Scott Holupka. 2014. “Housing Affordability and Child Well-Being.” Housing Policy Debate. doi: 10.1080/10511482.2014.899261.
Olson, Christine M., Barbara S. Rauschenbach, Edward A. Frongillo Jr., and Anne Kendall. 1997. “Factors Contributing to Household Food Insecurity in a Rural Upstate New York County.” Family Economics and Nutrition Review 10:2–17.
Ortiz, Selena E., and Frederick J. Zimmerman. 2013. “Race/Ethnicity and the Relationship Between Homeownership and Health.” American Journal of Public Health 103(4):122–29.
Pelletiere, Danilo. 2008. “Getting to the Heart of Housing’s Fundamental Question: How Much Can a Family Afford?” Washington, DC: National Low Income Housing Coalition.
Piontak, Joy Rayanne, and Michael D. Schulman. 2014. “Food Insecurity in Rural America.” Contexts 13(3):75–77.
Ratcliffe, Caroline, and Signe-Mary McKernan. 2011. “How Much Does the Supplemental Nutrition Assistance Program Reduce Food Insecurity?” American Journal of Agricultural Economics 93(4):1082–98.
Schafft, Kai A., Eric B. Jensen, and Clare Hinrichs. 2009. “Food Deserts and Overweight Schoolchildren: Evidence from Pennsylvania.” Rural Sociology 74:153–77.
Sherman, Jennifer. 2006. “Coping with Rural Poverty: Economic Survival and Moral Capital in Rural America.” Social Forces, 85(2):891–913.
Solari, Claudia D., Stephanie Althoff, Korrin Bishop, Zachery Epstein, Sean Morris, and Azim Shivji. 2015. The 2014 Annual Homeless Assessment Report (AHAR) to Congress: Part 2—Estimates of Homelessness in the United States. Washington, DC: Office of Community Planning and Development, U.S. Department of Housing and Urban Development. https://www.hudexchange.info/hdx/guides/ahar/.
Steffen, Barry L., George R. Carter, Marge Martin, Danilo Pelletiere, David A. Vandenbroucke, Yunn-Gan David Yao. 2015. Worst Case Housing Needs: 2015 Report to Congress. Washington, DC: Office of Policy Development and Research, U.S. Department of Housing and Urban Development.
Stracuzzi, Nena, and Sally Ward. 2010. “What’s for Dinner? Finding and Affording Healthy Foods in New Hampshire Communities.” New England Issue Brief No. 21. Durham, NH: University of New Hampshire, Carsey Institute.
Talbot, Jacob. 2012. “Mobilizing Energy Efficiency in the Manufactured Housing Sector.” American Council for an Energy Efficient Economy Report No. A124. http://aceee.org/research-report/a124.
Tickamyer, Ann R., and Debra A. Henderson. 2011. “Livelihood Practices in the Shadow of Welfare Reform.” In Economic Restructuring and Family Well-Being in Rural America, ed. Kristin E. Smith and Ann R. Tickamyer, chap. 16. University Park: Pennsylvania State University Press.
Trella, Deanna L., and Timothy P. Hilton. 2014. “‘They Can Only Do So Much’: Use of Family While Coping with Rural Homelessness.” Contemporary Rural Social Work 6:16–39.
U.S. Department of Agriculture. 2009. “Access to Affordable and Nutritious Food: Measuring and Understanding Food Deserts and Their Consequences.” Administrative Publication No. AP-036. Washington, DC: U.S. Department of Agriculture, Economic Research Service. http://www.ers.usda.gov/Publications/AP/AP036/AP036.pdf.
——. 2015. “Trends in Supplemental Nutrition Assistance Program Participation Rates: Fiscal Year 2010 to Fiscal Year 2013.” Nutrition Assistance Program Report Series, Office of Policy Support. Washington, DC: U.S. Department of Agriculture, Food and Nutrition Service. http://www.fns.usda.gov/sites/default/files/ops/Trends2010-2013.pdf.
U.S. Department of Housing and Urban Development. 2016. “U.S. Housing Market Conditions: Ownership and Vacancy Data.” Washington, DC: U.S. Department of Housing and Urban Development, Office of Policy Development and Research. https://www.huduser.gov/portal/ushmc/hi_HOR.html.
Warren, Emily J., and Sarah A. Font. 2015. “Housing Insecurity, Maternal Stress, and Child Maltreatment: An Application of the Family Stress Model.” Social Service Review 89(1):9–39.
Webber, Caroline B., and Arezoo Rojhani. 2010. “Food or Fuel: Rising Gasoline Prices and Food Access Among WIC Families in Nonmetropolitan Southwest Michigan.” Journal of Hunger and Environmental Nutrition 5(4):484–97.
Whitley, Sarah. 2013. “Changing Times in Rural America: Food Assistance and Food Insecurity in Food Deserts.” Journal of Family Social Work 16(1):36–52.
Zimmerman, Julie N., Sunny Ham, and Sarah M. Frank. 2008. “Does It or Doesn’t It? Geographic Differences and the Costs of Living.” Rural Sociology 73(3):463–86.
Ziol-Guest, Kathleen M., and Claire C. McKenna. 2014. “Early Childhood Housing Instability and School Readiness.” Child Development 85(1):103–13.