Chapter 10
Online, email and mobile metrics
Key concepts covered in this chapter:
Introduction
In this chapter, we focus on metrics used in Web-based and other marketing efforts enabled by the widespread use of information technology. The Internet increasingly provides valuable opportunities to augment traditional broadcast and print advertising with interactive media. In fact, many advertising media terms, such as impressions, are used to describe and evaluate Web-
based advertising while other terms, such as clickthrough, are unique to the Web. Certain Web-specific metrics are needed because the Internet, like direct mail, serves not only as a communications medium, but also as a direct sales channel that can provide real-time feedback on the effectiveness of advertising in generating customer interest and sales.
The potential of the Internet for marketers is easy to see. With respect to metrics, the Internet provides an extremely rich source of data. Indeed marketers working in this area often have a profusion of data sources unlike many in traditional areas of marketing. Lots of data is only useful if marketers know what to do with it. This chapter outlines some key metrics and the strengths and weaknesses of these metrics.
Impressions, pageviews and hits
As noted in
Chapter 9
, impressions represent the number of opportunities that have been presented to people to see an advertisement. The best available measures of this figure use technology in an effort to judge whether a given advertisement was actually seen. But this is never perfect. Many recorded impressions are not actually perceived by the intended viewer. Consequently, some marketers refer to this metric as opportunities-to-see.
In applying this concept to Internet advertising and publishing, pageviews represent the number of opportunities-to-see for a given Web page. Every Web page is composed of a variety of individual objects and files,
which can contain text, images, audio, and video. The total number of these files requested in a given period is the number of hits a Web site or Web server receives. Measuring hits has largely been abandoned because pages composed of many small files generate numerous hits per pageview giving an overly positive view of consumer activity.
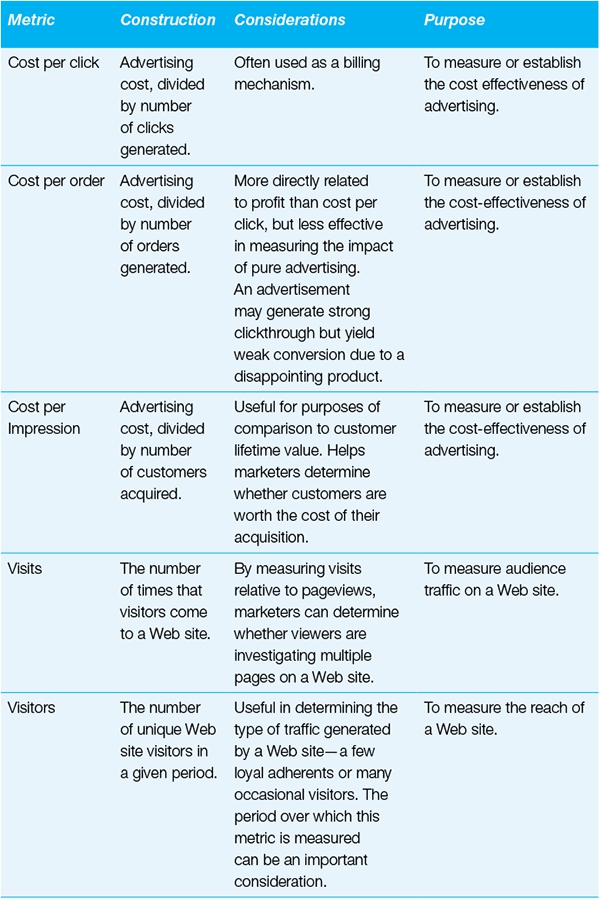
Purpose: to assess Web site traffic and activity.
To quantify the traffic a Web site generates, marketers monitor pageviews—the number of times a page on a Web site is accessed. In the early days of e-commerce, managers paid attention to the number of hits a Web site received. Hits measure file requests. Because Web pages are composed of numerous text, graphic and multimedia files, the hits pages receive are a function not only of pageviews, but also of the way those pages were composed by their Web designer. As marketing on the Internet has become more sophisticated, better measures of Web activity and traffic have evolved. As hits can be influenced by Web page design, this measure is unhelpful and old fashioned and it is now much more common to use pageviews to measure traffic at a Web location.
Pageviews aim to measure the number of times a page has been displayed to a user. It should be measured as close to the end user as possible. The best technology counts pixels returned to a server, confirming that a page was properly displayed. This pixel
1
count technique yields numbers closer to the end user than would a tabulation of requests to the server, or of pages sent from the server in response to a request. Good measurement can mitigate the problems of inflated counts due to servers not acting on requests, files failing to serve on a user’s machine, or users terminating the serving of ads.
Pageviews
The number of times a specific page has been displayed to users. This should be recorded as late in the page-delivery process as possible in order to get as close as possible to the user’s opportunity to see. A page can be composed of multiple files.
A further distinction needs to be made as to how many times an advertisement was viewed by unique visitors. A marketer is typically interested in how many people viewed an advertisement and the technology to serve different ads to different visitors is widely available. For example, two individuals entering a Web page from two different countries might receive the page in their respective languages and will also probably receive different advertisements. One example of an advertisement that is commonly displayed differently to different visitors is an embedded link with a banner ad. Recognising this potential for variation, advertisers want to know the number of times that their specific advertisement was displayed to visitors rather than just the site’s number of pageviews.
With this in mind, Internet advertisers often perform their analyses in terms of impressions—sometimes called ad impressions or ad views. These represent the number of times an advertisement is served to visitors, giving them opportunities to see it. (Many of the concepts in this section are in line with the terms covered in
Chapter 9
, “
Advertising metrics
.”) Of course, if a page carries multiple advertisements, the total number of all ad impressions will exceed the number of pageviews.
Major Web sites will have an ad server involved in presenting advertisements. The ad server can control who sees what and may serve different ads to different visitors or multiple ads to a single visitor. This can get surprisingly complex and technical issues, such as the page refreshing, may complicate the data. Given the variety of ways the advertisement can be seen, it can be a challenge to reconcile the data between the Web site and ad server.
Construction
Hits
A count of the number of files served to visitors on the Web. Because Web pages often contain multiple files, hits is a function not only of pages visited, but also of the number of files on each page. While we detail this metric given its major historical significance, hit counts are likely to be more relevant to technicians responsible for planning server capacity than to marketers interested in measuring visitor activity.
Example: If a Web site served three files per page and generated 300,000 pageviews, then hits would total 3 * 300,000 = 900,000.
Pageviews
The number of pageviews can be easily calculated by dividing the number of hits by the number of files on the page.
Example: There are 250,000 hits on a Web site that serves five files each time a page is accessed. Pageviews = 250,000/5 = 50,000.
Data sources, complications and cautions
Pageviews, page impressions and ad impressions are measures of the responses of a Web server to page and ad requests from users’ browsers, filtered to remove robotic activity and error codes prior to reporting. These measures are recorded as close as possible to the user’s opportunity to see the page or ad to most accurately capture the opportunities.
2
For very simple Web sites a count of ad impressions can be derived from pageviews if the percentage of pageviews that contain the ad in question is known. For example, if 10% of pageviews receive the advertisement for a luxury car, then the impressions for that car ad
will equal 10% of pageviews. Such simple Web sites that serve the same advertisement to all Web users are easy to monitor, but for most marketers working in major firms life is more challenging. They typically work with ad servers that will have their own reporting systems to cope with the measurement problems.
The impression-based metrics quantify opportunities-to-see; they do not take into account the number of ads actually seen or the quality of what is shown. In particular, these metrics do not account for the following:
- Whether the message appeared to a specific, relevant, defined audience.
- Whether the people to whom the pages appeared actually looked at them.
- Whether the advertisement was clearly visible. The term “below the fold,” borrowed from newspapers, is used to describe advertisements on a page that are not visible in the initial display of the page. Generally, if visitors must scroll to see the advertisement they are less likely to be influenced by it.
- Whether those who looked at the page had any recall of the page’s content, or of any advertising messages contained on it, after the event.
Despite the use of the term “impression,” these measures do not tell a business manager about the effect that an advertisement has on potential customers, i.e., whether the advertisement actually made an impression on the potential customer. Marketers can’t be sure of the effect that pageviews have on visitors.
Finally, often pageview results will consist of data that include duplicate showings to the same visitor. For this reason, the term gross impressions may be used instead to highlight what is often a key point—that opportunities-to-see may be delivered to the same viewer on multiple occasions.
Rich media display time and interaction
rate
Marketers use the rich media display time metric to monitor how long their advertisements are holding the attention of potential customers.
Rich media display time represents an important way of tracking the success of Internet advertising.
Marketers use the rich media interaction rate to assess the effectiveness of a single rich media advertisement in generating engagement from its viewers.
Rich media interaction rate represents an important way of tracking the success of Internet advertising in that it monitors the fraction of impressions that generate interaction on the part of the viewer.
Purpose: to determine how an advertisement engages viewers.
Rich media is a term used for interactive media that allow consumers to be more actively engaged than they might be with a billboard, a TV advertisement or even a static display Web advertisement. Rich media metrics, or Audience Interaction Metrics, are very similar in principle to other advertising metrics. Marketers want to track whether the advertisement is effective at grabbing and maintaining the attention of potential customers and so they track how long people spend “viewing” the advertisement as a proxy for how interested they are in the content of the
advertisement. The rich media display time shows how long, on average, people spend engaged with the rich media.
The rich media interaction rate tracks how actively involved potential consumers are with an advertisement. The big advantage of rich media is the ability of viewers to interact with it. Marketers using rich media can have a much better idea of potential customers’ reactions to an advertisement simply because these interactions are counted. They can monitor whether potential customers are simply passively “viewing” the media on their screen or are actively engaged by taking some traceable action. A user who interacts is showing evidence of being more actively engaged and is thus probably more likely to move toward purchase.
Construction
Average rich media display time
Rich media display time is simply the average time that viewers spent with the rich media of an advertisement. For this the marketer will need the total amount of time spent with the rich media and the total number of times that the rich media was displayed. It is a simple matter to create an average time in seconds spent with the rich media by dividing the total amount of time in seconds spent by the total number of impressions.
Rich media interaction rate
This metric is the number of impressions of an advertisement that were interacted with divided by the total number of impressions of that advertisement. It tells the marketers how successful any advertisement was at getting potential customers to engage with it in some way, (mouse rollover, click on, deliberately starting a video, etc.). As an example, a rich media advertisement that was displayed 100 times with an interaction rate of 15% would mean that 15 of the impressions resulted in some kind of interaction whereas 85 resulted
in no interaction.
Data sources, complications and cautions
As with many Web-based metrics, data often seem abundant to marketers who come from the offline world. However, there are several measurement issues the marketer must address in order to convert the abundance of data into useful metrics (i.e., to information and eventually to knowledge). For example, marketers usually cut display times off at some upper bound; that is, if the piece of rich media has been displayed for five minutes, it is safe to assume the viewer has probably gone to make a cup of coffee or been otherwise distracted. The question of how long a displayed piece of rich media was actually viewed has some similarities to the question offline marketers face with respect to whether an offline advertisement was viewed. A slight advantage here goes to the rich online media in that most displays of rich media begin because of an active request of the viewer… whereas no such action is required offline.
Rich media display time, because it usually deals with short periods of time, can be influenced by unusual events. Take a simplified example: If five people see the rich media display for one second each and one person sees it for 55 seconds, the (average) rich media display time is ten seconds. There is no way to distinguish this average display time from the average time generated by six moderately interested viewers each viewing the advertisement for ten seconds. Such is the case with any average.
Marketers should be clear that they understand how the data were gathered and be especially aware of any changes in the way the data were gathered. Changes in the way the data were gathered and the metric constructed may be necessary for technological reasons, but
will limit the usefulness of the metric as longitudinal comparisons, i.e., over time, are no longer valid. At a minimum, the marketer must be aware of and account for measurement changes when interpreting the metric.
Data for the rich media interaction rate will typically be available. Indeed the metric itself might be reported as part of a standard reporting package. One important decision that has to be made in generating the metric is what counts as an interaction. This will depend upon the potential actions that the viewers could take, which in turn depends upon the precise form of the advertisement. What counts as an interaction will usually have some lower bound. For example, an interaction is only counted if the visitor spends more than one second with his mouse over the impression. (This is designed to exclude movements of the mouse unrelated to the advertisement such as moving the mouse over the advertisement to another part of the page.)
As is true of any advertising, marketers should not forget the goal of their advertising. Interaction is unlikely to be an end in itself. As such, a larger interaction rate, which might be secured by gimmicks that appeal to people who will never buy the product, may be no better than a smaller rate if the larger rate doesn’t move the visitor closer to a sale (or some other high order objective).
Related metrics
Rich media interaction time
This metric captures the total amount of time that a visitor spends interacting with an advertisement. This is an accumulation of the total time spent interacting per visit on a single page. On a visit to a page a user might interact with the rich media for two interactions of two seconds each, and so have an interaction time of four seconds.
Video interactions
Video metrics are very similar to rich media metrics. Indeed video can be classified as rich media depending upon the way it is served
to the viewer. Similar principles apply, and the marketer should track how long viewers engage with the video (the amount of time the video plays), what viewers do with the video (pause it, mute it) and the total and specific interactions with the video (which show evidence of attention to the video). Such metrics are then summarised across the entire pool of visitors, (for instance the average visit led to the video being played for 12 seconds).
Clickthrough rates
Clickthrough rate is the percentage of impressions that lead a user to click on an ad. It describes the fraction of impressions that motivate users to click on a link, causing a redirect to another Web location.
Most Internet-based businesses use clickthrough metrics. Although these metrics are useful, they should not dominate all marketing analysis. Unless a user clicks on a “Buy Now” button, clickthroughs measure only one step along the path toward a final sale.
Purpose: to capture customers’ initial response to Web sites.
Most commercial Web sites are designed to elicit some sort of action, whether it be to buy a book, read a news article, watch a music video or search for a flight. People generally don’t visit a Web site with the intention of viewing advertisements, just as people rarely watch TV with the purpose of consuming commercials. As marketers, we want to know the reaction of the Web visitor. Under current technology, it is nearly impossible to fully quantify the
emotional reaction to the site and the effect of that site on the firm’s brand. One piece of information that is easy to acquire, however, is the clickthrough rate. The clickthrough rate measures the proportion of impressions that led to an initiated action with respect to an advertisement that redirected the visitor to another page where they might purchase an item or learn more about a product or service. Here we have used “clicked their mouse” on the advertisement (or link) because this is the generally used term, although other interactions are possible.
Construction
Clickthrough rate
The clickthrough rate is the number of times a click is made on the advertisement divided by the total impressions (the times an advertisement was served).
Clickthroughs
If you have the clickthrough rate and the number of impressions, you can calculate the absolute number of clickthroughs by multiplying the clickthrough rate by the impressions.
Example: There are 1,000 clicks (the more commonly used shorthand for clickthroughs) on a Web site that serves up 100,000 impressions. The clickthrough rate is 1%.
If the same Web site had a clickthrough rate of 0.5%, then there would have been 500 clicks:
If a different Web site had a 1% clickthrough rate and served up 200,000 impressions, there would have been 2,000 clicks:
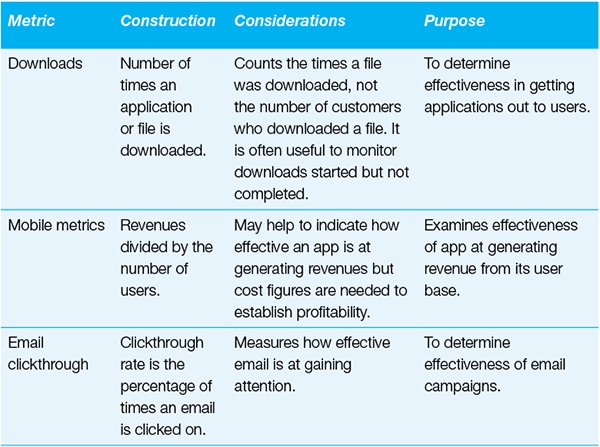
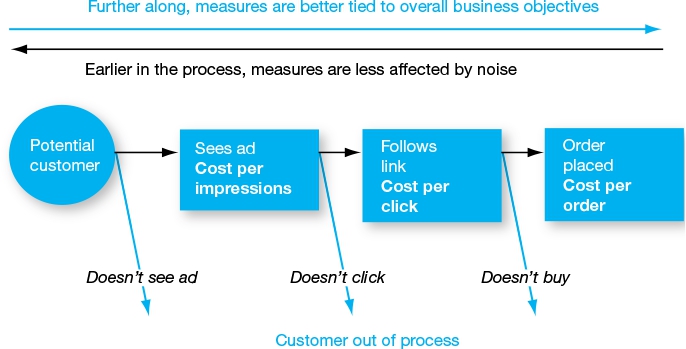
Data sources, complications and cautions
The number of impressions is a necessary input for the calculation. On the very simplest Web sites, this is likely to be the same as pageviews; every time the page is accessed, it shows the same details. On more sophisticated sites, different advertisements can be shown to different viewers meaning the number of impressions of the advertisement cannot simply be estimated from the number of pageviews. The good news is that this metric is usually available as part of a reporting package. For clickthrough rate you also need clicks, and the server can easily record the number of times the link was clicked (see
Figure 10.1
).
Figure 10.1
Clickthrough process
First, remember that clickthrough rate is expressed as a percentage. Although high clickthrough rates might in themselves be desirable and help validate your ad’s appeal, companies will also be interested in the total number of people who clicked through. Imagine a Web site with a clickthrough rate of 80%. It may seem like a highly successful Web site until management uncovers that only 20 people visited the site. Rather than the healthy 80% clickthrough rate, the resulting 16 potential customers who clicked through might be better compared with management’s stated objective of 500 clickthroughs.
Also remember that a click is a very weak signal of interest. Individuals who click on an ad might move on to something else even before the new page is loaded. This could be because the person clicked on the advertisement by accident or because the page took too long to load. This is a problem that is of greater significance with the increase in richer media advertisements. Marketers should understand whether their customers are using devices able to quickly display the requested file. Using large video files is likely to increase the number of people abandoning the process before the ad is served, especially if the potential customers
have slower connections.
As with impressions, try to ensure that you understand the measures. If the measure is of clicks (the requests received from client machines to the server to send a file), then there may be a number of breakage points between the click and the impressions of the ad generated from a returned pixel count. Large discrepancies should be understood—what role is played by technical problems (the size/design of the advertisement) and what is the role of weak interest from clickers?
Clicks are the number of times the advertisement was interacted with, not the number of customers who clicked. An individual visitor can click on an ad several times—either in a single session or across multiple sessions. You will have to investigate your Web analytics package to get a deeper understanding such as how many times an ad was clicked on by someone using the same browser. Furthermore, sophisticated Web sites can control the number of times they show a specific advertisement to the same customer. (A customer who logs onto a site can be tracked which gives more information on what they see.) Finally, the clickthrough rate must be interpreted relative to an appropriate baseline. Clickthrough rates for banner ads are very low and continue to fall. In contrast, clickthrough rates for buttons that simply take visitors to the next page on a site should be much higher. An analysis of how clickthrough rates change as visitors navigate through various pages can help identify “dead end” pages that visitors rarely move beyond.
One can test the effectiveness of various Web page designs by serving different pages randomly. The random serving of pages, when done correctly, allows the marketer to assume that those viewing the page are similar and any differences in reaction can thus be attributed to differences in the Web design.
It is possible to test a range of different sites and variations of content on the sites easily. These are commonly known as A/B tests, or multivariate tests when there is more than one difference. There are now many tools available to help run these tests; e.g., Unbounce,
that are affordable for a wide variety of organisations. In general, best practice is to test to help find the best version of a Web page or advertisement possible.
One useful approach is to classify metrics such as clickthroughs as micro-conversions on the path to the macro-conversion, an eventual purchase. The aim of the firm is not to generate clickthroughs, the micro-conversions, per se but the micro-conversions are a necessary stage in attaining the final aim, the macro-conversion. Describing them as macro- and micro-conversions helps keep the focus on the macro-conversion—the ultimate goal—while still realising that failing on micro goals tends to mean you will ultimately fail on the macro goal.
Cost per impression, cost per click and cost per order
These metrics measure the average cost of impressions, clicks, and customers. All are calculated in the same way—as the ratio of cost to the number of resulting impressions, clicks, or customers.
These metrics are the starting point for assessing the effectiveness of a company’s Internet advertising and can be
used for comparison across advertising media and vehicles.
Purpose: to assess the cost effectiveness of Internet marketing.
In this section, we present three common ways of measuring the cost effectiveness of Internet advertising. Each has benefits depending upon the perspective and end goal of the advertising activity.
Cost per Impression gives the cost to offer potential customers one opportunity to see an advertisement. CPM is the more commonly used version of cost per impression. It is the same metric but using per thousand impressions as the denominator. (For some reason hi-tech people like to use mille, the Latin for thousand, hence the M in CPM.)
Cost per Click gives the average amount spent to get an advertisement clicked. Cost per click has a big advantage over cost per impression in that it tells us something about how effective the advertising was. Clicks are a way to measure attention and interest. An advertisement may look inexpensive in that it has a relatively low CPM. Of course, if the advertisement isn’t relevant it will end up with few clicks and so a high cost per click. Badly targeted adverts can be very expensive as measured by Cost per Click. If the main purpose of an ad is to generate a click, then cost per click is the preferred metric.
Figure 10.2
The order acquisition process
Cost per Order gives the average cost to acquire an order. If the main purpose of the ad is to generate sales, then cost per order is the preferred metric.
A certain number of Web impressions need to be achieved to generate a reasonable number of orders and the quality and placement of the advertisement will affect both click(through) rates and the resulting cost per click (see
Figure 10.2
).
Construction
The formulas are essentially the same for the alternatives; just divide the advertising cost by the appropriate number; for example, impressions, clicks or orders.
Cost per impression
This is derived from advertising cost and the number of impressions.
Cost per impression is typically expressed as cost per thousand impressions (CPM) in order to make the numbers easier to manage (for more on CPM, refer to
Chapter 9
).
Cost per click
This is calculated by dividing the advertising cost by the number of clicks generated by the advertisement.
Cost per order
This is the cost to generate an order. The precise form of this cost depends on the industry and is complicated by product returns and multiple sales channels. That said the basic formula is
Example An Internet retailer spent $24,000 on online advertising and generated 1.2 million impressions.
This led to 20,000 clicks.
Only 1 in 10 of the clicks resulted in a purchase.
This last calculation is also called “cost per purchase.”
Cost per customer acquired
Simply divide the advertising cost by the number of new customers who make an order. Refer to
Chapter 5
, “
Customer profitability
,” for more on defining customer and acquisition costs.
Data sources, complications and cautions
The Internet has provided greater availability of advertising data. Consequently, Internet advertising metrics are likely to rely on data that is more readily obtainable than data from conventional channels. The Internet can provide more information about how customers move through the system and how individual customers behave at the purchase stage of the process.
The calculations and data we have discussed in this section are often used in contracts compensating advertisers. Companies may prefer to compensate media and ad agencies on the basis of new customers acquired instead of impressions although the agencies may be less happy as it pushes more risk onto the agency. The agency may find its efforts limited by the lack of appeal of the client’s products rather than the agency’s efforts to produce interesting advertising and get it widely distributed.
Search engines
Search engine payments help determine the placement of links on search results pages. An important search engine metric is the cost per click, and it is generally the basis for establishing the search engine placement fee. Search engines can provide plenty of data to analyse the effectiveness of a campaign. In order to reap the benefits of a great Web site, the firm needs to get people to visit it. Previously we discussed how firms measure traffic. Search engines help firms create that traffic.
Although a strong brand helps drive traffic to a firm’s site, including the firm’s Web address in all of its offline advertising might not be sufficient to increase traffic count. In order to generate additional
traffic, firms often turn to search engines. EMarketer estimated that social network spending reached $16.1 billion in 2014. Furthermore, overall $179 billion was spent on paid media in 2014 in the USA. Digital spending accounted for a significant 28.2% of this total.
3
Paid search marketing (also known as search engine marketing) is essentially paying for the placement of ads on search engines across the Internet. The ads are typically small portions of text (much like newspaper want ads) made to look like the results of an unpaid or organic search. Payment is usually made only when someone clicks on the ad. It is possible to pay more per click in return for better placement on the search results page. Advertisers can bid to be displayed whenever someone searches for specified keyword(s). In this case, companies bid on the basis of cost per click. Bidding a higher amount per click gets you placed higher. However, there is an added complexity, which is if the ad fails to generate several clicks, its placement will be lowered in comparison to competing ads despite a higher CPC bid.
The measures for testing search engine effectiveness are largely the same as those used in assessing other Internet advertising.
Cost per click
The critical concept in search engine marketing is cost per click. Cost per click is widely quoted and used by search engines in charging for their services. Marketers use cost per click to build their budgets for search engine payments.
Search engines ask for a “maximum cost per click,” which is a ceiling whereby the marketer imposes the maximum amount they are willing to pay for an individual click. A search engine will typically auction the placement of links and only charge for a click at a rate just above the next highest bid. This means the maximum cost per click that a company would be willing to pay can be considerably higher than the average cost per click they end up paying.
Marketers often talk about the concept of daily spend on search
engines—just as it sounds, this is the total spent on paid search engine advertising during one day. In order to control spending, search engines allow marketers to specify maximum daily spends. When the maximum is reached, the advertisement doesn’t show again until the next 24 hour period.
Daily spend can be thought of as the product of average cost per click and the number of clicks:
Example Andrei, the Internet marketing manager of an online music retailer, decides to set a maximum price of $0.10 a click. At the end of the week he finds that the search engine provider has charged him a total of $350.00 for 1,000 clicks per day.
His average cost per click is thus the cost of the advertising divided by the number of clicks generated:
His average daily spend is $350/7 or $50 per day. This is average daily spend, which is not to be confused with daily spend limit.
Ad rank
This is the position of an advertisement served on a Pay Per Click
basis (PPC) on a search engine. The rank depends upon the amount bid for each keyword as well as the relevance of the keywords, which determines the quality and ranking.
Search engines typically use auctions to establish a price for the search terms they sell and have the great advantage of having a relatively efficient market; all users have access to the information and can be in the same virtual location. They tend to adopt a variant on the second price auction. Buyers only pay the amount needed for their requested placement; as such, search engine marketers can control the price they are willing to pay. The trick therefore is to know how much is reasonable for your firm to pay per click, which ultimately is a managerial judgement depending upon the benefits you expect to receive from such things as the customers generated.
Search engine optimisation
Search engine optimisation involves efforts to make your Web site rank more highly on search engines’ organic (unpaid) search results. There is little reason not to try and improve your ranking on organic search. Of course in practice successful search engine optimisation involves considerable skill and knowledge of how the rankings are constructed. The search engines have a variety of algorithms for how they rank sites. Possibly the most famous is Google’s PageRank, which works by counting the number and quality of links to a page to determine a rough estimate of how important the Web site is.
Visits, visitors and abandonment
Visits measures the number of sessions on the Web site. Visitors measures the number of people making those visits. When an individual goes to a Web site on Tuesday and then again on Wednesday, this should be recorded as two visits from one visitor in the week. Visitors are sometimes referred to as “unique visitors.” Visitors and unique visitors are the same metric.
Abandonment usually refers to shopping carts. The total number of shopping carts used in a specified period is the sum of the number abandoned and the number that resulted in complete purchases. The abandonment rate is the ratio of the number of abandoned shopping carts to the total.
Purpose: to understand Web site user behaviour.
Web sites can easily track the number of pages requested. As we saw earlier in the first section of this chapter, the pageviews metric can be useful but is far from a complete metric. We can do better. In addition to counting the number of pageviews a Web site delivers, firms will also want to count the number of times someone visits the Web site and the number of people requesting those pages.
To get a better understanding of traffic on a Web site, companies attempt to track the number of visits. A visit (known as a “session” in Google Analytics) can consist of a single pageview or multiple pageviews, and one individual can make multiple visits to a Web site. Visits captures the number of times individuals request a page from a Web site for the first time, i.e., the first request triggers the visit. Subsequent requests from the same individual do not count as visits unless they occur after a specified timeout period. The exact specification of what constitutes a visit requires this accepted standard for a timeout period, usually set at 30 minutes, which is the number of minutes of inactivity from the time of entering the page to the time of requesting a new page.
In addition to visits, firms also attempt to track the number of individual visitors to their Web site. Visitors captures the number of individuals requesting pages from the firm’s Web site server during a given period; also known as unique visitors. Google Analytics refers to these as “users.” Because a visitor can make multiple visits in a specified period, the number of visits will be greater than the number of visitors. A visitor is sometimes referred to as a unique
visitor or unique user to clearly convey the idea that each visitor is only counted once.
The measurement of users or visitors requires it to be measured over a time period, e.g., number of visitors in a given month.
Pageviews and visits are related. By definition, a visit is a series of pageviews grouped together in a single session, so the number of pageviews will exceed the number of visits.
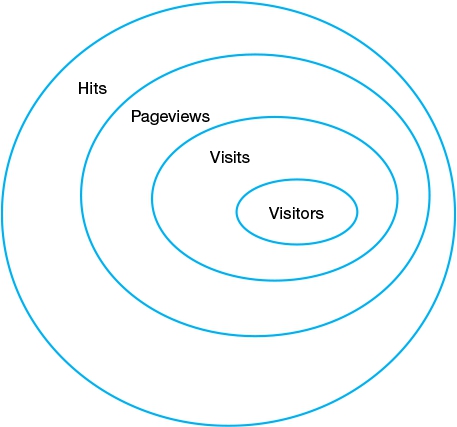
Consider the metrics as a series of concentric ovals as shown in
Figure 10.3
. In this view, the number of visitors must be less than or equal to the number of visits, which must be less than or equal to the number of pageviews, which must be equal to or less than the number of hits. (Refer to the first section in this chapter for details of the relationship between hits and pageviews.)
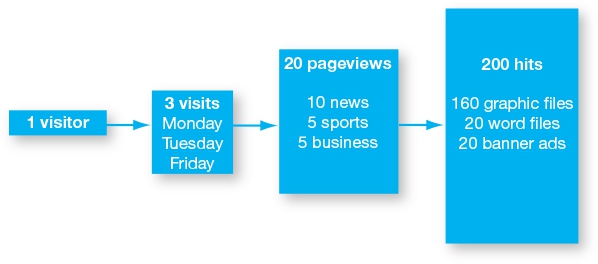
Another way to consider the relationship between visitors, visits, pageviews and hits is to consider the following example of one visitor entering a Web site of an online newspaper (see
Figure 10.4
). Suppose that the visitor enters the site on Monday, Tuesday and Friday. In her visits she looks at a total of 20 pageviews. Those pages are made up of a number of different graphic files, word files and banner ads.
The ratio of pageviews to visitors is sometimes referred to as the average pages per visit. Marketers track this average to monitor how the average visit length changes over time.
It is possible to dig even deeper and track the paths visitors take. This path is called the clickstream.
Clickstream: The path of a user through the Internet.
Figure 10.3
Relationship of hits to pageviews to visits to visitors
Figure 10.4
Example of online newspaper visitor
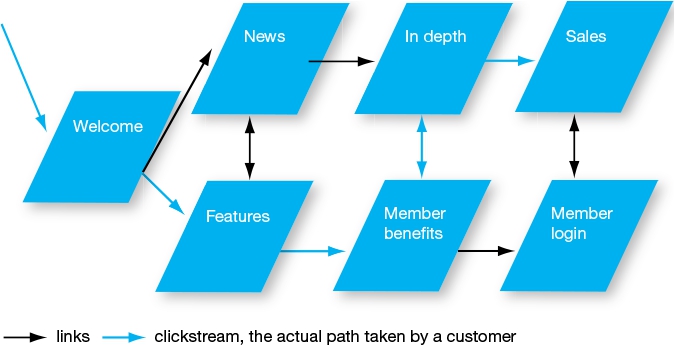
Figure 10.5
A clickstream documented
The clickstream refers to the sequence of clicked links the user makes. Using the clickstream on his or her own site a marketer tracking at this level can help the firm identify the most and least appealing pages (see
Figure 10.5
).
The analysis of clickstream data often yields significant customer insights. What path is a customer most likely to take prior to purchase? Is there a way to make the most popular paths even easier to navigate? Should the unpopular paths be changed or even
eliminated? Do purchases come at the end of lengthy or short sessions? At what pages do sessions end?
A portion of the clickstream that deserves considerable attention is the subset of clicks associated with the use of shopping carts. A shopping cart is a piece of software on the server that allows visitors to select items for eventual purchase. Although shoppers in brick and mortar stores rarely abandon their carts, abandonment of virtual shopping carts is quite common. Savvy marketers count how many of the shopping carts used in a specified period result in a completed sale versus how many are abandoned. The ratio of the number of abandoned shopping carts to the total is the abandonment rate.
Construction
Visits and visitors
Your analytics system will probably report these figure. Cookies can help servers track unique visitors, but this data is never 100% accurate (see the next section).
Abandonment rate
This measures the percentage of carts that were abandoned before completion. The percentage of shopping carts that are abandoned.
Example An online comics retailer found that of the 25,000 customers who loaded items into their electronic baskets, only 20,000 actually purchased:
Conversion rate
Many marketers monitor their conversion rate, the percentage of visitors who actually buy. This gives a good headline view of how effective your Web site is at generating sales once you have visitors.
Google Analytics uses sessions as the denominator. This means that each consumer can convert more than once if they visit more than once. Be careful to understand which your data represents.
Data sources, complications and cautions
Visits can be estimated from log file data. Visitors are much more difficult to measure.
Companies often encourage users to register so they can gain a better understanding of their users. Often consumers aren’t keen to do so; perhaps because they see registering as a hassle or as limiting their privacy. Indeed marketers rarely know for certain that a user is unique. Instead they consider visits from new browsers evidence of a new user and return visits from the same browser as a returning visitor. This means a user who uses different devices will often show as two different users. Similarly different people, for instance a family using a shared computer, may show as the same user.
To decide whether a visitor is a returning visitor or a new user, companies often employ cookies. A cookie is a file downloaded onto the computer of a person surfing the Web that contains identifying information. When the “browser” returns, the Web server reads the cookie and recognises the visitor as someone who has been to the Web site previously. More advanced sites use cookies to offer customised content, and shopping carts make use of cookies to distinguish one shopping cart from another. For example, Amazon, eBay, and EasyJet all make extensive use of cookies to personalise the Web views to each customer. As users become more sophisticated many are trying to protect their anonymity by not allowing cookies. If visitors accept cookies, then at least the browser that was used for the visit can be identified. If your customers do not accept cookies, this is much harder and the marketer should consider how significant a problem this is for his or her operations.
Cookie: A small file that a Web site puts on the hard drive of visitors for the purpose of future identification.
These metrics can be distorted by automatic activity (such as “bots”) that aim to classify Web content. To prevent this, estimates of visitors, visits, and other traffic, statistics are usually filtered to remove this activity by eliminating known IP addresses for “bots,” by requiring registration or cookies, or by using panel data.
Consultants may be able to help quantify your activity. For example, Nielsen, among other services, runs a panel in the U.S. and a number of major economies.
4
Bounce rate (Web site)
Bounce Rate is a measure of the effectiveness of a Web site in encouraging visitors to continue their visit. It is
expressed as a percentage and represents the proportion of visits that end on the first page of the Web site that the visitor sees.
High bounce rates typically indicate that the Web site isn’t doing a good job of attracting the continuing interest of visitors.
Purpose: to determine the effectiveness of the Web site at generating the interest of visitors.
Bounce rate is a commonly reported metric that reflects the effectiveness of Web sites at drawing the continuing attention of visitors. The assumption behind the usefulness of the metric is that the owner of the Web site wants visitors to visit more than just the landing page. For most sites this is a reasonable assumption. For example, sites that are seeking to sell goods want visitors to go to other pages to view the goods and ultimately make a purchase. Bounce rate is also a measure of how effective the company is at generating relevant traffic. The more the Web site is relevant to the traffic coming to it, the lower will be the bounce rate. This becomes particularly important when traffic is generated through paid search. Money spent to generate traffic for whom the Web site is not relevant (as reflected in a high bounce rate) is money wasted. The bounce rate is a particularly useful measure with respect to the entry pages to Web sites. An entry page with a very low bounce rate may be thought of as doing its job of driving traffic to other pages but the actual rate depends upon a number of factors. As Google Analytics explains; “Evaluate and adjust factors that might contribute to your bounce rate, like site layout and navigation. Use only your past performances as a rubric, and try to improve your current bounce rate relative to your previous data. Provide enough
time between changes to collect enough data to evaluate the impact the changes may be having on your users and their behaviours. Try using Content Experiments to help you.”
5
A content experiment, similar to an A/B test, is where you show different pages to different visits (ideally randomly selected) and see which page performs best.
Having a low bounce rate is often a prerequisite of having a successful e-commerce presence.
Construction
Bounce rate
The number of visits that access only a single page of a Web site divided by the total number of visits to the Web site.
Data sources, complications and cautions
Data to construct this metric, or even the metric itself, will usually come from the Web site’s host as part of the normal reporting procedure. Given how common it is that bounce rate is reported by default, it is a metric that is difficult to ignore. Construction of the metric requires a precise definition of when a visit ends. Leaving the site may come from closing the window, hitting the Back button or being timed out. (Google Analytics counts session timeouts.) After a timeout a new session is usually started if the visitor returns to the Web site. A lower timeout period results in increased bounce rates, all else equal.
Reports may use the term visitors instead of visits. You should be clear what data is actually reported. Visits are much easier to track because when the same visitor makes return visits, especially to different entry pages, it can be difficult to connect the return visit to the original visitor. As such visits, rather than visitors, are most
likely used to calculate bounce rates.
This metric can also be defined and constructed for individual landing pages within the site. Indeed the bounce rate for each landing page allows for more precise diagnosis of problem areas on a Web site. One must interpret page bounce rates, however, in light of the purpose of the page. For some pages, such as directions pages where people go to find out specific information, a high bounce rate is to be expected.
The value of the bounce rate metric will depend upon the objective of the organisation. Informational sites may develop a strong bond with their users through frequent short interactions, such as when the users check sports scores. The organisation may be comfortable if many users do not visit other parts of the site, and may not be too concerned about high bounce rates. However, most companies will probably want low bounce rates and will actively monitor this important metric.
One of the most challenging problems in marketing (online, offline and online to offline) is the problem of attribution. This is because a consumer is likely to have been reached by multiple marketing actions prior to his or her purchase; making it impossible to say definitively which touchpoint generated the sales. Indeed all touchpoints may have had a vital contribution in generating the sales. For advertisers using a mix of online and “offline” media, it will be especially difficult to categorise the cause and effect relationships between advertising and sales. Search ads might receive too much credit for an order if the customer has also been influenced by the fact that the consumer earlier saw the firm’s billboard advertisement. Conversely, search ads might receive too little credit for offline sales where the consumer’s interest was previously piqued by the search ad. Similarly social media can sometimes play a big role in sales; it assists the final conversion, but is usually not the last referral source clicked before a purchase. Given this, social media doesn’t always get the credit it deserves for driving sales.
Attribution is a challenge but various assumptions are made. When
all items influencing a purchase are on-line, a firm can attribute the sale in a number of ways.
Last click attribution is when full credit for the sale is given to the final touchpoint prior to purchase. First click attribution is when full credit for the sale is given to the initial touchpoint, the first contact on the customer’s path to purchase. Linear attribution is when the credit is shared equally between all touchpoints involved in the path to purchase. Clearly it is hard to defend any of these assumptions as perfectly capturing what happens in the real world but understanding the assumptions is necessary to determining whether the assumptions are useful approximations of reality even if they never perfectly capture reality.
Google Analytics
This is not the place to give a detailed view of Google Analytics but the tools Google has made available can be an excellent way of understanding the success of your marketing on a wide range of platforms. Google supplies an extensive range of assistance to those wishing to use Google Analytics. This material, which includes graded courses to work through, is supplied at the Google Analytics Academy,
https://analyticsacademy.withgoogle.com/explorer
.
Social media metrics: friends/followers/supporters/likes
Friends/Followers/Supporters is a very simple metric that measures the number of individuals who join an organisation’s social network.
A high number of friends signifies an active interest in the owner of the page. If a brand has a high number of friends, this indicates a stronger brand with a loyal customer base.
Likes is a similarly simple metric that measures the number of individuals who have favoured a post/page/organisation using the “like” button.
Purpose: to determine the effectiveness of a social networking presence.
We use the term friends to encompass followers, supporters, and other similar concepts. Friends are members of a social networking site who register that they know, like, and/or support the owner of the social networking page. For instance a strong brand may have many customers who want to publicly signal their love of the brand. Social networking sites hold great benefits in allowing companies to develop customer relationships and can help a company identify and communicate with committed customers.
Likes are ways that individuals on social media show they favour a post or a page. They click on the like button below pages, comments, brands, etc. Like is an extremely low commitment activity, and some people like many things in a day. It seems, however, a reasonable assumption that generally a larger number of likes is indicative of greater appeal.
Construction
These metrics will be supplied by the social network.
Cost per friend (like)
The cost to the organisation per friend recruited or Like generated.
Often the direct costs of having a social networking site are very low. This should not, however, lead the marketer to conclude the cost is effectively zero. Sites have to be designed, staff have to update the site, and marketers have to devise strategies. Remember when calculating the cost of having a social network presence that the costs should include all costs incurred in the provision of the social network presence.
Outcomes per friend
A similar attempt might be made to clarify the precise downstream outcomes gained by the presence of friends. (“Did we sell more ketchup?”) It is often very hard to track and attribute outcomes to specific social networking actions. This does not mean that an active social networking presence is not a vital part of an Internet marketing strategy, but when designing a presence the ultimate objective of the company needs to be borne in mind. For example, friends are often recruited to “vote” in polls. The percentage of friends participating is a simple example of an “outcome per friend” metric but probably not the ultimate objective.
Data sources, complications and cautions
Success in recruiting friends is likely to depend heavily on the group of people who identify with the entity (e.g., individuals, brands, companies or other groups). In the case of brands, some customer segments are more reluctant to reveal their brand loyalty than others, and as such two brands of equivalent strength may have very different levels of social network presence. Similarly the product involved is likely to influence the likelihood of registering as a friend at the social networking site. It is easy to think of some vitally
important but more private products that are relied upon by their users but are less likely to gain public expressions of support than brands that are more related to public consumption.
It is very hard to objectively judge the effectiveness of social networking activities. Generally having more followers or likes is an excellent sign of customer engagement. The more customers who have an ongoing relationship with a brand that they are willing to publicly support, the more likely the brand is to have strong customer awareness and loyalty. It is worth noting, however, that Friends and Likes, as with many metrics, are most often intermediate metrics rather than an aim of the organisation itself. It is unlikely that most organisations exist with the explicit objective of generating Friends. As such it is rarely sufficient to report the number of Friends as a successful outcome of a marketing strategy without any additional information. This concern is only increased by the widespread practice of selling “Friends” and “Followers” etc. on social media. Likes need to be tied to the objectives of the firm and not just be a way of soothing the vanity of the marketer.
It is often appropriate to construct metrics around the downstream outcomes and cost effectiveness of such strategies. A marketer would be well advised to pay attention to the costs and ultimate benefits of social networking presence as well as the clear potential to engage with customers.
The idea of an Augmented Social Network (ASN) has become popular. ASN can be used as a loose term to signify a social network that is successfully engaging with its users. As such a measure, such as the percentage of completed social networks, or the number of posts that are engaged with, may indicate successful engagement. A firm might therefore measure the number of posts that generate a response divided by the total number of posts to give some idea of engagement with the social network.
Value of a like is an attempt to put a dollar value on social media. It is possible to calculate the value of a like as the difference between the value of someone who doesn’t like, for example, a brand and
someone who does. Value of a like (value of a follow) is sometimes calculated by subtracting the value of an individual consumer who did not choose to like (or follow) a brand from the value of an individual who did. It is important to note that it would be wrong to argue that this difference is the value attributable to the social media strategy. It is unlikely that the social media strategy caused the entire difference in value observed between those choosing to like the brand and those not doing so. There are likely a number of other factors.
There are, thus, two major caveats that we have seen with the use of this metric which leads to concern that value of a like can cause more harm than good. Firstly, value to a firm should be the profit generated by the consumer and not revenue. Assessing the value of a like as the revenue coming from consumers who like the firm will overstate the value of a social media strategy as it ignores all the other costs of servicing these customers. Secondly, it is important to understand that this metric is not the amount that the organisation can spend up to in order to secure a like (follower). Those who interact (positively) with a firm on social media are likely to already be positively predisposed to the firm. Encouraging other members of the public, who don’t have the same prior positive predisposition, by, for example, rewarding those who follow a brand on social media, is unlikely to change the new recruits’ purchase behaviours to resemble that of the more avid followers who followed without the incentive. When the difference in value is not caused by the social media strategy it would be wrong to use this as a benchmark for social media spending. As such although the Value of a Like is potentially an interesting number, the practical benefits of the metric are more limited than they might first appear.
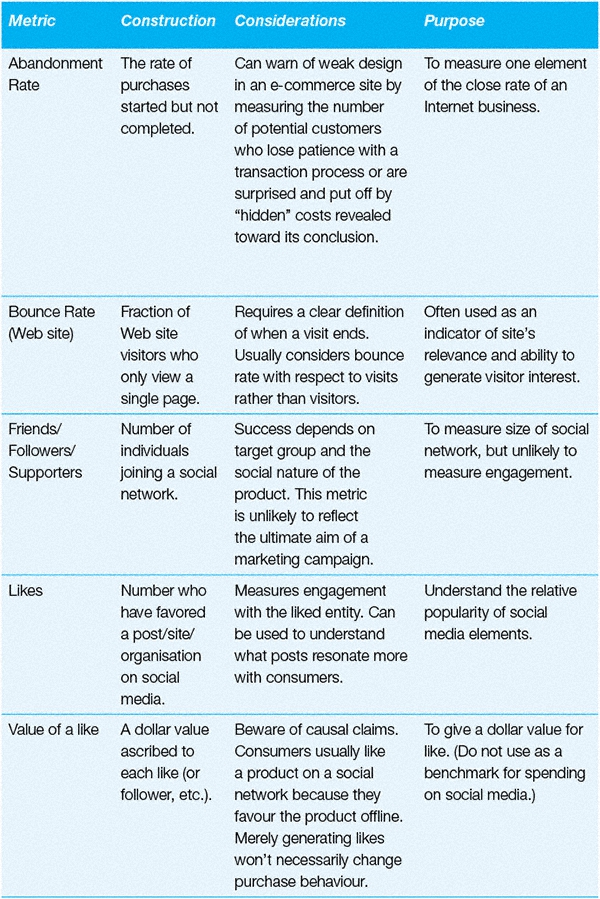
Downloads
Monitoring downloads is a way of tracking engagement with the organisation.
Downloads reflect the success of organisations at getting their applications distributed to users.
Purpose: to determine effectiveness in getting applications out to users.
Downloads are a common way for marketers to gain a presence with consumers. This includes applications for mobile phones, for MP3-style devices and computers.
Apps for iPhones, software trials, spreadsheets, ring tones, white papers, pictures and widgets are examples of downloads. These downloads typically provide a benefit to the consumer in return for a presence on the device of the user. For instance a weather app might be branded with the Web site of the weather channel and provide updates on atmospheric conditions. A consumer packaged goods company might supply an app that suggests recipes that could use its products in novel ways.
Construction
This metric will be supplied by analytics software.
Data sources, complications and cautions
Downloads is a simple count of the number of times an application or file is downloaded, regardless of who requested the download. It does not distinguish 10 identical downloads to a given individual from 10 separate downloads to 10 separate individuals, although these two situations may have dramatically different consequences. In this way downloads is akin to impressions where a given number of impressions can be obtained by a variety of combinations of reach and frequency (see
Chapter 9
). Using your analytics package to see
the number of downloads in unique sessions versus the total downloads should help you get a better feel for how many downloads were made by the same person (technically this is often measured as downloads made by the same browser).
A consideration in the counting of downloads is how to handle downloads that are started but not completed. One alternative is to keep track of both downloads started and downloads completed, another alternative is to pick one or the other (starts or completions) and use that measure consistently. As always, it is imperative for the user to know which convention was used in construction of the metric.
A further challenge is that “Downloads” often raise problems in standard Web analytics packages. This is because they often don’t fire a pageview when they provide a file (e.g., a Pdf, doc, xls). This means downloads can’t be tracked like normal “pages.” Downloads instead need to be tracked with event tracking. Event tracking involves code that creates a virtual pageview when the event is triggered.
Mobile metrics
Mobile metrics may be classified into metrics that are akin to Web site metrics and other metrics that focus on apps. Average revenue per user (ARPU) is a widely used metric for app marketers.
Many issues in mobile marketing are similar to marketing aimed at users on computers. (Mobile relates to marketing using platforms optimised for use on hand-held and other portable devices.) Mobile site metrics are similar to Web site metrics, and can use Web
analytics packages such as the specialised mobile version of metrics on Google Analytics. These allow you to better understand the users’ interactions and experience with the mobile site. While the metrics may be similar to traditional Web site measures, one would expect the results to differ by channel to reflect, for example, the relative strengths of desktop and mobile search. Mobile marketing might lead to fewer sales on the devices but might have a greater role in providing support to the sale, such as downloads of coupons or store maps. (Clearly there may be challenges attributing credit for sales between the mobile site, Web site, and the bricks and mortar store.)
Your analytics package is likely to be able to tell you where your traffic is coming from, i.e. 80% desktop and 20% mobile. Given the problems making attributions this is only a useful, but clearly far from complete, view of the reliance of your marketing on various platforms (the environment the software runs on).
The second strand of mobile marketing might be the use of apps. Ensuring apps are downloaded is an element of mobile marketing. Once you have an installed user base you will want to check how you are acquiring customers, how they use the app and how long customers stay with you.
With the rise of mobile payments, a marketer will want to be aware of the percentage of customers using this method of payment. Furthermore marketers will want to monitor mobile coupons used. The principles are similar to the non-mobile world but the data is rich, and relatively clean from mobile devices. For example, people usually operate only their own personal phone whereas people are more likely to share computers.
Construction
We highlight a selection of metrics related to mobile apps.
Session length
This is the length of time the user spends on the app.
Active users (monthly/daily)
This is the count of users who use the app during a given period; for example, a month or a day.
New user acquisition and retention rate are similar to the metrics highlighted in the customer section of the book (
Chapter 5
).
Average revenue per user
This shows the effectiveness of the marketer at gaining revenue from each user. Clearly the importance of this metric depends upon the purpose of the app. An app that is designed to build the brand or facilitate usage of a product may have no revenue associated with it but this does not mean it is not a valuable part of the marketing strategy.
Store visits
There are also a number of emerging applications that meld the online and offline worlds. For example, store visits can be estimated using location-based tracking on mobile phones. This is anonymised data so you can estimate the number of consumers who went to the stores—not which customers went there. When you have the number of consumers going into a store you can compare this to an online action, for instance the number who downloaded a coupon, to assess how effectively the online strategy drives offline actions, visits to stores.
Data sources, complications and
cautions
Many of the key bits of data needed to assess these metrics come from analytics packages, such as Google’s Mobile analytics package.
While many of these concepts are the same across platforms it is worth noting just how quickly the mobile market changes. In many areas you might be expecting to see a payback to an investment in a few years. In mobile marketing often payback needs to be much quicker. If a downloaded app doesn’t pay back in weeks it may never do so. The active lives of users of mobile apps may be quite short meaning churn will be extremely high. Indeed you probably want to measure on a much shorter period to make any retention related metrics more meaningful.
Email metrics
Monitoring email response is an important way of judging the success of email campaigns, individual emails, and lists.
Email metrics tend to measure the response of consumers to the email. Does the email lead to an action? For example, is an email opened?
Bounce rate in email marketing is a measure of the quality of the list and is essentially independent of consumer action. This is a notable difference from bounce rate when measuring a Web site, which measures the action the Web site generates from consumers.
Purpose: to determine effectiveness of
email campaigns.
Despite the popularity of search, email marketing retains a place in the marketing endeavours of many firms. Many of these metrics appear similar to Web site metrics as they have a similar purpose. The metrics are focused on measuring the level of activity that is generated by the marketer’s actions.
The simplest metric is email open rate, which is the percentage of emails that get opened. Clearly emails that don’t get opened are relatively unlikely to motivate any further action.
Clickthrough Rate is similar to the search metrics and represents the percentage of emails that are clicked on. These might typically bring the consumer through to a Web site where they could buy a product.
Email can annoy people and unsubscribes captures the percentage of subscribers who ask to be removed from the list. All else equal a list with a high unsubscribe rate is a worse list. (Although a list on which consumers continue to receive email but aren’t motivated to any action is not especially useful. It is simply a wasted expense to create the emails.)
Construction
Email open rate
The percentage of email delivered that gets opened.
Email clickthrough rate
The percentage of email delivered that gets clicked on.
Email unsubscribe rate
The percentage of any list of email subscribers that opt out of the list in any given period.
Bounce rate
One notable complication is that email bounce rate has a different definition than Web site bounce rate. Email bounce rate records the quality of your list rather than any action on the part of the recipient in respect of the email. An older, poorer quality list is likely to have a higher bounce rate as a percentage of recipients will have abandoned their old email addresses. (Email bounce rate relates to emails that can’t be read.) Investigating the data further can let the marketer know more about the source of failure, e.g., did the recipient’s server accept the email before bouncing it back, perhaps because the email address has reached its maximum size?
Cost per engagement
Marketers often refer to “cost per engagement” (CPE). This is a similar metric to the other cost per metrics we have discussed. The only additional consideration is that we must define exactly what an engagement is. An engagement is essentially whatever the marketer decides based upon the goals of the campaign. A marketer trying to gain email newsletter signups might pay a third party on a Cost Per Engagement basis, paying only for signups. Clearly the third parties must be willing to work closely with marketers to establish the definition of engagement, and associated tracking mechanisms.
Data sources, complications and cautions
The rules on what information can be held by marketers on consumers vary by jurisdiction. Many parts of the world require consent of the recipient to receiving email. You should always check that you are complying with local laws and best practice. The Chartered Institute of Marketing Association (
www.cim.co.uk
) and American Marketing Association (
https://www.ama.org
) have helpful resources available.
There can be a considerable difference between emails sent and delivered given abandoned email addresses, bounced emails and full inboxes. Even those that are delivered may be filtered away from the recipient’s attention. Email marketers should seek to understand the fate of emails they send in greater detail. Increasing spam and other filtering on the part of the users can lead to reduced rates that have nothing to do with the effectiveness of the creative message sent. The recipients may simply never see the message so it cannot have an effect even if the message is powerful.
The effect of a campaign can be monitored by tagging URLs in emails. Using the URL one can see whether the message drives traffic to the site and which sites have traffic that results in conversions.
Email opens and clicks can be used in testing different emails. When testing, e.g., an A/B test, a marketer sends out two types of email. In general for testing one should limit the differences between the emails. This difference constitutes the thing being tested and so if you vary many things it requires more advanced stats to tease out the effects. (And sometimes teasing out the effects is simply impossible where, for example, two changes always occur together it is impossible to assess the effect of each change independently.) For example, one email creative may offer: “Buy One, Get One Free” while the other creative offers: “Two For The Price of One.” Sending these emails randomly to the email list allows the marketer to assume that the recipients of each email were similar. Armed with this assumption the marketer can then determine which creative,
“two for the price of one” or “buy one get one free,” is more effective based upon which is more likely to be opened and clicked on.
Email marketing relies on the quality of the email list. The quality of lists, for a specific task, can be tested by observing the open and click rate of a message sent to several lists. High quality lists can still gain little response if the offer sent is inappropriate to the members of the list.
References and suggested further reading
Kaushik, Avinash. (2007). Web Analytics: An Hour A Day
, Sybex.
Net Genesis Corp. (2000). E-metrics—Business Metrics for the New Economy. Net Genesis and Target Marketing of Santa Barbara.
Pirouz, Raymond, Neil Bendle, and Taneem Khan. (2011). Online Metrics: What Are You Measuring and Why? Ivey Business School, 9B11A016.