12 | GENETIC METHODOLOGIES AND APPLICATIONS
SHAUN M. PURCELL
The past decade has witnessed tremendous advances in the molecular technologies and data-analytic methods at our disposal for studying the genetic bases of complex diseases and traits. These advances have enabled the creation of comprehensive catalogs of different forms of human genetic variation, as well as large-scale studies focused on specific diseases or traits. In this chapter, we outline the general principles behind some of these advances and discuss their application to studying complex traits, with a focus on neuropsychiatric disease in particular.
MOTIVATIONS FOR MAPPING THE GENETIC BASIS OF DISEASE
Genetic epidemiology is fundamentally concerned with relating genotype (i.e., variation between individuals’ genomes) to phenotype (i.e., the presence or absence of a disease, or measure of a trait such as height or cholesterol level) (Altshuler et al., 2008). There are a number of relatively distinct motivations for this work, which can be conceived of both in terms of proximal and distal goals of the research. Recently, there has been a great deal of focus on identifying specific alleles (variable forms of a locus, which is a gene or region) that “explain the heritability” as a primary benchmark and major goal of genetic studies, as discussed later. For many downstream applications, however, perhaps an equally important, but distinct, proximal goal of genetics is to point to the genes and/or gene networks that are causally associated with disease.
Following from these proximal goals (identifying the specific alleles that explain heritability and identifying the relevant genes and pathways) there are several distinct, more distal goals or applications, the success of which will depend on different aspects of the genetic discoveries made. In theory, understanding the genetics of a disease could be used for risk prediction, either at the population level or within families (following the model of genetic counseling for Mendelian disease); for prediction of disease course, severity, or drug response in affected individuals; to identify targets for drug discovery research; to inform on the relationships and comorbidities between different diseases; or even to provide a framework for causal inference around environmental effects (Smith and Ebrahim, 2003). More generally, advances in understanding disease genetics will ultimately, but undoubtedly, provide fundamental insights into human biology, development, and evolution. However, the ease with which genetics will achieve success in these various applications relates to different aspects of the unknown, underlying genetic architecture of any particular disease or trait.
The question of the genetic architecture of common disease has been a central one: it relates to the types of approaches that will work best to map genes, as well as to what we can expect to learn from genetic studies in the near future. For a heritable disease, genetic architecture describes how many independent genetic effects contribute to risk, at the level of both the population and the specific individual; it also describes the typical frequency and effect size of these variants; how they combine to produce a phenotype (e.g., additively or interactively) and the extent to which multiple genetic risk factors for a disease coalesce into a smaller number of distinct biological pathways or networks. Other aspects of genetic architecture include the mode of inheritance (e.g., recessive effects), the presence of positive, negative, or balancing selection acting on risk variants, the extent to which genetic effects are shared (or contribute to different disease rates) across populations, the extent to which variants influence multiple outcomes through pleiotropy (one gene having multiple downstream effects), and the extent to which genetic effects are moderated by environmental exposures (gene–environment interaction).
The success of risk prediction, for example, in the general population will be crucially dependent on the proportion of variance explained by detected variants, which is a function of both the frequency and penetrance (a measure of effect size that equals the chance that a carrier develops disease) of risk alleles. By learning which specific alleles (the particular variants of genes) increase or decrease risk or type or course of disease, one can in theory predict an individual’s risk or provide tailored medical treatment to patients based on their genotype. In practice, truly personalized genomic medicine is still only a long-term goal in most instances, rather than a current or imminent reality, although this is likely to be an area of great progress over the coming decade.
However, inasmuch as the distal goals relate to identifying loci, to point to potential drug targets, for example, the extent to which detected variants account for heritability might not be critically relevant: for instance, there are multiple examples of genetic studies that have pointed to weak genetic effects in genes that are already known targets of existing, successful therapies. Thus, genetic studies have a parallel set of aims that are almost orthogonal to the goal of explaining variability in a population, involving the identification of the networks of genes implicated in disease. Here the aim is to use this information to point to the biological mechanisms involved in disease pathogenesis.
CLASSICAL GENETIC EPIDEMIOLOGY: FROM FAMILY STUDIES, SEGREGATION, AND LINKAGE ANALYSIS, TO LINKAGE DISEQUILIBRIUM MAPPING
Classical genetic epidemiology posed a series of increasingly specific questions: For a particular disease or trait, are there genetic influences? Is the genetic basis simple or complex? Where are those genes located? Which specific forms of the gene cause disease? The tools to answer these questions were, respectively, family and twin studies, segregation analysis, linkage analysis, and association analysis. Twin and family studies are used primarily to estimate the heritability of a trait (the extent to which variation in outcome is due to variation in genes) by contrasting the phenotypic similarity of relatives of differing genetic similarity. More recently, twin and family study designs have also proved useful in molecular studies of genetic and epigenetic variation (van Dongen et al., 2012). One notable family study of schizophrenia and bipolar disorder involved tens of thousands of patients from Sweden and showed clear evidence for a shared genetic basis common to both disorders (Lichtenstein et al., 2009). Looking at a range of first-degree relative classes, such studies estimate the probandwise concordance rate (the probability an individual develops disease given they have an affected relative of a particular type) and the familial relative risk (λ), which for a given class of relative, is the concordance rate divided by the population prevalence of disease. Both approaches ask how much more likely an individual is to develop disease if he or she has an affected relative. Estimates of λ for MZ twins, full siblings, parent–offspring pairs, and half-siblings track strongly with the extent of genetic similarity in those pairs, indicative of a considerable genetic basis for these diseases. This and other studies put the heritability of schizophrenia to be very high, with estimates from 60% to 80%, for example.
Segregation analysis considers the broader pattern of disease within larger pedigrees. For Mendelian disease, segregation analysis can estimate whether there is likely to be a single disease allele in each family, and if so, its mode of inheritance. For complex diseases that are caused by multiple genes and environmental influences, segregation analysis is typically uninformative (beyond demonstrating above-chance levels of familial clustering). Linkage analysis also uses pedigrees to identify specific (but very broad) chromosomal loci that cosegregate with disease in a particular family. Linkage analysis primarily gained popularity after the introduction of molecular marker maps in the 1980s. For example, by genotyping 300–400 “microsatellite” markers (short tandem repeats of variable length between individuals), one can infer the pattern of gene flow in a family (specifically, of shared chromosomal regions coinherited from a single ancestor and so identical-by-descent, IBD) and then search for chromosomal positions at which the profile of IBD maximally correlates with the coinheritance pattern of the phenotype. Linkage analysis proved spectacularly useful in mapping Mendelian disease genes of major effect: rare mutations that almost always lead to correspondingly rare diseases. In contrast, for complex, common diseases, linkage analysis has yielded very few durable results (for neuropsychiatric disease, one notable exception is the DISC1 locus). This is, in large part, because linkage analysis has low power to detect variants of only modest effect. The general failure of linkage analysis (given that it has, in fact, been widely applied for many diseases, including schizophrenia) can be taken to indicate that the genetic architecture of most common diseases is unlikely to be well characterized as primarily consisting of a small number of “hotspot” regions: that is, genes or loci at which a sizeable proportion of cases carry a highly or even moderately penetrant risk variant.
Association analysis (or linkage disequilibrium mapping) has replaced linkage analysis as the workhorse of genetic epidemiology over the past decade. Association analysis is conceptually straightforward: typically in populations of unrelated individuals, association analysis simply looks for specific variants (alleles) that are significantly more frequent in people with the disease compared with those without. Compared with linkage analysis, this approach is more powerful to detect variants of smaller effect (Risch and Merikangas, 1996).
To more concretely contrast the effect sizes expected for a “major gene” disorder versus a complex, common disease, consider that for a rare disease, say, affecting 1 in 10,000 individuals, a major gene effect may increase risk more than 10,000-fold: for example, if baseline risk in noncarriers of the gene is 0.00003, then the penetrance (risk of disease given genotype) would be 30% or more. In this scenario, even though the gene is not completely Mendelian (deterministic in its effect), a very large proportion (more than one third) of carriers will develop the disease, and conversely, a very large proportion of all affected individuals will carry that particular disease allele (again, more than one third). In comparison, for a common disease with a population prevalence of 1 in 100 individuals, for common alleles researchers expect realistic effect sizes along the lines of, at most, a 1.2-fold, rather than 10,000-fold, increase in risk. If this risk allele has a population frequency of, say, 40%, it implies that carriers have ~1.2% risk of developing disease and we would expect to see the allele in ~44% of cases compared with~40% of unaffected individuals. This relatively small difference means that the variant is harder to detect statistically. (It also means that this allele, by itself, will have very little predictive utility: i.e., knowing an individual’s genotype at this locus would only marginally improve one’s ability to predict, above chance, whether or not the individual will develop disease. Of course, for a heritable disease, we would expect many such loci to contribute to disease risk that could be informative if analyzed collectively.)
Historically, the principal limitation in applying association analysis broadly was that, unlike linkage analysis in which only a relatively modest number of molecular markers provide a genome-wide survey of gene flow within families (because very large chunks of chromosome are shared between closely related individuals), testing a specific marker for association only queries a tiny proportion of the total extent of variability that exists genome-wide. This arises from the properties of linkage disequilibrium in human populations, as described later. Thus, hundreds of thousands of markers would be needed to cover the whole genome, and the sufficiently high-throughput genotyping methods needed to achieve this have only come into existence more recently. In practice, for a long time this meant that association analysis was limited to testing a small number of variants in a small number of candidate genes. Candidates were usually selected on the basis of prior knowledge, or assumptions, about the pathophysiology of disease. In neuropsychiatric genetics, despite a considerable body of work, studies of candidate genes largely failed to lead to broadly reproducible results. There are multiple reasons to explain this state of affairs (reviewed by Kim et al., 2011). Perhaps most obviously, many of the original hypotheses about the disease may have been incorrect, or at least fundamentally incomplete descriptions of a much more complex process. For a number of diseases such as Type II diabetes and Crohns’ disease, the biology pointed to by recent, robust genetic findings from genome-wide association studies (see following) has often been at odds with the prior assumptions about what would be genetically important. This is, of course, a good thing from the perspective of genetic studies, in that we wish for genetics to be a source of novel insights and hypotheses—that is, to tell us something new. Typically the error rates of candidates genes studies would also have been high: false positives (Type I errors in hypothesis testing) are hard to control, given varying degrees of multiple testing, and false negatives (Type II errors) are likely as sample sizes used for most candidate gene studies were typically very small by today’s standards. In schizophrenia, as of 2011, 732 autosomal genes had been tested by 1,374 hypothesis-driven candidate gene studies, although most genes were investigated in only one (61%) or two (16%) studies (Kim et al., 2011). Typically no replication was attempted, or it was underpowered, or the statistical evidence was, at best, hard to reconcile from the literature (e.g., when different markers in the same gene were tested across different studies, or when replication was claimed but the direction of effect for the same marker differed between studies). Furthermore, genetic variation in the candidate genes tested was typically only very poorly captured, even for common variation, often with only one or two markers being genotyped per gene.
EXPANDING KNOWLEDGE OF THE HUMAN GENOME
Reference maps and databases have been critical in many areas of genomics: from the human genome reference sequence itself, to maps of coding and other functional elements in the sequence. Equally important for disease and population genetics has been the more recent construction of maps, or catalogs, of observed variation within and between different human populations. The two most notable efforts are the International HapMap project (International HapMap Consortium, 2007) and, more recently, the 1000 Genomes project (1000 Genomes Consortium, 2010). The HapMap project employed large-scale genotyping to type almost 4 million known single-nucleotide polymorphisms (SNPs) in 270 individuals of African, Asian, and European ancestry. As well as generating lists of technically validated polymorphic sites along with estimates of allele frequencies in multiple populations, a central aim was to characterize and describe the patterns of correlation between nearby variants, referred to as linkage disequilibrium (LD). As illustrated in Figure 12.1, two or more alleles at nearby sites are said to be in LD if they co-occur more than expected by chance, that is, than if they were inherited independently of each other. In reality, haplotypes (collections of alleles on the same physical stretch of chromosome) are the primary unit of inheritance, not individual alleles. Two alleles on the same haplotype will tend to be either both cotransmitted from parent to offspring, or will both be untransmitted, thereby inducing a correlation between the alleles at the population level. The further away two sites physically reside on the chromosome, the more likely that they will be separated by a meiotic recombination event. Thus, LD between any two sites tends to “break down,” or be attenuated, over distance. This property can be used to localize genes, in that it implies that two sites that are in LD are also likely to be physically colocated on the same stretch of chromosome. This is the principle behind linkage disequilibrium mapping.
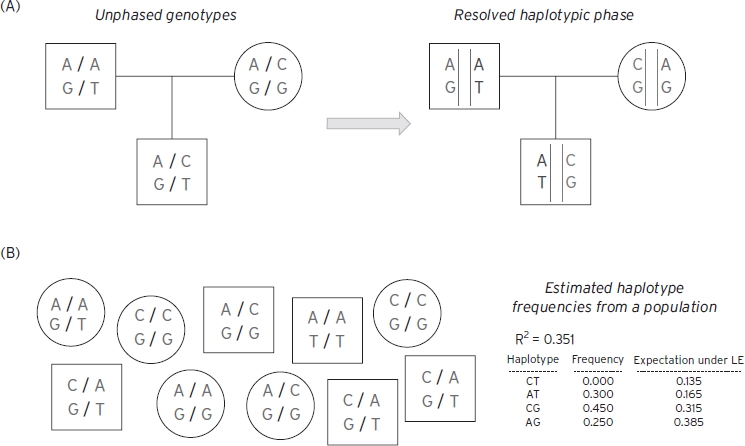
Figure 12.1 Linkage disequilibrium and haplotype phasing. ( A) Using family information can often resolve phase unambiguously. Here a trio is genotyped for two biallelic SNPs: for the first site, A or C alleles (top genotype in all plots); for the second site, G or T alleles (bottom genotype in all plots) in this example. From inspection, the mother necessarily transmits the CG haplotype, implying that the offspring carries AT and CG haplotypes, rather than AG and CT haplotypes. (B) In the absence of family data, it is still possible to estimate haplotype frequencies from genotypes at SNPs in linkage equilibrium. In this toy, illustrative example, the EM algorithm would conclude that the CT haplotype does not exist in this population based on this very small sample of 10, meaning that the two SNPs are in LD (here R2 is estimated at 0.351). Individuals would be assigned a combination of AT, CG, and AG haplotypes only, which will be consistent with their SNP genotypes.
Obtaining genotype data on an individual for two nearby heterozygous sites does not directly reveal the underlying haplotypes carried by that individual, although in families the haplotype can often be inferred straightforwardly. For example, if the individual carries an A/C (heterozygous) genotype for the first site and G/T for the second, there are two possible haplotypic configurations: that the AG haplotype was inherited from one parent, and therefore CT from the second, or that AT was inherited from the first and CG from the second. The process of resolving which configuration is more likely is called phasing. As in the Figure 12.1, phase is often unambiguous when one studies multiple members of the same family. Alternatively, statistical approaches (based on algorithms such as expectation maximization [EM] or Markov Chain Monte Carlo [MCMC] and population genetic models) can be used to resolve phase in samples of unrelated individuals, by considering the observed correlation between sites and treating the unknown phase information statistically in terms of a missing-data problem (Browning and Browning, 2012). In some situations it is also possible to use sequencing to type haplotypes directly, using molecular rather than statistical means, sequencing along the same physical stretch of chromosome.
The actual structure and extent of LD in humans reflects both demographic factors and the history of the population studied, as well as biological properties of the genome, influencing the rate of recombination at particular sites. The typical structure and extent of LD is of critical importance to the implementation of association analysis as applied to large genomic regions. Fundamentally, association mapping (or linkage disequilibrium mapping, as previously noted) relies on the fact that by testing a particular variant, one is implicitly testing a host of nearby variants, for which the genotyped markers act as proxies, or tags.
The HapMap project provides a comprehensive empirical description of the typical profiles of LD in the populations studied. To a first approximation, patterns of LD can be well characterized by “haplotype blocks,” meaning that there are regions of the genome (very variable in size, but often on the order of 10 to 100 kb) in which there is very high LD, meaning that only a small subset of all possible haplotypes (combinations of alleles in that region) are observed in the population. For example, considering 10 SNPs, each with two alleles, there are 210 = 1024 possible haplotypes, although under very strong LD we may observe only two or three of these at appreciable population frequencies. These “blocks” are separated by “recombination hotspots”—places in the genome with a historically higher rate of recombination, which acts to reduce LD by separating alleles on the recombinant haplotype. The results from the HapMap helped inform the design of experiments that aimed to intelligently select the smallest possible set of markers necessary to capture, or tag, most of the known common variation in a region. In the 10-SNP example, it may only be necessary to genotype 1 or 2 SNPs for example, without significant loss of information compared with genotyping all 10.
A common measure of LD in association studies is R2, where a value of 0 indicates no LD (two sites are statistically independent) and 1 indicates that one marker is effectively a perfect proxy for the second. An intermediate value, say of 0.8, indicates that one marker captures 80% of the information one would obtain if using one marker as a proxy for the other, instead of directly genotyping the second marker. If the untyped marker is a causal risk factor for disease, then one may still expect to observe a statistical signal of association (e.g., based on a simple comparison of case and control allele frequencies) at the genotyped marker, albeit one that is attenuated due to incomplete LD. (In fact, to retain equivalent power to detect association at the marker, in this case one would require 1/R2 = 1/0.8 or 125% of the sample size compared with typing the causal marker directly). By estimating the average extent of LD, analyses of HapMap data showed that one could expect to capture the majority of common (typically defined as above 5% marker allele frequency) variation in European and Asian populations at a reasonable level of certainty (e.g., R2 > 0.8) by genotyping on the order of 500,000 SNPs genome-wide. This paved the way for the first genome-wide association studies (GWASs), which began typing 100,000–300,000 markers using newly developed, standardized commercial microarrays, soon establishing 500,000–1,000,000 SNPs as routine (Carlson et al., 2004). As described later, association analysis of these datasets has driven many genetic discoveries in the past decade.
Superseding the tagging approach in many respects, the more general approach of imputation leverages the actual HapMap sample data itself to fill in data that are “missing” in a GWAS but present in the HapMap, relying on LD information implicit in the HapMap across all SNPs. Imputation allows researchers to probabilistically assign genotypes for all common HapMap SNPs (over 2 million in the European samples), even if only 500,000 have been directly genotyped in the study, by taking advantage of the redundancy due to LD. One of the major applications of imputation is to facilitate the comparison and aggregation of studies that use different GWAS arrays, by mapping everything to the common set of HapMap SNPs. This also obviates many of the practical difficulties that plagued candidate gene studies, in which different markers were typed in different studies.
The HapMap and GWAS in general are largely focused on assaying only common genetic variation: typically sites at which at least 5% of chromosomes carry an “alternate” allele compared with the reference sequence. The vast majority of variants that have population frequencies below 1% will not be present in the HapMap or on standard microarrays and so will be effectively invisible to GWAS approaches. A major push in recent years has been to leverage advances in so-called next-generation sequencing (NGS) technologies to build catalogs of lower frequency variation. This technology employs massively parallel approaches to sequence many millions of small fragments of DNA, generating very large numbers of short reads (around 100 bases) that can be mapped back to the reference sequence and variant sites called in an individual. The 1000 Genomes Project (www.1000genomes.org/) has used this technology to sequence the entire genomes of over 1,000 individuals, in order to create maps of known low-frequency variants and reference panels for imputation. Combining publicly available 1000 Genomes data with standard GWAS data, one can reliable impute over 10,000,000 polymorphic sites, many of which are of low frequency (under 1%) and many of which represent potentially functional polymorphisms (e.g., nonsynonymous allelic substitutions in genes, or short insertions and deletions that could shift the reading frame of a gene). To measure very rare mutations that are specific to a family or a particular ancestral group that is not represented in the 1000 Genomes data, it will still be necessary to sequence samples directly. But given current cost constraints, the 1000 Genomes data afford a new lease of life for existing GWAS samples. In addition to utility in imputing a good deal of low-frequency variation, these data may be particularly helpful in ascribing a putative function to associated regions or haplotypes, as a consequence of the near-complete ascertainment of all commonly variable sites.
Another type of genomic map that has recently been completed, and that will likely play a critical part in both the analysis and interpretation of many genetic studies of disease, is the ENCODE project (Encyclopedia of DNA Elements; http://www.genome.gov/10005107). This project aimed to map all functional elements in the human genome sequence beyond protein-coding genes: for example, regions (that may often be cell- and tissue specific) related to factors such as chromatin structure, methylation, histone modification, sequence-specific transcription factors, and RNA-binding proteins. As many association signals from GWAS fall outside of known protein coding genes, a more comprehensive annotation and understanding of the full sequence will be important in translating statistical signal into biological knowledge (Degner et al., 2012).
GENOME-WIDE ASSOCIATION STUDIES
In many respects, the development of reliable, cost-effective, high-throughput genotyping technologies, using microarrays that can simultaneously assay hundreds of thousands of single-nucleotide polymorphisms, has addressed all the basic limitations inherent in the early application of association (or linkage disequilibrium) mapping. Because almost all of the common variation in the genome can be assayed, genetic studies have become fundamentally data-driven enterprises and do not need to rely on prior hypotheses being correct. Order-of-magnitude, cheaper, per-genotype costs have enabled a large amount of genetic data to be amassed; the use of standardized microarrays (combined with imputation analysis) has also facilitated pooling of data across studies to achieve larger samples through meta-analysis, and therefore greater power, which is vitally important in complex trait genetics (Lohmueller et al., 2003). At the same time, the large multiple-testing burden inherent in genome-wide scans has forced investigators to address the issue of false positive rates early and head on in the context of GWAS. Based on empirical and theoretical considerations, most investigators now require a p-value of less than 5 × 10⁻⁸ for an association to be declared genome-wide significant. In a well-controlled study, findings that reach this stringent threshold have been shown to have a very high probability of replicating in subsequent studies. Finally, GWAS studies generally do a more comprehensive job at capturing common variation in a given gene compared with early candidate-based studies using older genotyping technologies, including capturing the vast amount of variation in intergenic regions).
APPLICATIONS OF GENOME-WIDE ASSOCIATION MAPPING AND ANALYTIC ISSUES
Genome-wide association studies have been very widely adopted for a large number of diseases. One of the pioneering studies was of seven diseases and a shared control sample, the Wellcome Trust Case Control Consortium (2007). The U.S. National Human Genome Research Institute (NHGRI) maintains a catalog (www.genome.gov/GWAStudies) of published associations from GWAS for a diverse range of diseases and traits. To date, over 1,600 associations have been published, all meeting the strict threshold of genome-wide significance (Figure 12.2).
There is a great deal of evidence to suggest that for most common diseases these genome-wide findings represent the tip of the iceberg of true common variant associations. In many cases, including for neuropsychiatric disease, there are multiple lines of evidence that point to an abundance of true signals below the formal threshold for genome-wide significance. When looking at many replicated genome-wide significant results, the statistical power to detect a variant of that frequency and reported effect size is typically low, even acknowledging that they may be inflated by the so-called “winner’s curse” effect (that means that effect sizes for variants that are detected at very strict significance thresholds will tend to be larger than their true value, reflecting the fact that they may have needed “the luck of the draw” from sampling variation to push them over the bar). This implies either that the investigator was extremely lucky (managing to detect one particular true positive despite very low power to do so) or, perhaps more parsimoniously, that there must be a (much) larger reservoir of similar effects truly existing, from which this study sampled a particular subset, in proportion to the statistical power. More directly, one can take sets of independent subthreshold associations (e.g., SNPs with p-values between 1 × 10⁻⁴ and 5 × 10⁻⁸) and ask whether more than expected are nominally significant in an independent sample (e.g., at P < 0.01 or P < 0.05), or show effects in a consistent direction (above 50% correspondence of risk versus protective effects expected by chance alone, often referred to as a “sign test”). For many diseases, such analyses strongly support the presence of many subthreshold true associations. Furthermore, approaches such as gene set–enrichment analysis applied to lists of subthreshold associations can be used to indicate whether the genes implicated appear to be a random selection of all genes, as would be expected if the associated regions were, in fact, selected purely by chance, as opposed to preferentially belonging to certain known pathways, or clustering in networks, beyond chance expectation—that is consistent with a nontrivial proportion of the associations being true positives. For example, Lango Allen et al. (2010) reported hundreds of variants influencing human height clustered in functionally related pathways. Evidence for a substantial number of likely true subthreshold associations for a given disease can be taken to indicate that larger sample sizes will yield genome-wide significant associations, as more true positives are pushed over the threshold.
Other studies have taken more direct approaches to address the idea of highly polygenic disease architectures (i.e., involving hundreds or thousands of distinct genetic loci). In particular, analyses of common variants in GWAS data for various highly heritable phenotypes, including height (Yang et al., 2010) and schizophrenia (International Schizophrenia Consortium, 2009), have indicated that a sizeable proportion of the total heritability may be due to the combined action of extremely modest effects across many loci (many of which may never be expected to rise to the level of genome-wide significance even in very large samples). Under such models it is likely unrealistic to ever expect a complete genetic model of a disease, although it is important to note that very high polygenicity (in which the power to unambiguously detect any one of a large number of loci is very low) does not by itself preclude progress toward the broader goals of genetic studies, namely, the identification of critical biological pathways and networks, and even individual risk prediction and personalized therapies.
Table 12.1 gives concrete numbers for the sample sizes required under different genetic models, for both common and rare variants of varying effect sizes. Given the large sample sizes indicated in Table 12.1 for the type of variant that characterizes most “GWAS hits,” meta-analysis (or combined, mega-analysis) has played an increasingly important role in genetic disease studies, in which consortia of consortia pool results or raw genotype data to collectively achieve greater power to detect variants of small effect.
TABLE 12.1. Sample sizes required (case/control pairs for a 1% disease) under different genetic models

Although it has become clear that Type II errors (false negatives) are the primary hurdle in GWAS (low power to detect small effects), there has been considerable attention to the issue of Type I errors (false positives). At the dawn of the GWAS era, many researchers were reasonably concerned that the massive multiple testing, as well as the scope for bias to arise from technical artifact or epidemiological confounding, would lead to hopelessly inflated false-positive signals. Given that most GWAS studies have been population based (utilizing samples of unrelated cases and controls) as opposed to family based, one concern was that population stratification might give rise to false positives, if cases and controls are not well matched for ancestry, given that different populations systematically vary in allele frequency at many sites across the genome, for reasons unrelated to the disease being studied. In contrast, association analyses that adopt a family-based approach (e.g., the transmission disequilibrium test, or TDT, which tests for overtransmission of a specific allele from heterozygous parents to affected offspring) implicitly guard against such confounding effects (e.g., by contrasting transmitted versus untransmitted alleles from within the same parent, in the case of the TDT). In practice, the presence of genome-wide genotypic data allows one to empirically assess the presence of heterogeneity in ancestry in a sample of individuals (Rosenberg et al., 2002), and to correct it statistically in tests of association (using approaches such as principal components analysis). Although most GWASs have been conducted in populations of European decent, there is potentially a lot to be learned from application to a more diverse range of populations, and new analytic challenges, for example, in highly admixed populations (Rosenberg et al., 2010). Quality control procedures play an important role in GWAS—for example, testing for deviations from Hardy-Weinberg equilibrium, or detecting SNPs with particularly high rates of failed genotyping. GWAS can still be prone to false positives from technical bias or other types of analytic error, simply by virtue of the large number of tests performed: this concern is in large part addressed by placing a strong emphasis on the need to seek replication in independent samples of any putative strong signals.

Figure 12.2 The National Human Genome Research Institute gwas catalog. A list of published GWAS associations published up until 9/2011 (www.genome.gov/GWAStudies). Shaded circles indicate different classes of phenotype, enumerated in text that follows. The shaded-coded key does a rather poor job at indicating which associations are mapped genomically, but perhaps more importantly, the legend does convey the breadth of phenotypes for which successful GWAS have been performed. Many of these discovered loci were completely novel.
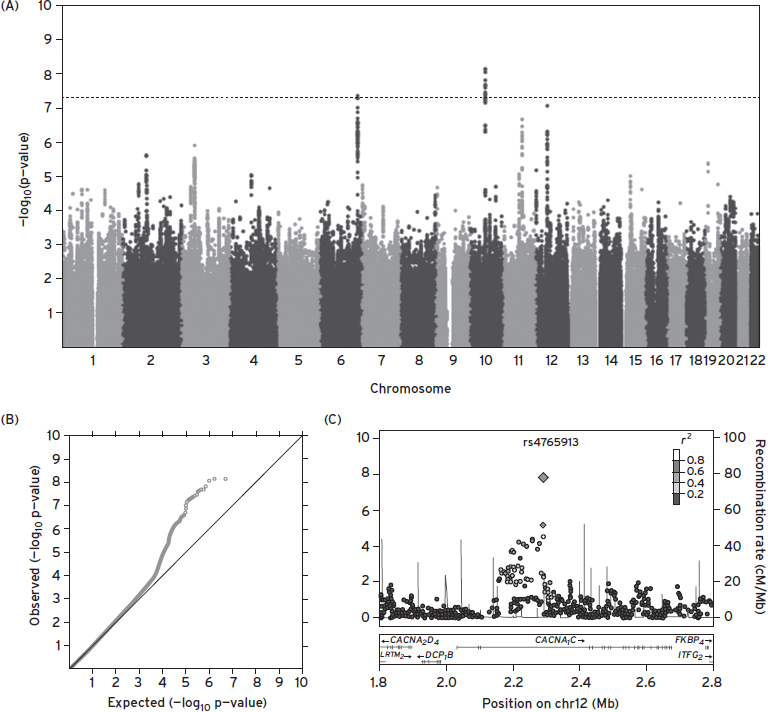
Figure 12.3 Reporting gwas results: Q-Q, Manhattan, and “regional” plots. These figures are taken from the Psychiatric Genomics Consortium Bipolar Disorder Working Group’s Nature Genetics 2011 report of a mega-analysis of bipolar disorder GWAS data. (A) A so-called “Manhattan plot,” in which individual SNP association statistics are ordered along the x-axis; the p-value is plotted on a –log10(P) scale, so values over 7.3 represent genome-wide significance. (B) The same data are shown in a Q–Q plot (quantile–quantile), which plots the observed statistic (−log10( P)) in rank order against the expected value under the global null hypothesis of no association. Points along the diagonal are therefore consistent with chance. The plots can show evidence of systematic bias (if the entire line grossly departs from the diagonal) or signal that is more likely to be true (if only the top portion of the data does, indicating there are more nominally significant hits than would be expected by chance). (C) A third commonly used plot when reporting GWAS results is a “region” plot. This shows the association statistics in a particular region as well as gives information on the LD (R2) between markers.(Psychiatric GWAS Consortium Bipolar Disorder Working Group, 2011)..
Although one in theory can approach the analysis of genotype–phenotype relations using GWAS data in a number of ways, in practice most of the substantive findings (as represented in the NHGRI catalog) come from simple, sequential tests of one SNP (either imputed or directly genotyped) at a time. Typically, a technique such as logistic or linear regression is employed, assuming a purely additive dosage model at each site. Simpler alternatives include Armitage trend test or Fisher’s exact test; more complex alternatives include nonparametric regression models, linear mixed models, and Bayesian approaches—in broad terms though, it is not obvious that the precise choice of statistical machinery employed would have impacted the substantive conclusions drawn to date.
Subsequent chapters summarize the results to date of GWAS and other types of genetic studies, for a range of neuropsychiatric diseases. There have been fewer, if any, cases of “low-hanging fruit” to emerge from common variant studies of diseases such as schizophrenia and bipolar disorder, compared with other common diseases such as Crohn’s disease or Type I diabetes. Nonetheless, numerous genome-wide significant hits have emerged for both disorders, and, as noted, consideration of subthreshold results would strongly suggest that more are to be expected with larger sample sizes. Indeed, several large meta-analyses are currently underway: the analysis of common variation in neuropsychiatric disease is very much a work in progress, but one that appears to have found a steady footing from which to move forward.
THE FREQUENCY SPECTRUM OF DISEASE ALLELES: MODELS OF RARE AND COMMON VARIATION
Almost by definition, most genetic variation is attributable to common polymorphism in the human genome. For this reason, along with the fact that common SNPs in any one population constitute a relatively limited and easily assayable universe, common variation was an obvious first target for large-scale, genome-wide genetic studies, in the form of SNP-based GWASs. It has, of course, long been recognized that common SNPs are by no means the only class of variation a geneticist may wish to study. Particularly in the context of disease, one can reasonably argue (supported by observations in rare, Mendelian disease) that larger types of variant—those impacting more than just a single, usually intergenic, nucleotide—might also be more likely to have a strong impact on disease risk. Structural variants are one such class, involving the deletion, duplication, inversion, or translocation of potentially millions of nucleotides. Similarly, evolutionary arguments can be used to suggest that alleles of high penetrance are unlikely to be very common, assuming the disease has had a continued, negative impact on fitness over many generations, and so would have been selected against. The hypothesis that rare variants may primarily underlie common disease risk, in the same way they do for rare disease, expresses this logic (Cirulli and Goldstein, 2010).
For schizophrenia, examples of very rare structural variants that are strong risk alleles were identified over two decades ago, using the classical techniques of cytogenetics and linkage mapping in extended pedigrees. For example, a 1.5–3 Mb microdeletion at 22q11.2 leads to velo-cardio-facial syndrome (VCFS), a phenotypically heterogeneous syndrome, which displays an approximately 30% probability of leading to schizophrenia. Because the deletion occurs at 1 in ~4,000 live births, this variant is expected to contribute to risk in ~1% of all schizophrenia patients.
A second example of a highly penetrant, rare structural variant is the balanced translocation between 1q42 and 11q14, segregating with major psychiatric disease in a single extended Scottish pedigree and mapped using linkage analysis. One of the translocations breakpoints was later shown to disrupt a particular gene, now known as DISC1, “disrupted in schizophrenia 1” (St. Clair et al., 1990). The success of mapping DISC1 prompted a wave of functional studies to investigate its roles in neurodevelopment, although the precise mechanism by which the translocation acts to increase risk for major psychiatric illness in this family still eludes researchers. Whether or not that mechanism is ever fully understood, many would argue that the finding still provides a useful window into the larger, more complex pathways involved in the disease.
In its extreme form, the multiple rare variant model is taken to mean that although many rare disease variants may exist in a population, most affected individuals will carry only one, which was sufficient to cause their disease; similarly, most unaffected individuals would not be expected to carry any risk alleles. This model is in contrast to the polygenic common variant model, in which both affected and unaffected individuals would be expected to carry many risk alleles: under this model, cases simply carry more of them on average, as a consequence of the increased genetic burden leading to increased risk of disease. The extreme form of the multiple rare variant model essentially recasts a common disease as a collection of multiple, clinically indistinguishable diseases—that could in theory also be etiological distinct in a fundamental manner, but that should often be amenable to the same family-based approaches that worked for Mendelian disease (i.e., if most affected families are, in fact, segregating a single, high-penetrance allele). In practice, extreme forms of the multiple–rare variant model are unlikely to be the general rule for any common disease (certainly if linkage analysis has been adequately performed in appropriately sized pedigree collections, this model can already be ruled out).
Perhaps a better default or working model for most common diseases should instead be that multiple variants of varying effect sizes are likely to exist anywhere across the frequency spectrum (Gibson, 2012; Owen et al., 2010). For diseases with childhood or early-adult onset at least, we would expect selection to constrain alleles of larger effect to lower population frequencies. Although the exact relationship between frequency and effect sizes arising from the action of selection will be hard to predict generally, it is safe to conclude that common variants of very large effect are unlikely to exist; otherwise, all combinations of variant will likely occur, in proportion to the frequency spectrum of neutral variation. What may make some diseases, including neuropsychiatric disease, particularly challenging from a genetic perspective, is likely to be the sheer number of loci in the genome that, if perturbed by either a rare or common variant, can increase risk for disease. This challenge will be equally pertinent for various study designs, from sequencing to GWAS.
STUDIES OF RARE STRUCTURAL VARIATION: COPY NUMBER VARIANTS AND NEUROPSYCHIATRIC DISEASE
Structural variants, such as the 22q11.2 deletion previously described, have a well-established role in a range of rare disease phenotypes as well as genomic alterations that occur in cancers (Mills et al., 2011; Wain et al., 2009). Technologies such as array-CGH (comparative genomic hybridization) are now routinely used in prenatal screening as well as research settings, replacing traditional karyotype techniques for detecting unbalanced chromosomal changes. Rare copy number variants (CNVs, deletions or duplications of genetic material) ranging from 100 kb or less to multiple megabases can also be called from analysis of the same SNP microarrays used in GWAS studies: this fortuitous fact has meant that relatively large GWAS samples have been able to be assayed for changes in copy number variation. For autism and schizophrenia (International Schizophrenia Consortium, 2008; Sebat et al., 2007), such events clearly play an important role. Several studies have found, in particular, an increased rate of de novo CNVs in both autism and schizophrenia patients: such events will effectively be uncensored with respect to natural selection. The increased rate of de novo mutation in schizophrenia patients is also consistent with epidemiological observations of increased paternal age (as the probability of a germ line mutation in the father is known to increase with his age also).
Approximately a dozen specific loci have been mapped with high statistical confidence, being likely to harbor CNVs that increase risk for disease (Sullivan et al., 2012). Such events are typically large (often impacting dozens of genes), rare in the general population (with a frequency under 1/1000), and are estimated to increase risk for disease by up to 10-fold or more. Interestingly, the same CNVs have been shown to increase risk both for autism and schizophrenia as well as other neurodevelopmental and behavioral disorders. In addition, autism and schizophrenia patients show a modest but significant increased burden of rare CNVs across their genomes, again consistent with the high polygenicity of neuropsychiatric disease. For other neuropsychiatric diseases, the role of CNVs is either less pronounced or no relationship has yet been clearly established.
NEXT-GENERATION SEQUENCING TECHNOLOGIES AND MEDICAL SEQUENCING
The advent of next-generation sequencing, as well as driving large genomics projects such the 1000 Genomes, has been widely and largely very successfully applied to a host of rare, Mendelian diseases over the past few years. One of the most common applications of NGS to date has been whole-exome sequencing (Bamshad et al., 2011). Here targeted approaches allow investigators to first greatly enrich the pool of DNA fragments to be sequenced for particular regions of interest: in the case of whole-exome sequencing, this involves “capturing” the ~1% of the genome that is known to contain exons of protein-coding genes. This relatively small fraction of the genome can then be sequenced at high depth (i.e., with 20 or more reads spanning most targeted bases) to ensure high sensitivity to detect if not all then at least the vast majority of variant (nonreference) sites present in an individual’s exome. In comparison with sequencing the whole genome, exome sequencing is still considerably cheaper per unit, although per base sequenced, it is less cost effective. In practice, though, sequence data on the exome is typically more valuable in the sense that any one variant has a higher prior likelihood of being functional, and that one can more readily ascribe and interpret that function in terms of its impact on the resulting gene product, and what else is known about that gene (e.g., where it is expressed, what other disorders are associated with mutations in that gene, what other proteins interact with the protein coded by that gene). Perhaps the main drawback with exome sequencing is the expanding definition of what is practically implied by “the exome”: other interesting regions such as regulatory regions near genes, rare transcripts, and noncoding RNAs are typically not captured comprehensively, and this fact alone may for many motivate the move to whole-genome sequencing. The amount of data generated by whole-genome sequencing is orders-of-magnitude larger than for the exome, and so computational challenges in analyzing and even storing the data become major concerns for large studies.
A typical exome-sequencing experiment on one individual currently targets around 200,000 genomic intervals, each usually corresponding to one exon of a protein-coding gene, around 150 bases in length, targeting around 20,000 RefSeq genes and spanning around 30 Mb of genomic sequence. In a high-depth sequencing study, each targeted base is often covered, on average, by as many as 50 to 100 “short reads.” These reads are typically 70–100 bases in length, often physically paired such that any two reads are expected to fall at nearby genomic locations. Variants are discovered by aligning these reads to the reference sequence and looking for differences: this is a technically involved and potentially error-prone procedure, although the informatics for this have improved markedly in the past few years, in no small part driven by large projects such as the 1000 Genomes. From a whole-genome sequencing study, one expects to find something on the order of 3 to 4 million variant sites; from whole-exome sequencing, this figure is typically in the range of 15,000–20,000 (depending on experimental details as well as the ancestry of the sampled individual).
When sequencing more than a few individuals, a very large proportion of all sites discovered will be “singletons”—variants observed in only one of the sequenced samples, and most of these will be novel, in the sense that they will not have been previously identified and deposited in databases such as dbSNP (http://www.ncbi.nlm.nih.gov/projects/SNP/), which currently contains around 50 million known variants. This fact alone clearly poses challenges for the analysis of sequence data to map risk alleles for disease. In practice, the rarity of individual variants means that researchers employ a range of methods to statistically aggregate multiple mutations across a particular gene and collectively test them for association with a disease, in so-called gene-based rare-variant analysis. Although large studies of thousands of patients and controls are underway, across a range of diseases, unambiguous discoveries are yet to emerge from these studies. For common, complex traits, exome sequencing will be much more challenging than for Mendelian disorders, and very large sample sizes may well be required, as is the case for studies of common variation (Kiezun et al., 2012).
Because genotyping technology is still cheaper and more accurate than sequencing, a number of groups have recently collaborated to create an exome array (http://genome.sph.umich.edu/wiki/Exome_Chip_Design): that is, a standard SNP microarray using the same technology deployed for GWAS, but that primarily contains approximately 200,000 low-frequency mutations that are nonsynonymous (alter the protein’s amino-acid sequence) and observed in at least two studies (and so represent variants that are segregating in populations at low frequencies, perhaps 0.1%, as opposed to truly “private” mutations that may be specific to single families and may never be seen again). Because this array is far cheaper than exome sequencing on a per individual basis, it can be applied rapidly to very large samples. Comprehensive results from these studies are not yet available, although by the end of 2013, we should have a very clear sense of whether this particular slice of the frequency spectrum of nonsynonymous SNPs plays a major role for many diseases, or goes toward explaining the heritability not directly accounted for by the top results of GWASs.
Other applications of sequencing to map rare variants for common diseases are using families rather than standard case control, population-based designs. Families can have a number of advantages: ascertaining families with an unusually high “density” of affected individuals for a given disease increases the probability that a rare highly penetrant variant is present in that family. One can, in principle, use IBD information from linkage analysis to prioritize specific regions of the genome for sequencing or analysis. One can use family information to resolve haplotype phase and to impute sequence data across family members (as related individuals, by definition, represent different combinations of the same smaller set of “founder” chromosomes). One disadvantage is that for many adult-onset diseases it is far harder to collect intact family collections in large numbers.
Additionally, one can use families to detect new, or de novo, mutations. In neuropsychiatric disease, and particularly autism and schizophrenia, the hypothesis that de novo mutation may play a significant role in disease risk is attractive to many researchers and is supported by the epidemiological observation that affected individuals tend to have older fathers (which is, in turn, known to correlate within increased germ line mutation that will be transmitted to offspring). A number of exome-sequencing studies using trios (affected offspring and two parents) have been published for these two diseases. The results to date are interesting and do point to nonrandom networks of genes that are enriched for highly deleterious mutations in patients. At the same time, it does not appear to be the case that a sizeable proportion of affected individuals carry a de novo mutation that is likely to be the sole cause of their disease; furthermore, relatively few genes have emerged that are observed to be recurrently hit by de novos across these studies beyond the level expected by chance—again speaking to the very high polygenicity of these diseases. The genes and mutations in specific patients that do emerge from this approach may well be particularly interesting to study, however, in that (because de novo mutations are effectively uncensored with respect to natural selection) they could in theory display a very high penetrance. Such “large-effect” alleles could in many cases be preferable mutations to follow up in functional studies, for example, using IPS cells or animal models.
Figure 12.4 illustrates some of the different genetic designs and technologies currently available for relating DNA variation to phenotype, in relation to the part of the allelic frequency spectrum they are designed to probe. Ultimately, it is likely that approaches that look for convergence of genetic signals across these different studies may be fruitful (Nejentsev et al., 2009).
INTEGRATIVE ANALYSES OF GENETIC NETWORKS AND PATHWAYS
Future progress in complex traits genetics is likely to rely on two factors, no matter what particular type of genetic study is adopted: (1) increasingly large sample collections and (2) integrative modeling approaches that not only consider genetic information from different studies as illustrated in Figure 12.4, but also consider multiple genetic signals in their broader context (Raychaudhuri, 2011). This includes intersection of multilocus genotype data with functional information, from gene expression studies, from protein–protein interaction networks, or from other curated gene sets and pathways. Jointly modeling the impact of risk variants on intermediate phenotypes or endophenotypes (Gottesman and Gould, 2003), for example, from brain imaging studies, and a fuller analysis of pleiotropic effects, where the same variant influences multiple (and potentially seemingly unconnected) disorders or traits (Cotsapas et al., 2011; Craddock et al., 2009), are both likely to be powerful approaches moving forward, particularly when seeded by solid knowledge of multiple associated loci from the primary genetics studies.
ALTERNATIVE GENETIC MODELS
The majority of genetic studies assume simple, additive models of effect, whether the variant is common or rare. On one hand this is typically a simplifying assumption of convenience made during analysis, although in practice it is often likely to be a reasonable one. Although there is little empirical evidence for nonadditive effects being a generally important component of the architecture of common disease, finding specific instances of such effects could be very informative. Examples of nonadditive effects include basic dominant/recessive (and compound heterozygote) models at a single locus and extended regions of homozygosity due to recent inbreeding unmasking rare recessive effects (Keller et al., 2012), interaction between genes (epistasis as reviewed by Cordell [2009]), and between genes and environments (Thomas, 2010), as well as sex-specific, imprinting, and parent-of-origin effects. Whether or not allowing for these more complex, potentially unbounded models will help to map disease genes is unclear, but in any case, intensive study of the growing number of genes already mapped by the additive models with respect to these alternate models (including pleiotropic effects on other phenotypes) has potential to be a great value.

Figure 12.4 Summary of genetic study types targeting different intervals of the allelic frequency spectrum. The values along the horizontal bar indicate the minor allele frequency that is targeted by different genetic technologies, from common variation to sequencing for newly arising mutation.
SUMMARY
The tools available to the complex trait geneticist have evolved rapidly over the past decade. Consequently, psychiatric genetics has made considerable progress during the same time frame (Sullivan et al., 2012). Different genetic strategies, from studies of de novo variation in exome sequencing, large deletion and duplication copy number variants, and rare and low-frequency variants segregating in populations, to common polymorphisms are underway. It seems clear that all approaches will continue to bear fruit in the coming years, although the full promise of neuropsychiatric genetics is not yet achieved. In the (hopefully not too distant) future, the interpretation of multiple genetic associations in their biological context, rather than their initial discovery per se, will increasingly become the central challenge faced, but it will remain critically grounded on the initial gene discovery work going on today.
DISCLOSURE
Dr. Purcell has no conflicts of interests to disclose.
REFERENCES
Altshuler, D., Daly, M.J., et al. (2008). Genetic mapping in human disease. Science 322(5903):881–888. (PMID: 18988837)
Bamshad, M.J., Ng, S.B., et al. (2011). Exome sequencing as a tool for Mendelian disease gene discovery. Nat. Rev. Genet. 12(11):745–755.
Browning S.R., and Browning, B.L. (2012). Haplotype phasing: existing methods and new developments. Nat. Rev. Genet. 12:703–714.
Carlson, C.S., Eberle M.A., et al. (2004). Mapping complex disease loci in whole-genome association studies. Nature 429(6990):446–452. (PMID: 15164069)
Cirulli, E.T., and Goldstein, D.B. (2010). Uncovering the roles of rare variants in common disease through whole-genome sequencing. Nat. Rev. Genet. 11(6):415–425. (PMID: 20479773)
Cordell H.J. (2009). Detecting gene–gene interactions that underlie human diseases. Nat. Rev. Genet. 10:392–404.
Cotsapas C., Voight, B.F., et al. (2011). Pervasive sharing of genetic effects in autoimmune disease. PLoS Genet. 7(8) (PMID: 21852963)
Craddock, N., Kendler, K., et al. Cross-Disorder Phenotype Group of the Psychiatric GWAS Consortium. (2009). Dissecting the phenotype in genome-wide association studies of psychiatric illness. Br. J. Psychiatry 195(2):97–99.
Degner, J.F., Pai, A.A., et al. (2012). DNase I sensitivity QTLs are a major determinant of human expression variation. Nature 482(7385):390–394.
ENCODE Project Consortium. (2012). http://www.nature.com/encode/
Encyclopedia of DNA Elements. URL http://www.genome.gov/10005107
Genetic Power Calculator http://pngu.mgh.harvard.edu/purcell/gpc/
Gibson, G. (2012). Rare and common variants: twenty arguments. Nat. Rev. Genet. 13(2):135–145. (PMID: 22251874)
Gottesman I., and Gould, T. (2003). The endophenotype concept in psychiatry: etymology and strategic intentions. Am. J. Psych. 160(4):636–645. (PMID: 12668349)
International HapMap Consortium. (2007). A second generation human haplotype map of over 3.1 million SNPs. Nature 449:851–861.
International Schizophrenia Consortium. (2008). Rare chromosomal deletions and duplications increase risk of schizophrenia. Nature 455:237–241.
International Schizophrenia Consortium. (2009). Common polygenic variation contributes to risk of schizophrenia and bipolar disorder. Nature 460(7256):748–752. Epub 2009 Jul 1.
Keller M.C., Simonson, M.A., et al.; Schizophrenia Psychiatric Genome-Wide Association Study Consortium. (2012). Runs of homozygosity implicate autozygosity as a schizophrenia risk factor. PLoS Genet. 8(4):e1002656.. (PMID: 22511889)
Kiezun, A., Garimella K., et al. (2012). Exome sequencing and the genetic basis of complex traits. Nat. Genet. 44(6):623–630. (PMID: 22641211)
Kim, Y., Zerwas S., et al. (2011). Schizophrenia genetics: where next? Schizophr. Bull. 37(3):456–463.
Lango Allen H., Estrada, K., et al. (2010). Hundreds of variants clustered in genomic loci and biological pathways affect human height. Nature 467:832–838.
Lichtenstein, P., Yip, B.H., et al. (2009). Common genetic determinants of schizophrenia and bipolar disorder in Swedish families: a population-based study. Lancet 373(9659):234–239.
Lohmueller, K.E., Pearce, C.L., et al. (2003). Meta-analysis of genetic association studies supports a contribution of common variants to susceptibility to common disease. Nat. Genet. 33:177–182.
Mills, R.E., Walter, K., et al.; 1000 Genomes Project. (2011). Mapping copy number variation by population-scale genome sequencing. Nature 470(7332):59–65. (PMID: 21293372)
Nejentsev, S., Walker, N., et al. (2009). Rare variants of IFIH1, a gene implicated in antiviral responses, protect against type 1 diabetes. Science 324(5925):387–339. (PMID: 19264985)
NHGRI GWAS Catalog: A Catalog of Published Genome-Wide Association Studies. http://www.genome.gov/gwastudies/
Owen M.J., Craddock, N., et al.(2010). Suggestion of roles for both common and rare risk variants in genome-wide studies of schizophrenia. Arch. Gen. Psychiatry 67(7):667–673. (PMID: 20603448)
Psychiatric GWAS Consortium Bipolar Disorder Working Group. (2011). Large-scale genome-wide association analysis of bipolar disorder identifies a new susceptibility locus near ODZ4. Nat. Genet. 43(10):977–983.
Raychaudhuri S. (2011). Mapping rare and common causal alleles for complex human diseases. Cell 147(1):57–69. (PMID: 21962507)
Rosenberg, N.A., Huang, L., et al. (2010). Genome-wide association studies in diverse populations. Nat. Rev. Genet. 11(5):356–366. (PMID: 20395969)
Rosenberg, N.A., Pritchard J.K., et al. (2002). Genetic structure of human populations. Science 298(5602):2381–2385.
Risch, N., and Merikangas, K. (1996). The future of genetic studies of complex human diseases. Science 273(5281):1516–1517. (PMID: 8801636)
Sebat J., Lakshmi, B., et al. (2007). Strong association of de novo copy number mutations with autism. Science 316:445–449.
Smith G.D., and Ebrahim, S. (2003). “Mendelian randomization”: can genetic epidemiology contribute to understanding environmental determinants of disease? Int. J. Epidemiol. 32(1):1–22.
St Clair, D., Blackwood D., et al. (1990). Association within a family of a balanced autosomal translocation with major mental illness. Lancet. 336(8706):13–16. (PMID 1973210)
Sullivan, P.F., Daly M.J., et al.(2012). Genetic architectures of psychiatric disorders: the emerging picture and its implications. Nat. Rev. Genet. 13(8):537–551. (PMID: 22777127)
Thomas, D. (2010). Gene-environment-wide association studies: emerging approaches. Nat. Rev. Genet. 11(4):259–272.
The 1000 Genomes Project Consortium. (2010). A map of human genome variation from population-scale sequencing. Nature 467(7319):1061–1073.
van Dongen J., Slagboom, P.E., et al. (2012). The continuing value of twin studies in the omics era. Nat. Rev. Genet. 13:640–653.
Wain L.V., Armour, J.A., et al. (2009). Genomic copy number variation, human health, and disease. Lancet 374(9686):340–350. (PMID: 19535135)
The Wellcome Trust Case Control Consortium. (2007). Genome-wide association study of 14,000 cases of seven common diseases and 3000 shared controls. Nature 447:661–678.
Yang J., Benyamin, B., et al. (2010). Common SNPs explain a large proportion of the heritability for human height. Nat. Genet. 42(7):565–569.