15 | BRAIN IMAGING METHODOLOGIES
HANZHANG LU, YIHONG YANG, AND PEIYING LIU
Neuroimaging is versatile in that it contains many submodalities that can reflect different aspects of brain anatomy, physiology, and function. Collectively, they provide a powerful toolbox for researchers and clinicians to better understand the neurobiology of the disease and improve diagnosis. The greatest advantage of neuroimaging is that most modalities can be performed noninvasively; thereby it represents the most direct means to “look” inside the brain in living humans. This chapter focuses on several emerging methodologies that are capable of making a major impact in mental illness in the coming years.
MEASUREMENT OF CEREBRAL PERFUSION USING MRI
Estimation of cerebral perfusion parameters provides a useful means to evaluate tissue integrity and viability (Alsop et al., 2000; de Crespigny et al., 1998; Harris et al., 1996; Loeber et al., 1999). It should be emphasized that the utility of cerebral perfusion measurement is not limited to diseases of vascular origin (e.g., stroke or vascular dementia), but many psychiatric and neurologic diseases may also benefit from perfusion measurement. The reason is that perfusion measures can provide an indirect index of neural activity in the brain parenchyma due to neurovascular coupling (Roy and Sherrington, 1890). That is, if the brain region has greater neural activity, the local perfusion tends to be greater, too (Kuschinsky, 1996). Over the past few years, several MRI techniques have been extensively tested for the purpose of perfusion measurement, and they can now be used to quantitatively study perfusion parameters, including cerebral blood flow (CBF), cerebral blood volume (CBV), and mean transit time (MTT).
Dynamic susceptibility contrast (DSC) MRI uses a Food and Drug Administration (FDA)-approved MR contrast reagent (namely, the gadolinium complex of diethylenetriamine pentaacetic acid, Gd-DTPA) administered intravenously and employs rapid image acquisitions (e.g., 1 image/second) to monitor the first passage of the reagent in the brain (Ostergaard et al., 1996b; Rosen et al., 1990). Unlike perfusion tracers used in positron emission tomography (PET), the Gd-DTPA reagent is a nondiffusable tracer and does not penetrate the blood–brain barrier (BBB). However, using a model that accounts for the input–output functions of the vasculature, it is still possible to estimate the perfusion parameters, including CBV, CBF, and MTT (Ostergaard et al., 1996a, 1996b). One important requirement to accurately determine perfusion using DSC MRI is the estimation of arterial input function (AIF), which describes the time course of the reagent concentration in the incoming arterial blood (Calamante et al., 2004; Rausch et al., 2000; van Osch et al., 2003). This is typically done by selecting pixels containing large arteries and using the averaged time course as the AIF (Cha et al., 2005; Law et al., 2004). If absolute quantification is not necessary, one can calculate the relative perfusion parameters by normalizing the values against the value in a region-of-interest (ROI), often the white matter.
A steady-state (SS) contrast MRI approach can also be used to evaluate cerebral perfusion, in this case only the CBV. This method acquires two MRI images before and after the contrast reagent injection and utilizes the fact that Gd-DTPA is an intravascular reagent and only occupies the vascular space (Kuppusamy et al., 1996; Lu et al., 2005; Moseley et al., 1992; Schwarzbauer et al., 1993). As a result, the difference signal is proportional to the CBV. Several variants of the technique are available, and their main differences reside in the use of different methods to normalize the signal, thereby converting the dimensionless MRI signal to physiologic values. Figure 15.1 shows a CBV map using the vascular-space-occupancy (VASO) approach, in which the normalization factor was obtained from a cerebrospinal fluid (CSF) region (Lu et al., 2005). In comparison with DSC MRI, the SS contrast MRI has the advantages that the model is relatively simple and does not require the knowledge of the AIF. In addition, the SS approach does not require rapid acquisitions; therefore, higher spatial resolution can be achieved and the image distortion is minimal. A pitfall is that this technique only estimates CBV (Lu et al., 2005), but not other parameters such as CBF, which is believed to be more useful in predicting tissue viability.
Cerebral blood flow can also be evaluated noninvasively using a technique called arterial spin labeling (ASL) MRI (Aslan et al., 2010; Dai et al., 2008; Detre et al., 1992; Detre and Alsop, 1999; Edelman et al., 1994; Golay et al., 1999; Kim, 1995; Kwong et al., 1995; Wong, 2007; Wu et al., 2007). The ASL pulse sequence starts with a radiofrequency (RF) pulse to magnetically label the incoming blood in the arterial vessels. Then, after a certain waiting period (1–2 seconds) to allow the blood to flow into the perfused tissue, an image is taken that contains signal from labeled blood and static tissue. In a second scan, the blood is not labeled, and similar waiting and acquisition schemes are undertaken. By subtracting one image from the other, the static tissue signal is canceled out, and the remaining difference image reflects the amount of labeled blood water that has flowed into the tissue, which can be used to calculate CBF. This technique can now measure a whole-brain CBF map within 5 minutes on a standard clinical MRI scanner; thus, it can be easily included in an imaging session with relatively little added cost. Figure 15.2 shows a CBF map measured with a pseudocontinuous ASL method. The main advantage of the ASL technique is that the experimental procedure is noninvasive and straightforward. A pitfall is that the quantification is not trivial, and it involves several confounding factors, including arterial transit time and vessel signal contributions (Buxton et al., 1998; Calamante et al., 1996; Hendrikse et al., 2003; Liu et al., 2011; Yang et al., 2000).
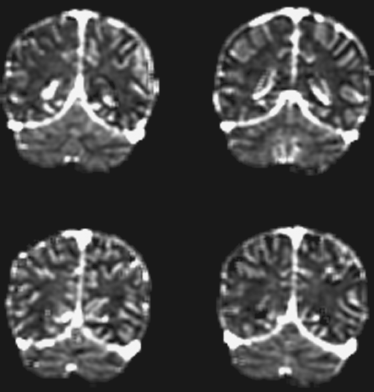
Figure 15.1 Absolute cerebral blood volume maps using VASO MRI. Imaging parameters: coronal slices, resolution 1.5 × 1.5 mm2; acquisition time was 5 minutes.
ASSESSING BRAIN FUNCTIONS USING MRI
Neuronal activity in the brain is accompanied by an increased consumption of glucose and oxygen. In addition, there are pronounced changes in blood supply to the activated regions, characterized by increased CBF and CBV (Roy and Sherrington, 1890). The precise mechanism of this neurovascular coupling is not clear. But it is thought to be mediated by one or more factors related to metabolism and/or neurotransmitters (Iadecola, 2004). Regardless of the mechanism, it is important to note that the increase in blood supply overcompensates for the increase in oxygen metabolism. As a result, the blood oxygenation in the draining veins and the capillaries is actually more oxygenated during the stimulation period compared with the resting state. This forms the basis of blood oxygenation level–dependent (BOLD) functional magnetic resonance imaging (fMRI) signal (Kwong et al., 1992; Ogawa et al., 1992). The hemoglobin in erythrocytes has different MR properties during the oxygenated and deoxygenated states. Deoxygenated blood is paramagnetic, which reduces the transverse relaxation times (T2 and T2*) of the water signal (inside the blood compartment and outside the blood compartment), whereas oxygenated blood is not paramagnetic. As a result, the MR signal is directly correlated with the amount of deoxyhemoglobin in the voxel (Ogawa et al., 1993). The BOLD effect on T2* is more pronounced than that on T2. As a result, the T2* weighted gradient-echo echo-planar-imaging (EPI) sequence is the most widely used pulse sequence.
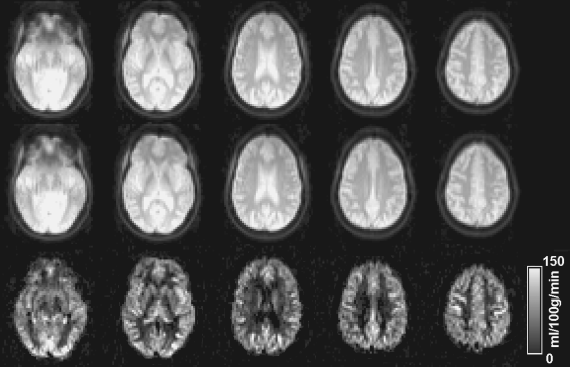
Figure 15.2 Absolute cerebral blood flow (CBF) maps using pseudocontinuous ASL MRI. The duration of the image acquisition was approximately 5 minutes and no contrast agent was used.
While evoked fMRI based on specific external stimuli has been used for more than two decades, there has been a recent surge in the use of BOLD MRI to study resting-state brain activity. We therefore focus our discussion on the resting state fMRI. Since the current analysis of the resting state data has primarily focused on the connection between two or more brain regions rather than individual regions, this technique is also known to as functional connectivity MRI (fcMRI).
Intrinsic brain activity can be investigated using spontaneous fluctuations in resting-state fMRI signals (Biswal et al., 1995). As illustrated in Figure 15.3, fMRI signals from the left and right primary sensorimotor cortices show highly synchronized fluctuations at rest, and “functional connectivity” maps based on the synchrony can be obtained by cross-correlation analysis using signal from a selected brain area as a “seed point” or reference. Brain connectivity maps in the absence of task performance have been reported to follow specific brain circuits, including sensorimotor, visual, auditory, and language-processing networks (Beckmann et al., 2005; Biswal et al., 1995; Cordes et al., 2000; Fox et al., 2005; Greicius et al., 2003; Lowe et al., 1998; Xiong et al., 1999). Among these observations, the existence of a brain network including posterior cingulate cortex (PCC) and medial prefrontal cortex (MPF) has been reported (Fox et al., 2005; Greicius et al., 2003). This finding supports previous suggestions that there is a functionally significant “default brain mode” in the resting state (Gusnard et al., 2001; Raichle et al., 2001). Because the brain expends a considerable amount of energy for neuronal-signaling processes in the absence of a particular task (Shulman et al., 2004; Sibson et al., 1998), it is further argued that, in pursuit of better understanding of brain functions, observation of intrinsic brain activity may be at least as important as that of evoked activity (Gusnard et al., 2001; Raichle et al., 2001).
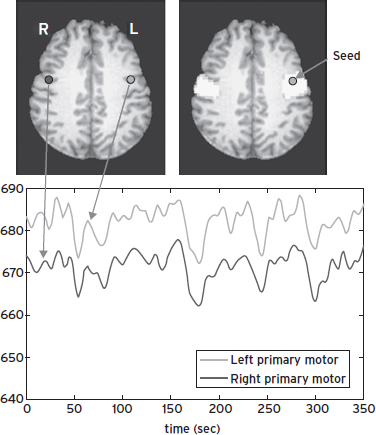
Figure 15.3 Functional MRI signals at rest (bottom) from the left and right primary sensorimotor cortices (upper left), and functional connectivity map (upper right), obtained from cross-correlation analysis using the left sensorimotor cortex as a reference.
Various applications of resting-state fMRI to brain diseases have been demonstrated, including studies of Alzheimer’s disease (Greicius et al., 2003; Li et al., 2002), schizophrenia (Liang et al., 2006), epilepsy (Waites et al., 2006), cocaine dependence (Li et al., 2000), and antidepressant effects (Anand et al., 2005). Using a cross-correlation-based analysis method, Li et al. (2002) quantified functional synchrony in the hippocampus of patients with Alzheimer’s disease and demonstrated lower correlation of signals in patients with Alzheimer’s disease compared with age-matched mild cognitive impairment (MCI) participants and healthy controls. Their study suggested that resting-state synchrony may be used as a quantitative marker for diagnosis and stage of Alzheimer’s disease. Greicius et al. (2003) investigated the default brain mode activity in patients with Alzheimer’s disease using independent component analysis (ICA). They found that patients with Alzheimer’s disease showed decreased resting-state activity in the posterior cingulate and hippocampus, suggesting disrupted connectivity between these two brain regions, consistent with the posterior cingulated hypometabolism commonly found in previous PET studies of early Alzheimer’s disease. These studies demonstrated the utility of resting-state functional connectivity in the study of neurological and neuropsychiatric disorders.
Advanced approaches for analyzing resting-state fMRI data, beyond the traditional seed-based and ICA methods, have been developed in recent years. Quantitative analysis of complex networks, based on graph theory, has been successfully exploited to study brain organizations (Bullmore and Sporns, 2009; Sporns et al., 2005). Graph theory analyzes “graphs” consisting of nodes (e.g., anatomical regions of the brain) and edges (e.g., functional connectivity strength) connecting the nodes. It has been shown that brain systems exhibit topological features of complex networks, including “small-world” characteristics (Watts and Strogatz, 1998), modular structures (Meunier et al., 2010), and highly connected hubs (Buckner et al., 2009). For example, a small-world network possesses both high clustering and short path lengths, resulting in efficient information transfer on both local and global scales. The human brain, like many other networks such as social network and electrical power grids, has small-world properties representing an optimal balance between integration and segregation between subunits. Network analysis methods have been demonstrated to be useful in identifying dynamic changes of brain networks associated with development (Fan et al., 2011), aging (Wu et al., 2012), and neuropsychiatric diseases (Yao et al., 2010).
Despite extensive applications of resting-state functional connectivity in basic and clinical studies, the underlying neural mechanisms of these synchronized fluctuations in resting-state fMRI signal remain obscure. Effort has been made in recent years to investigate whether these coherent fluctuations have a neural basis. Using an animal model, the mechanisms were first examined by combined electrophysiological recordings and fMRI scans in the resting rat brain (Lu et al., 2007). It was demonstrated that the interhemispheric γ-band power correlation and functional connectivity between the left and right somatosensory cortices were significantly greater than those between the somatosensory cortex and the visual cortex, and the electrophysiological and hemodynamic metrics were significantly and similarly modulated by anesthetic dose, suggesting a region-specific and anesthetic-induced state-dependent effect (Lu et al., 2007). The tight relationship between electrophysiological and resting fMRI signals was also demonstrated in human brains in patients with intractable epilepsy undergoing evaluation with surgically implanted grids of subdural electrodes (He et al., 2008). These studies provided an important bridge between the brain networks readily revealed by spontaneous BOLD signals and their underlying neurophysiology.
DIFFUSION-BASED MRI TECHNIQUES
Diffusion occurs as a result of random thermal motion of small particles such as water molecules in a given medium. The effects of molecular diffusion on MR signals have been studied since 1950s (Carr and Purcell, 1954; Hahn, 1950). A significant improvement of diffusion measurement using MR techniques was made in 1960s (Stejskal and Tanner, 1965) by utilizing magnetic gradient pulses to encode the phase dispersion caused by diffusion. Diffusion-weighted imaging (DWI) was developed in 1980s (Le Bihan et al., 1986) as an integration of MRI and diffusion-sensitive magnetic gradients. In ideal free diffusion, the diffusivity is uniform along all directions, or isotropic. However, a diffusion process in biological tissue, such as brain white matter, could be anisotropic because the diffusive molecules may experience direction-dependent restrictions due to specific arrangements of tissue structures. Diffusion tensor imaging (DTI) was developed in 1990s (Basser et al., 1994) as a tool to quantify the anisotropy of diffusion in biological tissue. An important advantage of DTI is that it provides rotation-invariant measurements, which means that the measurements are independent from participant positions, thus making longitudinal and group comparisons possible (Basser and Pierpaoli, 1996). In recent years, “beyond-tensor” imaging techniques (Tuch et al., 2003) have been proposed to overcome challenges encompassed in DTI, such as the handling of complex white matter structures. Tractography, a promising technique to delineate neuronal pathways based on DTI or beyond-tensor techniques, has also been developed (Xue et al., 1999).
PRINCIPLES OF DIFFUSION MRI
For unrestricted diffusion in a three-dimensional space, the displacements of an ensemble of molecules can be described by the Einstein equation (Einstein, 1926)

where <r2> is the mean-squared displacement, τD is the diffusion time, and D is the diffusion coefficient. Fundamental principles of diffusion MRI can be illustrated by the traditional pulsed gradient experiment (Stejskal and Tanner, 1965) designed to measure the spin echo signal attenuation caused by phase dispersion of diffusive nuclear spins in the presence of diffusion-sensitive gradients. As illustrated in Figure 15.4, in a spin echo pulse sequence, a pair of identical gradients is placed on both sides of the 180-degree refocus RF pulse. For a static spin, the two gradients would result in phase shifts with the same magnitude but opposite signs, respectively, leading to cancellation of the phase change at the echo time. However, for a diffusive spin the gradients would produce a net phase shift, and phase dispersion in an ensemble of spins would cause signal attenuation at the echo time. The spin echo signal in the presence of diffusion gradients, S(b) , with respect to that in the absence of the gradients, S(0), can be expressed as
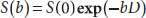
where b is called “b-factor,” a measure of the strength of the diffusion-weighting gradients, and is determined by the duration of the gradients δ, separation of the gradients Δ, and the amplitude of the gradient G. For the setting in Figure 15.4, b = γ2G2Δ2(Δ–δ/3), where γ is the gyromagnetic ratio. Diffusion MRI can be implemented by a combination of an imaging sequence with the diffusion-sensitive gradients to map diffusion coefficient in an object. Diffusion coefficient measured in biological tissue is often influenced by restricted diffusion due to complex microscopic structures as well as macroscopic motion such as blood perfusion, and therefore, diffusion strength measured in biological systems is generally termed apparent diffusion coefficient or ADC.
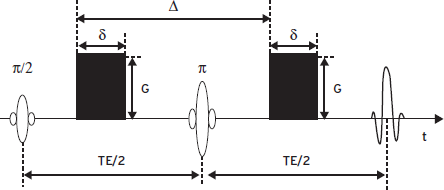
Figure 15.4 Schematic diagram of the Stejskal-Tanner pulsed gradient diffusion experiment.
DIFFUSION TENSOR IMAGING
Diffusion tensor imaging is a diffusion-imaging technique to characterize diffusion anisotropy (Basser et al., 1994). Molecular diffusion in biological tissue is often anisotropic due to varied restriction along different directions. For instance, water molecules in a white matter fiber fascicle typically diffuse faster along the fibers compared with those that cross the fibers. Diffusion in such an anisotropic medium needs to be described by multiple diffusion coefficients accounting for the direction dependence. In the formulation of DTI (Basser et al., 1994), the diffusion coefficient is no longer characterized by a scalar parameter D, but rather, by a 3 × 3 tensor D:
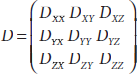
where Dij(i, j = x, y, z) denotes the cross-correlation of the diffusion coefficient between the i and j axis, and thus, D is always symmetric, that is, Dij = Dji. Similarly, a 3 × 3 matrix b is employed in DTI with elements bij representing the b-factor corresponding to the element Dij in D. Thus, the diffusion-weighted signal attenuation can be expressed in the DTI formulation,
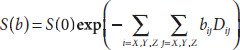
To determine the six independent elements in D, one needs to perform at least six diffusion-weighted measurements with the b matrices independent from each other. An additional experiment is also needed to provide a nondiffusion-weighted reference image. Therefore, a minimum of seven measurements is required to determine the diffusion tensor D. Recent studies have indicated that using more directions for diffusion encoding generally helps to improve the accuracy and/or the efficiency of the DTI technique, if these directions are appropriately optimized (Le Bihan et al., 2001).
Diffusion tensor can be analyzed based on the eigen-analysis theorem (Golub and Van Loan, 1996). Several rotation-invariant indices have been widely used to visualize and quantify diffusion tensor maps in biological applications. These include (Basser et al., 1994) the mean diffusivity (MD), the average diffusion strength in all directions
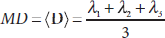
and the fractional anisotropy (FA), a normalized (0 ≤ FA < 1) degree of the diffusion anisotropy
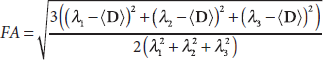
where λ1, λ2, and λ3 are eigenvalues of the diffusion tensor. Figure 15.5 illustrates maps of MD and FA calculated from the diffusion tensor map acquired from a human brain. In general, the MD map shows high intensities in ventricles and gray matter, where the diffusion is relatively isotropic with higher strength. The FA map highlights the white matter tracts in the brain, where the diffusion is highly anisotropic. The primary eigenvector of the diffusion tensor is useful to indicate the orientation of the well-organized tissue, such as fiber boundless in white matter, and can be used to track neural pathways.
“BEYOND-TENSOR” DIFFUSION TECHNIQUES
Despite the success of DTI in a variety of applications, challenges exist in handling complex brain structures, in which diffusion patterns are far more complicated than a tensor model can deal with. For instance, DTI often fails to correctly describe diffusion patterns in brain areas with fiber crossings. In the case of multiple fiber components sharing a single voxel, the major eigenvector of the diffusion tensor could be substantially biased from the actual fiber orientation, resulting in misleading fiber tracing. This is fundamentally limited by the tensor model because the diffusion tensor is only a second-order approximation (in terms of mean square fitting) to the real three-dimensional diffusion process (Basser et al., 2000). “Beyond-tensor” diffusion techniques based on higher order mathematical models, such as high angular resolution diffusion (HARD) and q-space imaging (QSI) have been proposed recently to overcome these difficulties (Frank, 2001; Jensen et al., 2005; Tuch et al., 2003; Zhan et al., 2004).
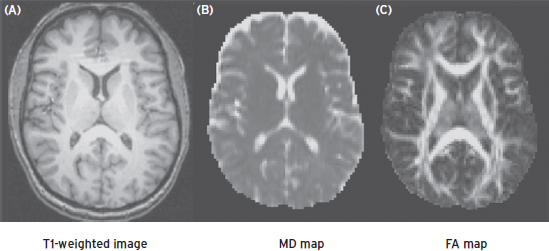
Figure 15.5 T1-weighted image (A) and corresponding mean diffusivity (B) and fractional anisotropic (C) images of a brain section.
MAGNETIC RESONANCE SPECTROSCOPY
Magnetic resonance spectroscopy (MRS) is a noninvasive technique that can be used to investigate biochemistry of living systems. The first in vivo 31P MRS experiment was conducted on a mouse head using a conventional spectrometer with a RF coil surrounding the entire head (Chance et al., 1978). Spectra of brain without contamination from other tissues were first obtained using a localization technique with a surface coil (Ackerman et al., 1980). In the past decades, MRS has evolved into a powerful tool for biological research and clinical diagnosis. Unlike MRI, which measures the signal from protons in water molecules, MRS usually detects the signal from compounds in much lower concentrations. Besides the most sensitive nuclear 1H, MRS can also detect a range of nuclei including 31P, 13C, 19F, 15N, 23Na, and 7Li.
SPATIAL LOCALIZATION
The simplest way to obtain a localized spectrum is to use a surface coil, which produces a limited excitation volume close to the coil (Ackerman et al., 1980). The sensitivity distribution of the volume depends on the shape and orientation of the coil. For a single-loop coil, the selective volume is roughly a cylindrical region with a radius and length about the same as the coil radius. A disadvantage of using surface coils for localization is that the sensitivity is extremely inhomogeneous in the volume, which makes quantification of spectroscopic data difficult.
Single-volume spectroscopy techniques use shaped RF pulses along with field gradients to selectively excite the spins in a defined volume. The most commonly used approaches in this category are point resolved spectroscopy (PRESS) (Bottomley, 1984) and stimulated echo acquisition mode (STEAM) (Frahm et al., 1987). Similar to slice selection in imaging, these techniques select a volume using three slab-selective RF pulses in the presence of field gradients in three orthogonal directions. A spin echo or stimulated echo is formed by the signal from the intersection of the three selected slabs.
Spectroscopic imaging (SI) or chemical shift imaging (CSI) uses phase encoding and/or frequency encoding to obtain spatial and spectroscopic information (Brown et al., 1982; Lauterbur et al., 1975). Like imaging, this technique acquires spectroscopic data in a matrix of spatially resolved voxels, allowing for observation of spectra in multiple regions simultaneously.
1H MRS
Proton MRS can reliably detect N-acetyl-aspartate (NAA), creatine (Cr)/phosphocreatine (PCr), choline (Cho)-containing compounds including phosphocholine (PC) and glycerophosphocholine (GPC), and myo-inositol (Ins) in the brain. At high field strengths (>7 T), glutamate (Glu), glutamine (Gln), and other metabolites can be resolved. A spectrum acquired from the cingulate of a rat brain at 9.4 T is illustrated in Figure 15.6.
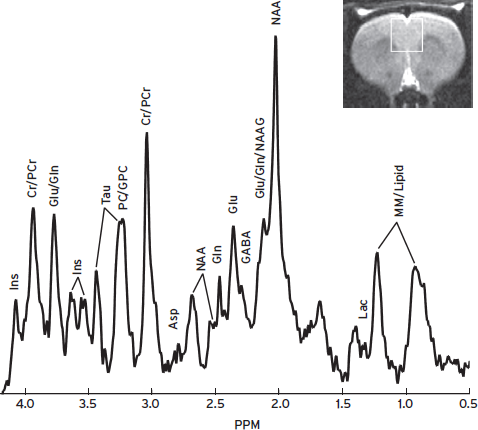
Figure 15.6 A STEAM spectrum from the rat cingulate, volume size = 3 × 3 × 3 mm3, TR/TE/TM = 3000/9.1/10 ms, NEX = 300. Asp = aspartate, Cr = creatine, GABA = γ-aminobutyric acid, Gln = glutamine, GPC = glycerophosphocholine, Glu = glutamate, Lac = lactate, Ins = myo-inositol, NAA = N-acetyl-aspartate, NAAG = N-acetyl-asparty-glutamate, PC = phosphocholine, PCr = phosphocreatine, Tau = taurine, MM = macromolecules.
Brain metabolites measured by 1H MRS are involved in cellular metabolism, neurotransmission, and cell membrane synthesis, or serve as a marker specific to neurons or glia (de Graaf, 1998; Govindaraju et al., 2000). NAA is commonly believed to be a marker of mature neurons, and a reduction of NAA level in the brain is indicative of neuronal loss and/or dysfunction. The protons of an N-acetyl CH3 group provide the most prominent singlet resonance at 2.02 ppm, which can be measured robustly. Cr and PCr are observed as a strong singlet resonance at 3.03 pm. The Cr/PCr level is relatively stable across the brain and is, therefore, often used as an internal concentration reference. This measure should be used with caution because reduced levels of Cr are observed in some pathological conditions, such as tumors and stroke. Cho is an important precursor of cell membrane synthesis, and increases of Cho indicate membrane damage to myelin or neuron. Cho, PC, and GPC give rise to a prominent singlet resonance at 3.20 ppm. Ins is believed to be a glial marker and an increase of Ins reflects gliosis. This compound has a prominent doublet of doublet centered at 3.52 ppm and a triplet at 3.61 ppm.
Glu is the major excitatory neurotransmitter in the central nervous system (CNS). Closely coupled to Glu, Gln is mostly located in glial cells as the end product of Glu catabolism and is a reservoir for Glu production in the neuron. γ-aminobutyric acid (GABA) is the major inhibitory neurotransmitter in CNS. These neurotransmitters play important roles in many neurological and psychiatric disorders, such as epilepsy, depression, and drug addiction. However, reliable detection and accurate quantification of Glu, Gln, or GABA in vivo remains challenging using proton 1H MRS at low and middle magnetic field strengths (1.5–4.7 T), primarily due to spectral overlap of these compounds. Recently, new techniques such as echo time (TE)-averaged PRESS (Hurd et al., 2004) and STEAM with optimized timing parameters (Hu et al., 2007) have been developed to deal with this problem. An example of resolved Glu and Gln STEAM spectrum on the human brain with optimized TE and mixing time (TM) at 3 T is illustrated in Figure 15.7. Glu and Gln peaks at 2.35–2.45 ppm are well resolved and can be accurately quantified.
The three resonances of GABA at 1.89, 2.28, and 3.01 ppm are overlapped with the much stronger signals of NAA, Glu, and Cr, respectively. However, the resonance frequencies of GABA are affected by “J-coupling” while the overlapping singlet peaks of NAA and Cr are not. As such, editing spectroscopic techniques can separate the desired J-coupled compounds from the overlapping ones by manipulating their magnetizations (Mescher et al., 1998; Rothman et al., 1993). In the difference editing sequence, a selective 180° pulse is used to refocus the magnetization evolution due to J-coupling of the GABA-H4 spin (3.01 ppm). When editing pulses are turned ON/OFF in a two-step acquisition, the J-evolution of GABA-H4 is refocused/intact respectively, while the strong singlet resonance Cr at 3.03 ppm remains unchanged between the two scans. Difference of the two scans will eliminate the Cr resonance while preserving the GABA-H4 resonance at almost the same frequency. This spectral editing technique has been successfully implemented on 3T MR scanners recently and has shown promise in assessing patients with neuropsychiatric disorders (Hasler et al., 2007).
SPECTRAL QUANTIFICATION
The goal of spectral quantification is to estimate metabolite concentrations from spectroscopic data. Although the area underneath a spectrum is directly proportional to the number of nuclei within the sensitive volume of the coil, it is not straightforward to achieve this goal. A number of factors have to be taken into account in quantifying spectroscopic data (Kauppinen and Williams, 1994).
Spectroscopic signal intensity is related to relaxation times and equilibrium magnetization. Magnetization recovers during a repetition time (TR) with longitudinal relaxation time (T1) and decays during a TE with transverse relaxation time (T2). Effects of T1 and T2 can be minimized using long TR and short TE. In many circumstances, however, knowledge of the relaxation times is needed to correct for these effects.
Spectral peak intensities can be affected by data acquisition and processing strategies as well as the existence of macromolecules in the sensitive volume. For instance, in chemical shift imaging using phase encoding for spatial localization (Brown et al., 1982), the early data points in the free induction decay (FID) are not collected, resulting in baseline and line shape distortions in the spectrum. Appropriate processing techniques are needed to estimate the missing data points and thus to correct for spectral distortions. Macromolecules contribute to a broad baseline in a spectrum, which has to be removed in data acquisition or processing. Techniques to extract signal intensities, such as LCModel (Provencher, 1993) and jMRUI (Naressi et al., 2001), have been developed and widely used for spectral quantification.
Metabolite concentrations can be presented as ratios, for example, relative to Cr, which is thought to be relatively stable in normal brains. Recent studies demonstrated that absolute quantification of metabolites has added value for unambiguous data interpretation (Jansen et al., 2006). However, extra calibration steps are required to achieve absolute quantification. Several strategies have been developed for this purpose, including internal endogenous marker, external reference, replace-and-match method, water signal reference, and principle of reciprocity (Jansen et al., 2006). Although absolute quantification requires more time and expertise, it can improve the diagnosis utility of MR spectroscopy.
MEASUREMENT OF CEREBRAL METABOLIC RATE OF OXYGEN
Cerebral metabolic rate of oxygen (CMRO2) is a measure of energy consumption in the brain. Because aerobic metabolism is the primary form of energy production in the brain (Magistretti and Pellerin, 1999), CMRO2 is an important index of tissue viability and brain function. Disrupted oxygen metabolism is associated with a number of pathophysiologic conditions such as Alzheimer’s disease (Buckner et al., 2005; Ogawa et al., 1996), brain aging (Lu et al., 2011), multiple sclerosis (Ge et al., 2012; Sun et al., 1998), Parkinson’s disease (Borghammer et al., 2008), diabetes (Sieber et al., 1993; Uchino et al., 2010), traumatic brain injury (Glenn et al., 2003), and normal pressure hydrocephalus (Walter et al., 2005). Traditionally, brain oxygen metabolism can only be measured with positron emission tomography (PET). Unfortunately, the measurement is only available in a limited number of institutions where an on-site cyclotron is available and, furthermore, technical limitations such as long scan duration, high cost, and high risk have prevented oxygen metabolism measurement from becoming a routine procedure. Recent advances in MRI technologies have provided an opportunity to fill this gap. Over the past few years, a number of emerging techniques have been developed and extensively tested to a point that it is now feasible to measure human brain metabolism using completely noninvasive procedures on a standard 3-Tesla scanner.
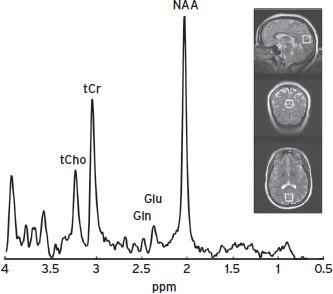
Figure 15.7 A STEAM spectrum with optimized TE/TM (72/6 ms) in the medial occipitoparietal junction of the human brain (voxel size = 20 × 20 × 20 mm3). Glu and Gln peaks are well resolved at 2.35–2.45 ppm.
CMRO2 can be measured by combining several noninvsive measures obtained from MRI and pulse oximetry (Xu et al., 2009). The theoretical basis of the method is the Fick principle (Kety and Schmidt, 1948):
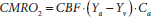
A graphical illustration of this relationship is shown in Figure 15.8a. In brief, arterial vessels deliver blood that has an oxygenation level of Ya, the flow rate of which is denoted by CBF. When the blood transits through capillary beds, a portion of the carried oxygen is extracted by brain tissue for its metabolism, the rate of which is denoted by CMRO2. The portion that remains in the blood will determine the venous oxygenation, Yv, and is drained through veins. Ca is the amount of oxygen molecules that a unit volume of blood can carry, assumed to be 897 µmol O2/100 ml blood based on physiology literature (Guyton and Hall, 2005). Therefore, once CBF, Ya, and Yv are experimentally measured, CMRO2 can be determined using the Fick principle.
In the preceding equation, Ya can be easily measured with noninvasive pulse oximetry on a fingertip. Note that arterial oxygenation is identical throughout the body; thus, measurement made at a finger can be used for brain calculation. A number of MR techniques are available for quantitative measurements of CBF. For global CBF, one can use a phase contrast MRI applied on the feeding arteries of the brain (Fig. 15.8b) (Aslan et al., 2010; Bonekamp et al., 2011; Lu et al., 2011; Xu et al., 2009). For region-specific CBF, a noninvasive technique, arterial-spin-labeling (ASL), can be used (Aslan et al., 2010; Dai et al., 2008; Detre and Alsop, 1999; Edelman et al., 1994; Golay et al., 1999; Kim, 1995; Kwong et al., 1995; Liu et al., 2011; Wong, 2007; Wu et al., 2007). The most challenging component is the measurement of Yv, which has seen a great deal of technical development over the past several years.
One of the MRI approaches to quantify global venous oxygenation is based on the relationship between blood T2 and oxygenation and was termed T2-relaxation-under-spin-tagging (TRUST) (Lu and Ge, 2008). The TRUST MRI technique applies the spin labeling principle on the venous side and acquires control and labeled images, the subtraction of which yields pure venous blood signal (Fig. 15.8c). T2 value of the pure venous blood is then determined using nonselective T2 preparation pulses, minimizing the effect of flow on T2 estimation (Lu and Ge, 2008; Lu et al., 2012). Despite the lack of spatial information, this approach has the advantage of being fast and reliable (Liu et al., 2012). Intrasession and intersession coefficient of variation (CoV) of this technique was 2.8% ± 1.3% and 5.9% ± 1.6%, respectively, suggesting a high reproducibility of this technique. This CMRO2 technique has so far been applied in studies of cognitive aging, Alzheimer’s disease (AD), cocaine addiction, and multiple sclerosis (MS) (Ge et al., 2012; Lu et al., 2011). Another promising T2-based MRI method, quantitative imaging of extraction of oxygen and tissue consumption (QUIXOTIC) (Bolar et al., 2011), aimed to measure regional oxygenation. This technique uses velocity-selective spin tagging to separate venular blood from arterial blood and static tissue (Bolar et al., 2011). In combination with ASL MRI technique, absolute CMRO2 map can, in principle, be generated.
Venous oxygenation can also be measured using susceptibility differences between oxygenated and deoxygenated blood. It has been shown that blood oxygenation in major blood vessels can alter the magnetic susceptibility difference between intravascular blood and surrounding brain parenchyma (Fernandez-Seara et al., 2006; Haacke et al., 1997). This concept has been extended to measure venous oxygenation in smaller vessels, which, in combination with regional CBF measured by ASL technique, yields regional CMRO2 values (Fan et al., 2012). The major limitation of the susceptibility-based approaches is that the veins being measured need be parallel to the main magnetic field. The angle between vessel geometry and main magnetic field will cause bias to the oxygenation measurements.
Alternatively, calibrated fMRI has been shown to provide quantitative measurement of CMRO2 as well. This approach is based on a generalized calibrated MRI signal model (Bulte et al., 2012; Gauthier et al., 2011). By having the subjects undergo two physiologic challenges of hypercapnia and hyperoxia breathing, two forms of the signal equations can be obtained. Solving the two equations will provide parameters that can further yield CMRO2 map (Gauthier and Hoge, 2012). A major limitation of the calibrated fMRI method is the complexity of experiment procedures, the subject burden to perform hypercapnia and hyperoxia breathing, and the large number of assumptions used in the model.
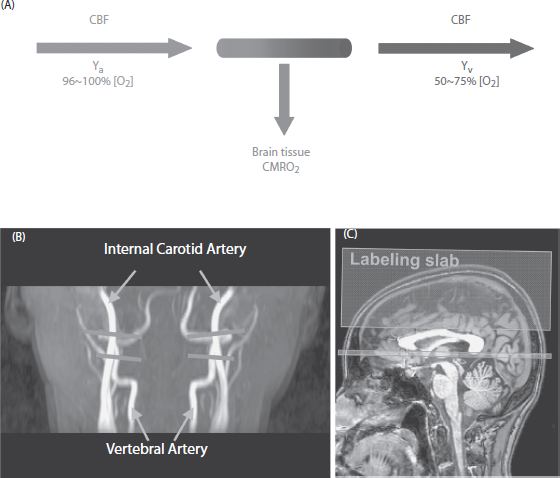
Figure 15.8 Illustration of cerebral metabolic rate of oxygen (CMRO2) measurement using MRI techniques. (A ) Relationship among physiologic parameters associated with oxygen demand and supply. (B) Slice locations of phase contrast MRI for the measurement of cerebral blood flow. Each of the imaging slices (gray horizontal) is placed at one of the four feeding arteries of the brain before they enter the skull. (C) Slice location of T2-relaxation-under-spin-tagging (TRUST) MRI for the measurement of venous oxygenation in superior sagittal sinus. Small rectangular slab—imaging slice. Large rectangular slab—labeling slab.
STRUCTURAL IMAGING USING MRI
With recent advances in high-field MR imaging technology and the development of parallel imaging acquisitions, structural MR images can be obtained with higher spatial resolutions and signal-to-noise ratio (SNR). Whole-brain images with a resolution of 1 × 1 × 1 mm3 are now routinely acquired with scan durations of 4 to 8 minutes. This renders to MRI the capability of evaluating regional volumetric changes for various tissue types, such as gray matter, white matter, and CSF; this is especially useful for studies of psychiatric disorders because the involved brain regions may be relatively diffused and changes can be subtle. The typical MR pulse sequence used is called magnetization-prepared rapid acquisitions of gradient-echo (MPRAGE) (Mugler and Brookeman, 1991), and the resulting images are T1 weighted, with clear contrast between gray and white matters. This technique is increasingly used to assess brain atrophy in longitudinal and cross-sectional studies. The MRI data can be analyzed using one of three different methods.
One method is to manually draw ROI on a slice-by-slice basis and to calculate the volume for each tissue type (Convit et al., 1997). The intersubject variability in head size can be corrected by dividing the ROI volume by the total intracranial volume. The advantage of such a method is that the procedure is relatively straightforward, and the results are less sensitive to SNR and image inhomogeneity. However, this approach is very time consuming, and the operators need to be well trained to produce consistent results. A less labor-intensive ROI approach is to use a semiautomatic procedure, in which a large ROI is selected based on simple landmarks; an algorithm is applied to segment the ROI into gray matter, white matter, and CSF; and the normalized tissue volume is used for atrophy comparison (Rusinek et al., 2003).
A second method is voxel-based morphometry (VBM). This processing strategy first uses spatial coregistration to normalize individual brains into the coordinates of a brain template (Ashburner and Friston, 2000; Rombouts et al., 2000; Wright et al., 1995), so that equivalent structures in different brains are roughly in the same location. Image segmentation is then performed to partition the normalized brain image into gray matter, white matter, and CSF. It is important to note that, after the segmentation, the signal intensity in the original image is replaced by a value between 0 and 1, indicating the probability that the voxel belongs to gray matter, white matter, or CSF. These values are not influenced by the actual signal intensity in the raw MPRAGE image. This conversion from MRI signal to brain mask value is crucial in VBM as the scaling factor of the raw MRI signal is arbitrary and may be different for different participants. Therefore, a comparison of the signals in the MPRAGE image across participants is not meaningful. The next key step in VBM processing is the smoothing of the mask images. It is this step that creates the contrast between a normal brain and an atrophic brain, which can be used for statistical comparison. The spatial smoothing, in effect, allows the signal in a single voxel to reflect the concentration of the tissue in its surrounding areas. Therefore, a voxel in a thick gray matter layer will have a larger value than a voxel in a thin layer after smoothing, even though their values before smoothing were identical (e.g., both 1). In addition, the smoothing also reduces the effect of regional brain shape differences, which cannot be compensated for in the normalization step. Following smoothing, statistical comparison is performed on a voxel-by-voxel basis to detect the regions that show significant changes in tissue concentration. The advantage of the VBM method is that the processing steps are highly automated, and one can assess the atrophy for the entire brain easily. One disadvantage is that this processing requires the anatomical data to be of high quality, in terms of resolution and SNR, and data acquired using different MRI scanners or different imaging parameters may yield drastically different results.
A third method for analyzing structural images is deformation-based morphometry (Freeborough and Fox, 1998; Shen and Davatzikos, 2002). In this method, the brain image is transformed into the coordinates of a template brain or a baseline brain image. Then the information in the transformation matrix is used to determine whether the position of a particular brain structure is shifted or the shape has changed. Certain indices are often obtained from the transformation matrix (e.g., the Jacobian determinant), and they can be used for statistical analysis. The advantage of the deformation-based approach is that it does not use spatial smoothing to generate the volumetric information. On the other hand, the performance of this method would require the algorithm to be able to detect deformations at a very small scale.
AMYLOID IMAGING WITH POSITRON EMISSION TOMOGRAPHY
During the past decade, the neuroimaging community has seen the successful development of a few radiotracers for imaging of beta-amyloid (Aβ) (Jureus et al., 2010; Klunk et al., 2004; Koole et al., 2009; Zhang et al., 2005, 2007; ), a hallmark protein in Alzheimer’s disease (Hardy and Selkoe, 2002).
While a relatively large number of tracers have been reported to be capable of amyloid-specific imaging, two of them have made particularly large impact and are the foci of the discussion in this section.
Pittsburgh compound-B (PIB) is the most successful carbon-11-based radiotracer (Klunk et al., 2004). It is a benzothiazole agent that has high affinity to bind Aβ, and the tracer signal can be detected by PET scanners (Mathis et al., 2003). The PIB compound has been extensively tested in multisite studies (Klunk and Mathis, 2008). Validation studies comparing in vivo PIB imaging signal to postmortem tissue Aβ have also been reported, which showed strong correlations (Bacskai et al., 2007; Ikonomovic et al., 2008). Amyloid imaging using PIB has shown utility in many research areas such as Alzheimer’s disease, mild cognitive impairment (Forsberg et al., 2008; Jack et al., 2008; Kemppainen et al., 2007; Pike et al., 2007), cerebral amyloid angiopathy (Johnson et al., 2007), cognitive aging (Aizenstein et al., 2008; Edison et al., 2007; Fotenos et al., 2008; Kemppainen et al., 2008; Mintun et al., 2006; Nelissen et al., 2007; Rodrigue et al., 2012), and Parkinson’s disease (Johansson et al., 2008). Due to the large number of participants on whom PIB has been used and the extensive experience the field has gained on this tracer, it is now becoming a reference tracer that newly developed tracer is compared with (Klunk and Mathis, 2008). A limitation of PIB is that it is based on carbon-11 radioisotope, and the half-life of this agent is relatively short (~20 minutes). Therefore, in practice terms, the tracer would have to be generated on-site and be administered to the patient almost immediately. The equipment that is used to generate the carbon-11 radioisotope is called a cyclotron, and only less than 10% of the PET facilities in the United States have an on-site cyclotron. This requirement of PIB limits the use of this agent to the few medical centers and research institutions. Therefore, the impact of this agent so far has been mainly limited to the research realm.
The other tracer discussed in this section, Florbetapir, does not have this limitation. Florbetapir is based on fluorine-18 radioisotope, which has a half-life of about 110 minutes (Zhang et al., 2007). With this long half-life, it is feasible and practical for the agent to be synthesized at a centralized facility and then be shipped to various clinical and research PET facilities. This is a huge advantage in terms of practicality and scope of impact. On April 10, 2012, Florbetapir was approved by the U.S. Food and Drug Administration for use on adults who are being evaluated for Alzheimer’s disease and other causes of cognitive decline. Therefore, the impact of amyloid imaging has evolved from research tools to clinical practice.
At present, the high costs associated with amyloid imaging remain to be the main obstacle to many researchers. It is estimated that the costs to obtain the amyloid imaging data are several times greater than that to collect the MRI data.
SUMMARY
It is clear that neuroimaging technologies will continue to contribute to our understanding of mental disorders and may emerge as a diagnostic tool and eventually be used for monitoring treatments. Many imaging biomarkers have already been proposed for the evaluation of diseases and to guide therapeutic procedures. Among neuroimaging modalities, MRI is a versatile technique in that it provides a variety of tools for in vivo assessment of human brain, ranging from anatomical structure and neuronal functions to cerebral perfusion. Meanwhile, it is necessary to be cautious in interpreting and understanding MR data. Although MR images are often shown in high resolution and sometimes labeled in colors, investigators should always try to gain a full understanding of the results and be informed about potential uncertainties in the measurements and confounding factors in the quantification. PET imaging has the advantages of high specificity and sensitivity. With the development of new tracers, this imaging modality also has greater potentials in better understanding the neurobiology of mental illness.
DISCLOSURES
Dr. Lu has no conflicts of interest to disclose. He is funded by NIH R01 MH084021, NIH R01 NS067015, NIH R01 AG042753, R21 AG034318, and NIH R21 NS078656.
Dr. Yang has no conflicts of interest to disclose.
Dr. Liu has no conflicts of interest to disclose.
REFERENCES
Ackerman, J.J., Grove, T.H., et al. (1980). Mapping of metabolites in whole animals by 31P NMR using surface coils. Nature 283:167–170.
Aizenstein, H.J., Nebes, R.D., et al. (2008). Frequent amyloid deposition without significant cognitive impairment among the elderly. Arch. Neurol. 65:1509–1517.
Alsop, D.C., Detre, J.A., et al. (2000). Assessment of cerebral blood flow in Alzheimer’s disease by spin-labeled magnetic resonance imaging. Ann. Neurol. 47:93–100.
Anand, A., Li, Y., et al. (2005). Antidepressant effect on connectivity of the mood-regulating circuit: an FMRI study. Neuropsychopharmacol. 30:1334–1344.
Ashburner, J., and Friston, K.J. (2000). Voxel-based morphometry—the methods. NeuroImage 11:805–821.
Aslan, S., Xu, F., et al. (2010). Estimation of labeling efficiency in pseudocontinuous arterial spin labeling. Magn. Reson. Med. 63:765–771.
Bacskai, B.J., Frosch, M.P., et al. (2007). Molecular imaging with Pittsburgh Compound B confirmed at autopsy: a case report. Arch. Neurol. 64:431–434.
Basser, P.J., Mattiello, J., et al. (1994). MR diffusion tensor spectroscopy and imaging. Biophys. J. 66:259–267.
Basser, P.J., Pajevic, S., et al. (2000). In vivo fiber tractography using DT-MRI data. Magn. Reson. Med. 44:625–632.
Basser, P.J., and Pierpaoli, C. (1996). Microstructural and physiological features of tissues elucidated by quantitative-diffusion-tensor MRI. J. Magn. Reson. B 111:209–219.
Beckmann, C.F., DeLuca, M., et al. (2005). Investigations into resting-state connectivity using independent component analysis. Philos. Trans. R. Soc. Lond. B Biol. Sci. 360:1001–1013.
Biswal, B., Yetkin, F.Z., et al. (1995). Functional connectivity in the motor cortex of resting human brain using echo-planar MRI. Magn. Reson. Med. 34:537–541.
Bolar, D.S., Rosen, B.R., et al. (2011). QUantitative Imaging of eXtraction of oxygen and TIssue consumption (QUIXOTIC). using venular-targeted velocity-selective spin labeling. Magn. Reson. Med. 66:1550–1562.
Bonekamp, D., Degaonkar, M., et al. (2011). Quantitative cerebral blood flow in dynamic susceptibility contrast MRI using total cerebral flow from phase contrast magnetic resonance angiography. Magn. Reson. Med. 66:57–66.
Borghammer, P., Vafaee, M., et al. (2008). Effect of memantine on CBF and CMRO2 in patients with early Parkinson’s disease. Acta Neurol. Scand. 117:317–323.
Bottomley, P.A. (1984). Selective volume method for performing localized NMR spectroscopy. U.S. Patent No.: 4,480,228. Washington, DC: U.S. Patent and Trademark Office.
Brown, T.R., Kincaid, B.M., et al. (1982). NMR chemical shift imaging in three dimensions. Proc. Natl. Acad. Sci. USA 79:3523–3526.
Buckner, R.L., Sepulcre, J., et al. (2009). Cortical hubs revealed by intrinsic functional connectivity: mapping, assessment of stability, and relation to Alzheimer’s disease. J. Neurosci. 29:1860–1873.
Buckner, R.L., Snyder, A.Z., et al. (2005). Molecular, structural, and functional characterization of Alzheimer’s disease: evidence for a relationship between default activity, amyloid, and memory. J. Neurosci. 25:7709–7717.
Bullmore, E., and Sporns, O. (2009). Complex brain networks: graph theoretical analysis of structural and functional systems. Nat. Rev. Neurosci. 10:186–198.
Bulte, D.P., Kelly, M., et al. (2012). Quantitative measurement of cerebral physiology using respiratory-calibrated MRI. NeuroImage 60:582–591.
Buxton, R.B., Frank, L.R., et al. (1998). A general kinetic model for quantitative perfusion imaging with arterial spin labeling. Magn. Reson. Med. 40:383–396.
Calamante, F., Morup, M., et al. (2004). Defining a local arterial input function for perfusion MRI using independent component analysis. Magn. Reson. Med. 52:789–797.
Calamante, F., Williams, S.R., et al. (1996). A model for quantification of perfusion in pulsed labelling techniques. NMR Biomed. 9:79–83.
Carr, H.Y., and Purcell, E.M. (1954). Effects of diffusion on free precession in nuclear magnetic resonance experiments. Phys. Rev. 94:630–638.
Cha, S., Tihan, T., et al. (2005). Differentiation of low-grade oligodendrogliomas from low-grade astrocytomas by using quantitative blood-volume measurements derived from dynamic susceptibility contrast-enhanced MR imaging. AJNR Am. J. Neuroradiol. 26:266–273.
Chance, B., Nakase, Y., et al. (1978). Detection of 31P nuclear magnetic resonance signals in brain by in vivo and freeze-trapped assays. Proc. Natl. Acad. Sci. USA 75:4925–4929.
Convit, A., De Leon, M.J., et al. (1997). Specific hippocampal volume reductions in individuals at risk for Alzheimer’s disease. Neurobiol. Aging 18:131–138.
Cordes, D., Haughton, V.M., et al. (2000). Mapping functionally related regions of brain with functional connectivity MR imaging. AJNR Am. J. Neuroradiol. 21:1636–1644.
Dai, W., Garcia, D., et al. (2008). Continuous flow-driven inversion for arterial spin labeling using pulsed radio frequency and gradient fields. Magn. Reson. Med. 60:1488–1497.
de Crespigny, A., Rother, J., et al. (1998). Magnetic resonance imaging assessment of cerebral hemodynamics during spreading depression in rats. J. Cereb. Blood Flow Metab. 18:1008–1017.
de Graaf, R.A. (1998). In Vivo NMR Spectroscopy. New York: Wiley.
Detre, J.A., and Alsop, D.C. (1999). Perfusion magnetic resonance imaging with continuous arterial spin labeling: methods and clinical applications in the central nervous system. Eur. J. Radiol. 30:115–124.
Detre, J.A., Leigh, J.S., et al. (1992). Perfusion imaging. Magn. Reson. Med. 23:37–45.
Edelman, R.R., Siewert, B., et al. (1994). Qualitative mapping of cerebral blood flow and functional localization with echo-planar MR imaging and signal targeting with alternating radio frequency. Radiology 192:513–520.
Edison, P., Archer, H.A., et al. (2007). Amyloid, hypometabolism, and cognition in Alzheimer disease: an [11C]PIB and [18F]FDG PET study. Neurology 68:501–508.
Einstein, A. (1926). Investigations on the Theory of Brownian Motion. New York: Dover.
Fan, A.P., Benner, T., et al. (2012). Phase-based regional oxygen metabolism (PROM). using MRI. Magn. Reson. Med. 67:669–678.
Fan, Y., Shi, F., et al. (2011). Brain anatomical networks in early human brain development. NeuroImage 54:1862–1871.
Fernandez-Seara, M.A., Techawiboonwong, A., et al. (2006). MR susceptometry for measuring global brain oxygen extraction. Magn. Reson. Med. 55:967–973.
Forsberg, A., Engler, H., et al. (2008). PET imaging of amyloid deposition in patients with mild cognitive impairment. Neurobiol. Aging 29:1456–1465.
Fotenos, A.F., Mintun, M.A., et al. (2008). Brain volume decline in aging: evidence for a relation between socioeconomic status, preclinical Alzheimer disease, and reserve. Arch. Neurol. 65:113–120.
Fox, M.D., Snyder, A.Z., et al. (2005). The human brain is intrinsically organized into dynamic, anticorrelated functional networks. Proc. Natl. Acad. Sci. USA 102:9673–9678.
Frahm, J., Merboldt, K.D., et al. (1987). Localized proton spectroscopy using stimulated echoes. J. Magn. Reson. 72:502–508.
Frank, L.R. (2001). Anisotropy in high angular resolution diffusion-weighted MRI. Magn. Reson. Med. 45:935–939.
Freeborough, P.A., and Fox, N.C. (1998). Modeling brain deformations in Alzheimer disease by fluid registration of serial 3D MR images. J. Comput. Assist. Tomogr. 22:838–843.
Gauthier, C.J., and Hoge, R.D. (2012). Magnetic resonance imaging of resting OEF and CMRO(2). using a generalized calibration model for hypercapnia and hyperoxia. NeuroImage 60:1212–1225.
Gauthier, C.J., Madjar, C., et al. (2011). Elimination of visually evoked BOLD responses during carbogen inhalation: implications for calibrated MRI. NeuroImage 54:1001–1011.
Ge, Y., Zhang, Z., et al. (2012). Characterizing brain oxygen metabolism in patients with multiple sclerosis with T2-relaxation-under-spin-tagging MRI. J. Cereb. Blood Flow Metab. 32:403–412.
Glenn, T.C., Kelly, D.F., et al. (2003). Energy dysfunction as a predictor of outcome after moderate or severe head injury: indices of oxygen, glucose, and lactate metabolism. J. Cereb. Blood Flow Metab. 23:1239–1250.
Golay, X., Stuber, M., et al. (1999). Transfer insensitive labeling technique (TILT): application to multislice functional perfusion imaging. J. Magn. Reson. Imaging 9:454–461.
Golub, G.H., and Van Loan, C.F. (1996). Matrix Computations. Baltimore: Johns Hopkins University Press.
Govindaraju, V., Young, K., et al. (2000). Proton NMR chemical shifts and coupling constants for brain metabolites. NMR Biomed. 13:129–153.
Greicius, M.D., Krasnow, B., et al. (2003). Functional connectivity in the resting brain: a network analysis of the default mode hypothesis. Proc. Natl. Acad. Sci. USA 100:253–258.
Gusnard, D.A., Raichle, M.E., et al. (2001). Searching for a baseline: functional imaging and the resting human brain. Nat. Rev. Neurosci. 2:685–694.
Guyton, A.C., and Hall, J.E. (2005). Respiration. In: Guyton, A.C., Hall, J.E., eds. Textbook of Medical Physiology. Philadelphia: Saunders/Elsevier, p. 506.
Haacke, E.M., Lai, S., et al. (1997). In vivo measurement of blood oxygen saturation using magnetic resonance imaging: a direct validation of the blood oxygen level-dependent concept in functional brain imaging. Hum. Brain Mapp. 5:341–346.
Hahn, E.L. (1950). Spin echo. Phys. Rev. 80:580–594.
Hardy, J., and Selkoe, D.J. (2002). The amyloid hypothesis of Alzheimer’s disease: progress and problems on the road to therapeutics. Science 297:353–356.
Harris, G.J., Lewis, R.F., et al. (1996). Dynamic susceptibility contrast MRI of regional cerebral blood volume in Alzheimer’s disease. Am. J. Psychiatry 153:721–724.
Hasler, G., van der Veen, J.W., et al. (2007). Reduced prefrontal glutamate/glutamine and gamma-aminobutyric acid levels in major depression determined using proton magnetic resonance spectroscopy. Arch. Gen. Psychiatry 64:193–200.
He, B.J., Snyder, A.Z., et al. (2008). Electrophysiological correlates of the brain’s intrinsic large-scale functional architecture. Proc. Natl. Acad. Sci. USA 105:16039–16044.
Hendrikse, J., Lu, H., et al. (2003). Measurements of cerebral perfusion and arterial hemodynamics during visual stimulation using TURBO-TILT. Magn. Reson. Med. 50:429–433.
Hu, J., Yang, S., et al. (2007). Simultaneous detection of resolved glutamate, glutamine, and gamma-aminobutyric acid at 4 T. J. Magn. Reson. 185:204–213.
Hurd, R., Sailasuta, N., et al. (2004). Measurement of brain glutamate using TE-averaged PRESS at 3T. Magn. Reson. Med. 51:435–440.
Iadecola, C. (2004). Neurovascular regulation in the normal brain and in Alzheimer’s disease. Nat. Rev. Neurosci. 5:347–360.
Ikonomovic, M.D., Klunk, W.E., et al. (2008). Post-mortem correlates of in vivo PiB-PET amyloid imaging in a typical case of Alzheimer’s disease. Brain 131:1630–1645.
Jack, C.R., Jr., Lowe, V.J., et al. (2008). 11C PiB and structural MRI provide complementary information in imaging of Alzheimer’s disease and amnestic mild cognitive impairment. Brain 131:665–680.
Jansen, J.F., Backes, W.H., et al. (2006). 1H MR spectroscopy of the brain: absolute quantification of metabolites. Radiology 240:318–332.
Jensen, J.H., Helpern, J.A., et al. (2005). Diffusional kurtosis imaging: the quantification of non-gaussian water diffusion by means of magnetic resonance imaging. Magn. Reson. Med. 53:1432–1440.
Johansson, A., Savitcheva, I., et al. (2008). [(11)C]-PIB imaging in patients with Parkinson’s disease: preliminary results. Parkinsonism Relat. Disord. 14:345–347.
Johnson, K.A., Gregas, M., et al. (2007). Imaging of amyloid burden and distribution in cerebral amyloid angiopathy. Ann. Neurol. 62:229–234.
Jureus, A., Swahn, B.M., et al. (2010). Characterization of AZD4694, a novel fluorinated Abeta plaque neuroimaging PET radioligand. J. Neurochem. 114:784–794.
Kauppinen, R.A., and Williams, S.R. (1994). Nuclear magnetic resonance spectroscopy studies of the brain. Prog. Neurobiol. 44:87–118.
Kemppainen, N.M., Aalto, S., et al. (2007). PET amyloid ligand [11C]PIB uptake is increased in mild cognitive impairment. Neurology 68:1603–1606.
Kemppainen, N.M., Aalto, S., et al. (2008). Cognitive reserve hypothesis: Pittsburgh Compound B and fluorodeoxyglucose positron emission tomography in relation to education in mild Alzheimer’s disease. Ann. Neurol. 63:112–118.
Kety, S.S., and Schmidt, C.F. (1948). The effects of altered arterial tensions of carbon dioxide and oxygen on cerebral blood flow and cerebral oxygen consumption of normal young men. J. Clin. Invest. 27:484–492.
Kim, S.G. (1995). Quantification of relative cerebral blood flow change by flow-sensitive alternating inversion recovery (FAIR) technique: application to functional mapping. Magn. Reson. Med. 34:293–301.
Klunk, W.E., Engler, H., et al. (2004). Imaging brain amyloid in Alzheimer’s disease with Pittsburgh Compound-B. Ann. Neurol. 55:306–319.
Klunk, W.E., and Mathis, C.A. (2008). The future of amyloid-beta imaging: a tale of radionuclides and tracer proliferation. Curr. Opin. Neurol. 21:683–687.
Koole, M., Lewis, D.M., et al. (2009). Whole-body biodistribution and radiation dosimetry of 18F-GE067: a radioligand for in vivo brain amyloid imaging. J. Nucl. Med. 50:818–822.
Kuppusamy, K., Lin, W., et al. (1996). In vivo regional cerebral blood volume: quantitative assessment with 3D T1-weighted pre- and postcontrast MR imaging. Radiology 201:106–112.
Kuschinsky, W. (1996). Regulation of cerebral blood flow: an overview. In: Mraovitch, S., Sercombe, R., eds. Neurophysiological Basis of Cerebral Blood Flow Control: An Introduction. London: Johns Libbey, pp. 245–262.
Kwong, K.K., Belliveau, J.W., et al. (1992). Dynamic magnetic resonance imaging of human brain activity during primary sensory stimulation. Proc. Natl. Acad. Sci. USA 89:5675–5679.
Kwong, K.K., Chesler, D.A., et al. (1995). MR perfusion studies with T1-weighted echo planar imaging. Magn. Reson. Med. 34:878–887.
Lauterbur, P.C., Kramer, C.D., et al. (1975). Zeugmatographic high resolution nuclear magnetic resonance spectroscopy imaging of chemical inhomogeneity within macroscopic object. J. Am. Chem. Soc. 97:6866–6868.
Law, M., Yang, S., et al. (2004). Comparison of cerebral blood volume and vascular permeability from dynamic susceptibility contrast-enhanced perfusion MR imaging with glioma grade. AJNR Am. J. Neuroradiol. 25:746–755.
Le Bihan, D., Breton, E., et al. (1986). MR imaging of intravoxel incoherent motions: application to diffusion and perfusion in neurologic disorders. Radiology 161:401–407.
Le Bihan, D., Mangin, J.F., et al. (2001). Diffusion tensor imaging: concepts and applications. J. Magn. Reson. Imaging 13:534–546.
Li, S.J., Biswal, B., et al. (2000). Cocaine administration decreases functional connectivity in human primary visual and motor cortex as detected by functional MRI. Magn. Reson. Med. 43:45–51.
Li, S.J., Li, Z., et al. (2002). Alzheimer disease: evaluation of a functional MR imaging index as a marker. Radiology 225:253–259.
Liang, M., Zhou, Y., et al. (2006). Widespread functional disconnectivity in schizophrenia with resting-state functional magnetic resonance imaging. NeuroReport 17:209–213.
Liu, P., Uh, J., et al. (2011). Determination of spin compartment in arterial spin labeling MRI. Magn. Reson. Med. 65:120–127.
Liu, P., Xu, F., et al. (2012). Test-retest reproducibility of a rapid method to measure brain oxygen metabolism. Magn. Reson. Med.
Loeber, R.T., Sherwood, A.R., et al. (1999). Differences in cerebellar blood volume in schizophrenia and bipolar disorder. Schizophr. Res. 37:81–89.
Lowe, M.J., Mock, B.J., et al. (1998). Functional connectivity in single and multislice echoplanar imaging using resting-state fluctuations. NeuroImage 7:119–132.
Lu, H., and Ge, Y. (2008). Quantitative evaluation of oxygenation in venous vessels using T2-Relaxation-Under-Spin-Tagging MRI. Magn. Reson. Med. 60:357–363.
Lu, H., Law, M., et al. (2005). Novel approach to the measurement of absolute cerebral blood volume using vascular-space-occupancy magnetic resonance imaging. Magn. Reson. Med. 54:1403–1411.
Lu, H., Xu, F., et al. (2012). Calibration and validation of TRUST MRI for the estimation of cerebral blood oxygenation. Magn. Reson. Med. 67:42–49.
Lu, H., Xu, F., et al. (2011). Alterations in cerebral metabolic rate and blood supply across the adult lifespan. Cereb. Cortex 21:1426–1434.
Lu, H., Zuo, Y., et al. (2007). Synchronized delta oscillations correlate with the resting-state functional MRI signal. Proc. Natl. Acad. Sci. USA 104:18265–18269.
Magistretti, P.J., and Pellerin, L. (1999). Cellular mechanisms of brain energy metabolism and their relevance to functional brain imaging. Philos. Trans. R. Soc. Lond. B Biol. Sci. 354:1155–1163.
Mathis, C.A., Wang, Y., et al. (2003). Synthesis and evaluation of 11C-labeled 6-substituted 2-arylbenzothiazoles as amyloid imaging agents. J. Med. Chem. 46:2740–2754.
Mescher, M., Merkle, H., et al. (1998). Simultaneous in vivo spectral editing and water suppression. NMR Biomed. 11:266–272.
Meunier, D., Lambiotte, R., et al. (2010). Modular and hierarchically modular organization of brain networks. Front. Neurosci. 4:200.
Mintun, M.A., Larossa, G.N., et al. (2006). [11C]PIB in a nondemented population: potential antecedent marker of Alzheimer disease. Neurology 67:446–452.
Moseley, M.E., Chew, W.M., et al. (1992). Hypercarbia-induced changes in cerebral blood volume in the cat: a 1H MRI and intravascular contrast agent study. Magn. Reson. Med. 23:21–30.
Mugler, J.P., III, and Brookeman, J.R. (1991). Rapid three-dimensional T1-weighted MR imaging with the MP-RAGE sequence. J. Magn. Reson. Imaging 1: 561–567.
Naressi, A., Couturier, C., et al. (2001). Java-based graphical user interface for the MRUI quantitation package. Magma 12:141–152.
Nelissen, N., Vandenbulcke, M., et al. (2007). Abeta amyloid deposition in the language system and how the brain responds. Brain 130:2055–2069.
Ogawa, M., Fukuyama, H., et al. (1996). Altered energy metabolism in Alzheimer’s disease. J. Neurol. Sci. 139:78–82.
Ogawa, S., Menon, R.S., et al. (1993). Functional brain mapping by blood oxygenation level-dependent contrast magnetic resonance imaging. A comparison of signal characteristics with a biophysical model. Biophys. J. 64:803–812.
Ogawa, S., Tank, D.W., et al. (1992). Intrinsic signal changes accompanying sensory stimulation: functional brain mapping with magnetic resonance imaging. Proc. Natl. Acad. Sci. USA 89:5951–5955.
Ostergaard, L., Sorensen, A.G., et al. (1996a). High resolution measurement of cerebral blood flow using intravascular tracer bolus passages. Part II: Experimental comparison and preliminary results. Magn. Reson. Med. 36:726–736.
Ostergaard, L., Weisskoff, R.M., et al. (1996b). High resolution measurement of cerebral blood flow using intravascular tracer bolus passages. Part I: Mathematical approach and statistical analysis. Magn. Reson. Med. 36:715–725.
Pike, K.E., Savage, G., et al. (2007). Beta-amyloid imaging and memory in non-demented individuals: evidence for preclinical Alzheimer’s disease. Brain 130:2837–2844.
Provencher, S.W. (1993). Estimation of metabolite concentrations from localized in vivo proton NMR spectra. Magn. Reson. Med. 30:672–679.
Raichle, M.E., MacLeod, A.M., et al. (2001). A default mode of brain function. Proc. Natl. Acad. Sci. USA 98:676–682.
Rausch, M., Scheffler, K., et al. (2000). Analysis of input functions from different arterial branches with gamma variate functions and cluster analysis for quantitative blood volume measurements. Magn. Reson. Imaging 18:1235–1243.
Rodrigue, K.M., Kennedy, K.M., et al. (2012). Beta-amyloid burden in healthy aging: regional distribution and cognitive consequences. Neurology 78:387–395.
Rombouts, S.A., Barkhof, F., et al. (2000). Unbiased whole-brain analysis of gray matter loss in Alzheimer’s disease. Neurosci. Lett. 285:231–233.
Rosen, B.R., Belliveau, J.W., et al. (1990). Perfusion imaging with NMR contrast agents. Magn. Reson. Med. 14:249–265.
Rothman, D.L., Petroff, O.A., et al. (1993). Localized 1H NMR measurements of gamma-aminobutyric acid in human brain in vivo. Proc. Natl. Acad. Sci. USA 90:5662–5666.
Roy, C.S., and Sherrington, C.S. (1890). On the regulation of the blood-supply of the brain. J. Physiol. 11:85–108.
Rusinek, H., De Santi, S., et al. (2003). Regional brain atrophy rate predicts future cognitive decline: 6-year longitudinal MR imaging study of normal aging. Radiology 229:691–696.
Schwarzbauer, C., Syha, J., et al. (1993). Quantification of regional blood volumes by rapid T1 mapping. Magn. Reson. Med. 29:709–712.
Shen, D., and Davatzikos, C. (2002). HAMMER: hierarchical attribute matching mechanism for elastic registration. IEEE Trans. Med. Imaging 21: 1421–1439.
Shulman, R.G., Rothman, D.L., et al. (2004). Energetic basis of brain activity: implications for neuroimaging. Trends Neurosci. 27:489–495.
Sibson, N.R., Dhankhar, A., et al. (1998). Stoichiometric coupling of brain glucose metabolism and glutamatergic neuronal activity. Proc. Natl. Acad. Sci. USA 95:316–321.
Sieber, F.E., Brown, P.R., et al. (1993). Cerebral blood flow and metabolism in dogs with chronic diabetes. Anesthesiology 79:1013–1021.
Sporns, O., Tononi, G., et al. (2005). The human connectome: a structural description of the human brain. PLoS Comput. Biol. 1: e42.
Stejskal, E.O., and Tanner, J.E. (1965). Spin diffusion measurement: spin echoes in the presence of a time-dependent field gradient. J. Chem. Phys. 42:288–292.
Sun, X., Tanaka, M., et al. (1998). Clinical significance of reduced cerebral metabolism in multiple sclerosis: a combined PET and MRI study. Ann. Nucl. Med. 12:89–94.
Tuch, D.S., Reese, T.G., et al. (2003). Diffusion MRI of complex neural architecture. Neuron 40:885–895.
Uchino, K., Lin, R., et al. (2010). Increased cerebral oxygen metabolism and ischemic stress in subjects with metabolic syndrome-associated risk factors: preliminary observations. Transl. Stroke Res. 1:178–183.
van Osch, M.J., Vonken, E.J., et al. (2003). Measuring the arterial input function with gradient echo sequences. Magn. Reson. Med. 49:1067–1076.
Waites, A.B., Briellmann, R.S., et al. (2006). Functional connectivity networks are disrupted in left temporal lobe epilepsy. Ann. Neurol. 59:335–343.
Walter, C., Hertel, F., et al. (2005). Alteration of cerebral perfusion in patients with idiopathic normal pressure hydrocephalus measured by 3D perfusion weighted magnetic resonance imaging. J. Neurol. 252:1465–1471.
Watts, D.J., and Strogatz, S.H. (1998). Collective dynamics of ‘small-world’ networks. Nature 393:440–442.
Wong, E.C. (2007). Vessel-encoded arterial spin-labeling using pseudocontinuous tagging. Magn. Reson. Med. 58:1086–1091.
Wright, I.C., McGuire, P.K., et al. (1995). A voxel-based method for the statistical analysis of gray and white matter density applied to schizophrenia. NeuroImage 2:244–252.
Wu, K., Taki, Y., et al. (2012). Age-related changes in topological organization of structural brain networks in healthy individuals. Hum. Brain Mapp. 33:552–568.
Wu, W.C., Fernandez-Seara, M., et al. (2007). A theoretical and experimental investigation of the tagging efficiency of pseudocontinuous arterial spin labeling. Magn. Reson. Med. 58:1020–1027.
Xiong, J., Parsons, L.M., et al. (1999). Interregional connectivity to primary motor cortex revealed using MRI resting state images. Hum. Brain Mapp. 8:151–156.
Xu, F., Ge, Y., et al. (2009). Noninvasive quantification of whole-brain cerebral metabolic rate of oxygen (CMRO2). by MRI. Magn. Reson. Med. 62:141–148.
Xue, R., van Zijl, P.C., et al. (1999). In vivo three-dimensional reconstruction of rat brain axonal projections by diffusion tensor imaging. Magn. Reson. Med. 42:1123–1127.
Yang, Y., Engelien, W., et al. (2000). Transit time, trailing time, and cerebral blood flow during brain activation: measurement using multislice, pulsed spin-labeling perfusion imaging. Magn. Reson. Med. 44:680–685.
Yao, Z., Zhang, Y., et al. (2010). Abnormal cortical networks in mild cognitive impairment and Alzheimer’s disease. PLoS Comput. Biol. 6: e1001006.
Zhan, W., Stein, E.A., et al. (2004). Mapping the orientation of intravoxel crossing fibers based on the phase information of diffusion circular spectrum. NeuroImage 23:1358–1369.
Zhang, W., Kung, M.P., et al. (2007). 18F-labeled styrylpyridines as PET agents for amyloid plaque imaging. Nucl. Med. Biol. 34:89–97.
Zhang, W., Oya, S., et al. (2005). F-18 stilbenes as PET imaging agents for detecting beta-amyloid plaques in the brain. J. Med. Chem. 48:5980–5988.