5
Assessing Form
Six key elements of form assessment represent the biggest influencers of performance, running economy, and risk of injury. Therefore, these six should be measured carefully via video analysis:
- Determination of how far ahead of the body the leg moves during the swing phase of gait and thus calculation of maximum shank angle (MSA)
- Measurement of reversal of swing (ROS), or how far back the shank and foot move from MSA before hitting the ground
- Determination of the ROS-to-MSA ratio (ROS/MSA)
- Measurement of the shank angle at initial impact with the ground (SAT, or shank angle at touchdown)
- Determination of the foot angle at touchdown (FAT)
- Confirmation of posture
A smartphone with video capabilities or a video camera are necessary to carry out the video analysis. The brand of the device does not matter, but the video instrument must be capable of recording at a rate of no less than 240 fps (frames per second).
Bear in mind that it is critical to determine MSA, ROS, SAT, and FAT with great precision. If you cannot determine exactly when a runner’s foot strikes the ground, for example, you will not be able to assess SAT and FAT accurately.
Take the case of a runner moving along with a cadence of 180 steps per minute (three steps per second). As she runs, the goal is to “see” the exact moment when each foot makes contact with the ground—the precise instant when the stance phase of gait begins and SAT and FAT can be measured. Imagine what might happen if the video device were taking images at only 30 frames per second: That would mean an image would be captured every 1000/30 = 33.33 milliseconds.
That may seem like plenty of footage. But when a video device captures only 30 frames per second, it will be impossible to tell if the first frame showing the foot touching the ground represents initial impact, or if it shows the foot after it has been on the ground for a number of milliseconds. In the intervening milliseconds after the true initial impact, the runner’s body may have moved significantly ahead over the foot, and thus the shank angle might have changed significantly. In other words, the measured SAT would be wrong.
Now, imagine this same scenario with a video device recording at 240 Hz. Instead of 33 milliseconds between images, there are now 1000/240 = approximately 4 milliseconds between images. On average, when estimating SAT, the video analysis will be off by about two milliseconds per frame, compared with about 16 milliseconds per frame for a 30 Hz recording. The degree of accuracy at 240 fps is simply much greater.
Taking Video Footage
To carry out the form assessment, try to find a location where the runner being analyzed can run freely on flat ground for 60 meters or so. In a trial run, position yourself at the midway point, far enough away from the runner so that you can capture the runner’s entire body as he runs by you. The runner will be moving from left to right (or right to left), so that you are taking a lateral view as he runs. Make certain that you are in a position so that you can capture two steps (right and left) as he moves by. Verify this by having him run past and then checking out the video you have taken. The maximum observed number of steps should be three. If you are getting four steps, you are standing too far away from the runner.
Have the runner begin at one end of the 60-meter running surface and run past you in a very natural way. Emphasize to the runner that he should relax and run with his normal pattern of movement. After the runner has warmed up thoroughly, have him run past you at a very easy pace. Take video as he moves past, from right to left or left to right. Again, verify that the video has been recorded properly and that you have captured at least two steps. Save the video for follow-up analysis.
Repeat this process two more times: once at a moderate pace (around marathon tempo if possible or at least a little slower than a 10K-race speed), and then again at a fast velocity (5K pace or faster for a distance runner and 1500-meter speed or quicker for a middle-distance competitor). Review the three videos and make sure that they have been recorded properly, with two or three observed ground contacts per video.
Check the quality of the images, specifically the sharpness of the views of the feet making impact with the ground. If the feet seem rather small in the video or are not in focus, retake the three videos while standing closer to the runner as he passes.
You are now ready to begin the analysis.
Analyzing the Video
You can learn a lot by simply watching the videos you have taken, especially in slow motion. However, you will need an app to properly analyze the videos you have created and to precisely determine posture and four key variables: MSA, ROS, SAT, and FAT. There are several different apps on the market, but a highly functional one is Coach’s Eye by TechSmith. Coach’s Eye provides slow-motion analysis and a variety of useful form-measurement tools. The app allows users to easily share any video (email or upload) with another party, such as a coach, coaching client, or running partner. The app is also inexpensive (in fact, the basic app is free), especially considering the wealth of form information it can provide. If you intend to obtain Coach’s Eye or a similar app, be sure to purchase the “angle-measurement” tool as well. This is also inexpensive and is indispensable for measuring MSA, ROS (and thus ROS/MSA), SAT, FAT, and posture.
Once you have your chosen app installed on your smart phone, you are ready to complete the analysis. Begin with the first video taken at a slow run. Open the video with Coach’s Eye or a similar app and roll it through manually—frame by frame—until you are certain that you are seeing the maximum forward swing of one leg (right or left, whichever swings forward first in the video). Toggle the video back and forth until you are sure that you have the max swing point and thus MSA.
Once you are confident that you are seeing the maximum forward swing of the leg, you are ready to measure maximum shank angle (MSA). Using the frame which displays max forward swing, and with the additional angle tool you downloaded, draw a straight line from the center of the athlete’s knee, down the lower part of the leg, and through the foot. Make sure that this line runs straight through the middle of the lower part of the leg—don’t let it “pull away” from the leg (figure 5.1). You can end this line slightly below the foot, but be certain that the line is straight and travels down the middle of the lower limb from knee to foot.
Here are the four leading video-analysis apps to consider purchasing:
- Coach’s Eye (TechSmith): www.coachseye.com/
- Hudl Technique (formerly known as UberSense which was acquired by Hudl in 2014): www.hudl.com/products/technique
- Dartfish Express (Dartfish): www.dartfish.com/Mobile
- ReplayCam (DreamGarage Inc.): https://itunes.apple.com/us/app/replaycam-the-time-shift-video-camera/id590197399?mt=8
Here is a link to a comparison review of the first three: http://crosscountryskitechnique.com/review-top-3-sport-video-analysis-apps/
Now you are ready to draw the second line, the one that will allow the measurement of MSA. From the bottom of the first line, draw this second line straight forward, parallel with the ground. The two lines you have drawn will meet just below the foot and will form an angle between them (figure 5.2). The app’s angle tool allows you to measure this angle automatically.
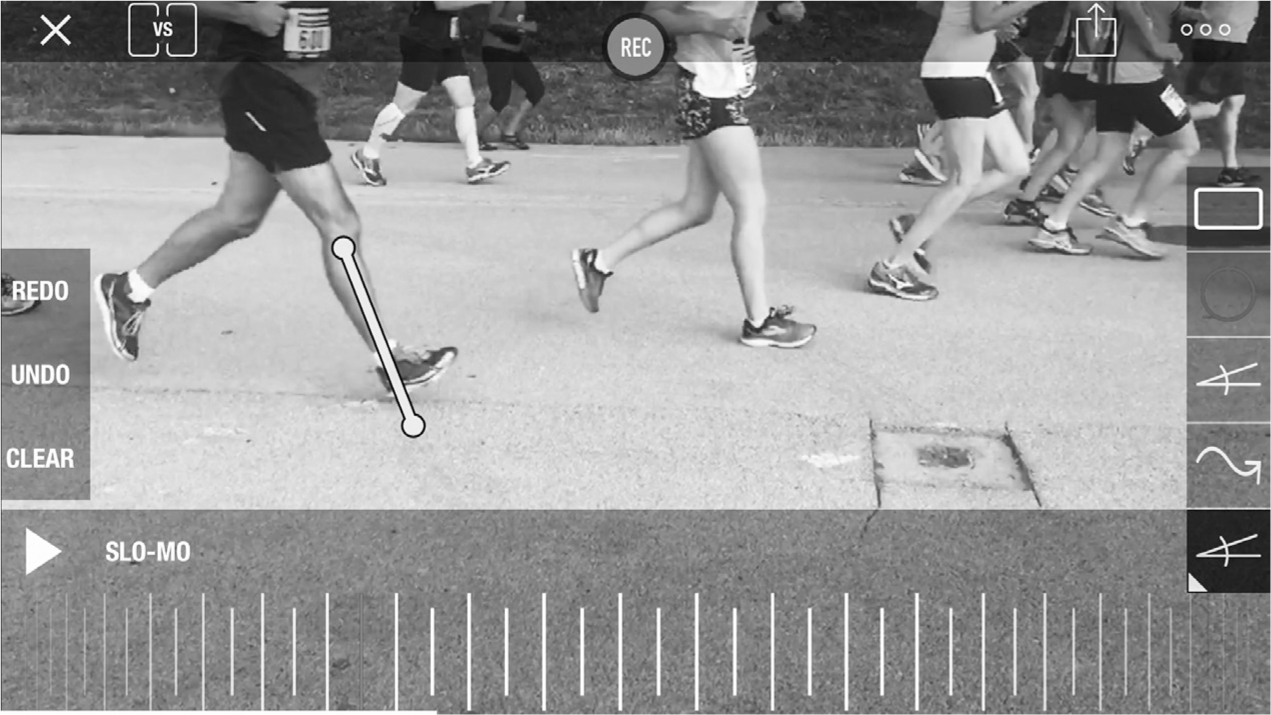
Figure 5.1 Begin by drawing a straight line through the shank.
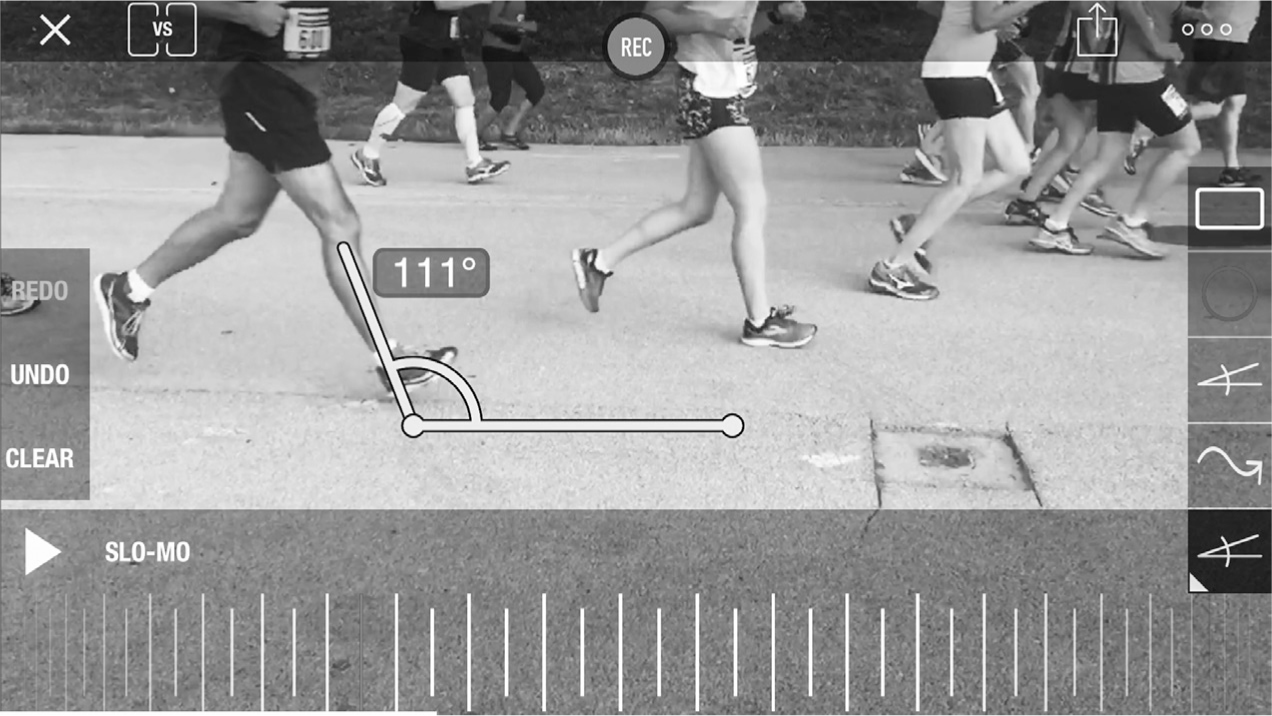
Figure 5.2 Draw a second line which starts at the bottom of the first line and extends straight and parallel with the ground.
Now MSA can be determined: It is simply the angle you have just measured minus 90 degrees. For example, in this case the measurement of the shank at its furthest position forward yielded an angle of 111 degrees, which is very common, and the maximum shank angle is 111 − 90 = 21 degrees.
Measuring Shank Angle at Impact
After determining MSA, you can ascertain the all-important shank angle at touchdown (SAT). Continue toggling the video forward frame by frame until you reach what appears to be the first impact with the ground.
Once you have settled on the video frame associated with initial impact, again use your app to draw a straight line from the knee, down through the lower part of the leg, and through the foot. Make sure this line stays in the exact center of the lower portion of the leg at all times (as you did when measuring MSA). End this line just below the foot (figure 5.3).
Then draw a second line that begins at the lowest point of the first line and extends straight forward, parallel with the ground. Once this second line is drawn, you will have formed a nice angle. The app will automatically indicate the size of the angle. Subtract 90 degrees from the measured angle, and the result will be the SAT.
In this case, the two lines at the moment of impact produce an angle of 108 degrees (figure 5.4). As shown in the equation 108 − 90 = 18 degrees. An SAT of 18 degrees sounds quite high but is actually very common. Unfortunately, an 18-degree SAT is usually associated with a relatively straight leg at impact with the ground—a key running-form flaw that produces elevated impact forces and thus a greater risk of injury plus higher braking forces and thus a throttling effect on speed.
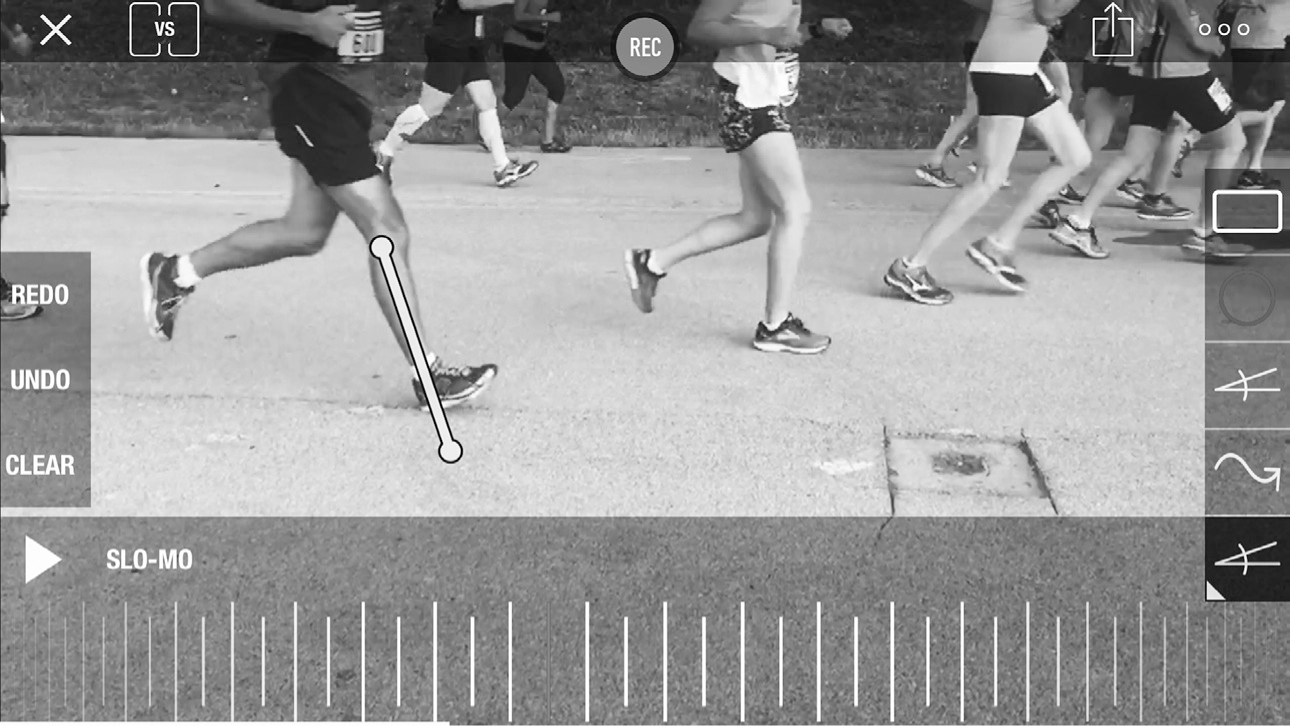
Figure 5.3 Once you have found the exact moment of foot strike, draw a line straight through the middle of the shank through the foot to the ground.
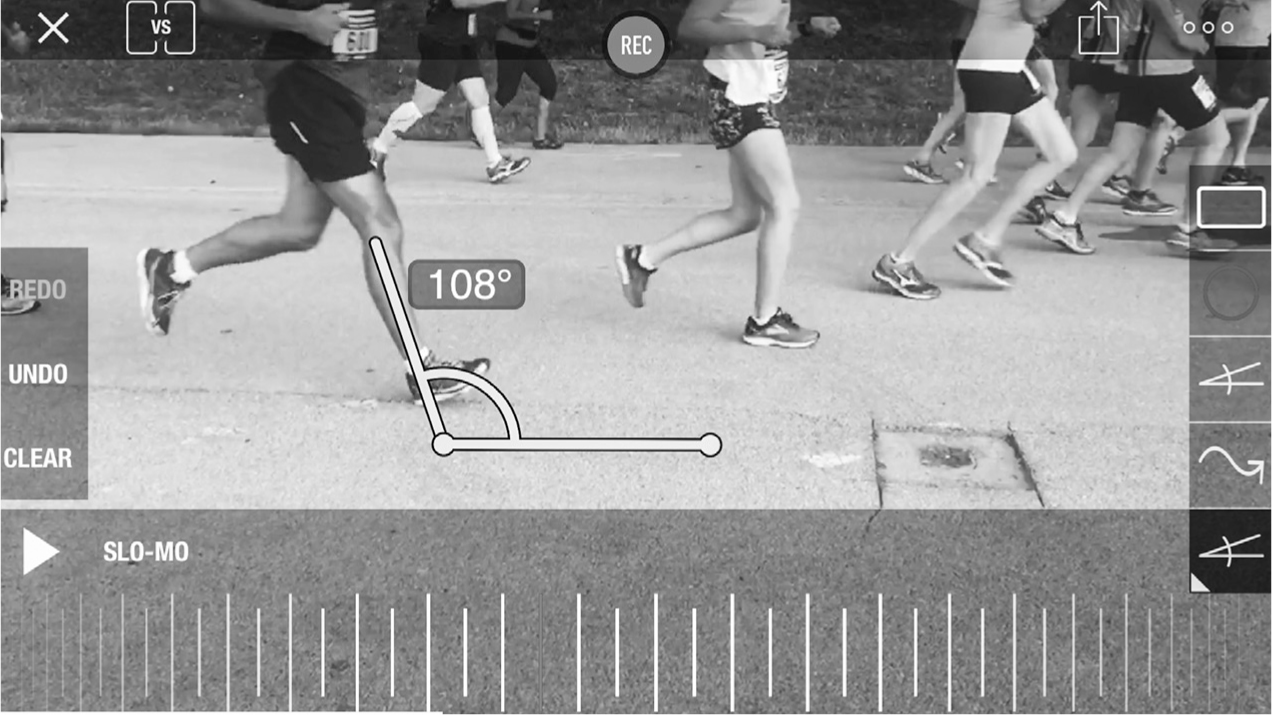
Figure 5.4 SAT is measured with two lines, one running straight down the middle of the shank and the other originating at the base of the first line and running parallel with the ground.
Measuring How FAT Your Landing Is
You are now ready to measure foot angle at touchdown (FAT). From that same point of initial contact with the ground (the instant where you measured SAT), draw a line straight through the foot, from the base of the heel, through the bottoms of the toes (or through the corresponding parts of the running shoe). Draw a second line that originates from the point of contact with the ground (at the heel or front of the foot), parallel with the ground (figure 5.5). The resulting angle is the FAT. If the ankle is dorsiflexed at the moment of initial contact, FAT will be positive. If the ankle is plantar-flexed at touchdown, FAT will be negative (figures 5.6).
Finally, measure MSA, SAT, and FAT for the other leg; then repeat these measurements for the videos taken at moderate and high speeds. Record all of the angles in table form (table 5.1). All of these angles will be essential as you begin the process of upgrading running form.
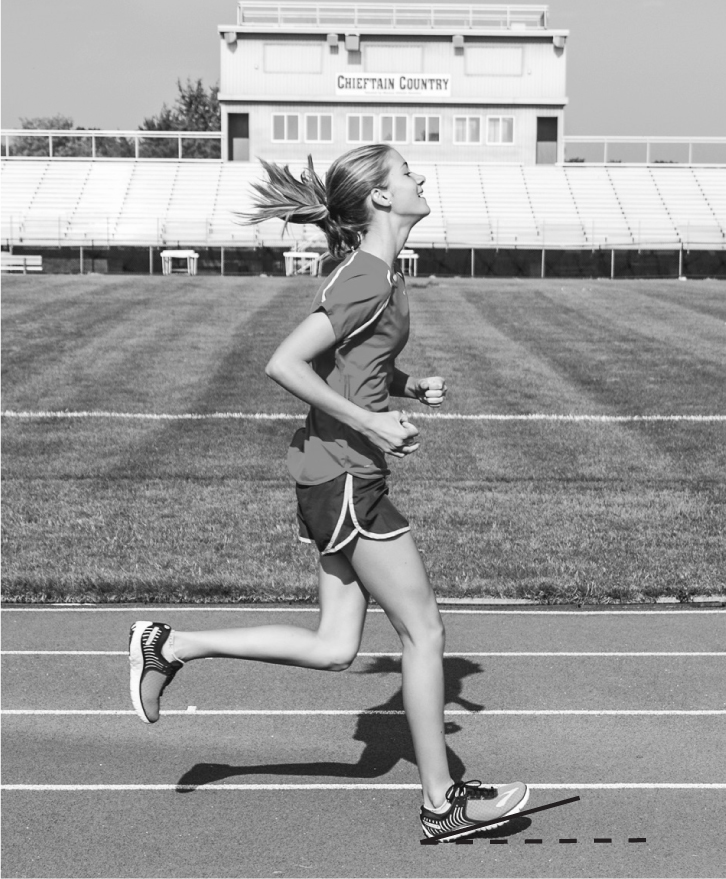
Figure 5.5 To determine FAT, first draw a line straight through the foot, from the base of the heel through the bottoms of the toes. Next, draw a second line parallel with the ground, beginning at the heel. If the ankle is dorsi-flexed at the moment of contact, FAT will be positive.
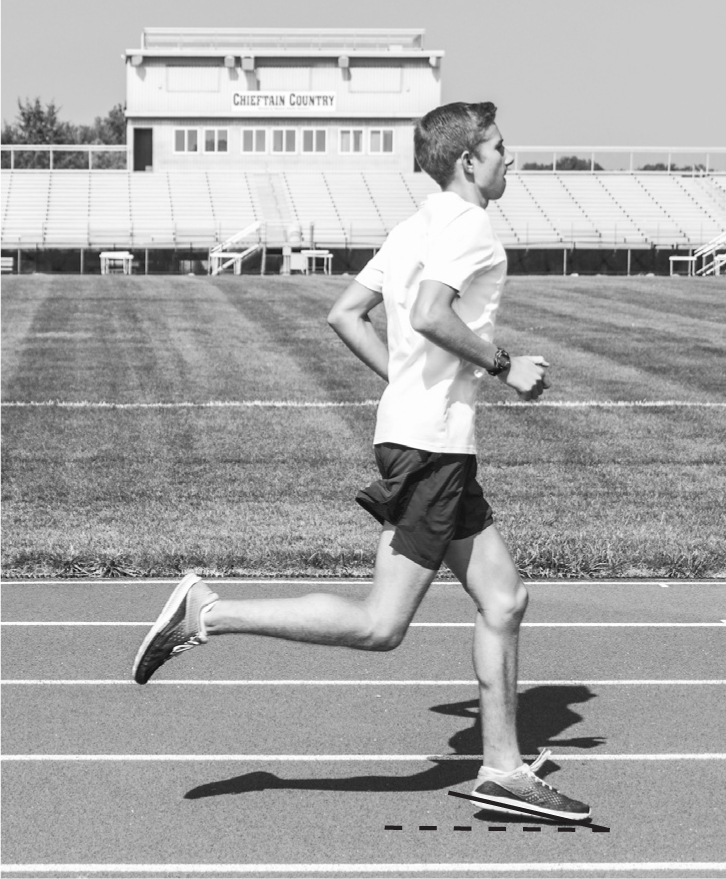
Figure 5.6 To determine FAT when the ankle is plantar-flexed at touchdown, first draw a line straight through the foot, from the bottoms of the toes through the base of the heel. Next, draw a second line parallel with the ground, beginning at the toes. If the ankle is plantar-flexed at the moment of contact, FAT will be negative.
|
TABLE 5.1 Form Variables for Right and Left Legs |
||
|
MEASUREMENTS |
RIGHT LEG |
LEFT LEG |
|
MSA |
||
|
SAT |
||
|
ROS |
||
|
ROS/MSA ratio |
||
|
FAT |
||
|
From Anderson, 2018, Running Form: How to Run Faster and Prevent Injury, (Champaign, IL: Human Kinetics). |
||
Calculating ROS and the ROS/MSA Ratio
As mentioned, to measure reversal of swing (ROS) simply subtract SAT from MSA (ROS = MSA − SAT). For example, if MSA is 18 degrees and SAT is 12 degrees, then ROS is 18 − 12 = 6 degrees. Determine ROS for both legs at all three running speeds and include it in table 5.1.
Calculation of the all-important ROS/MSA ratio is similarly simple: Just divide ROS by the MSA. In the case above, 6/18 yields an ROS/MSA ratio of .33. Looking at this another way, we can say that after attaining her MSA, the runner swept the foot back 33 percent of the way before hitting the ground (or reversed swing by 33 percent). This is a critically important number to know, since small ROS/MSA ratios are associated with imparting little kinetic energy to the ground, and extra-large ratios, although rare, may put the leg in a disadvantageous position from the standpoint of producing optimal propulsive forces. An optimal ROS/MSA ratio is about .7 to .75.
Comparing the Three Videos
The table that you have generated (table 5.1) provides tremendous insight into your current form. As you develop better form over time, you will produce new tables and will be able to monitor your form improvements in an objective, quantitative way.
You will also likely find that the numbers are quite different between your right leg and left leg. While this might seem surprising, it is completely normal: Very few runners have legs that function identically. Most runners—even Usain Bolt—have a fast leg and a slow leg, where one leg does a better job of optimizing the form variables. From the standpoints of performance improvement and injury prevention, this is actually a very good (not disappointing) thing to know. You now have the concepts of good form and the quantitative tools you need to work diligently on both legs, with special focus paid to your slow leg.
You may find that your right leg commonly produces an SAT of six to eight degrees, while your left is consistently at 2 degrees (figures 5.9 and 5.10). When you carry out your form drills, you can concentrate more intently on the left leg to bring it in line with the right. A similar situation may prevail with MSA, ROS, and FAT; but with video analysis and proper drilling, you can get the legs functioning optimally and in nearly identical fashion.
Setting Form Goals
Unless you already have optimal form, your work is now set out for you. If you are a distance runner, optimal SAT is around five to seven degrees, and ROS/MSA is approximately .7 to .75. These are the values that you should strive to achieve, using the form-enhancing drills and techniques described in the following chapters. You will also incorporate drills into training to establish a neutral or slightly negative FAT. Please note that MSA actually increases with running speed—the higher the speed, the greater the MSA. However, optimal SAT and ROS/MSA ratio do NOT change with running speed—they remain at 6 to 7 degrees and .7 to .75, respectively.
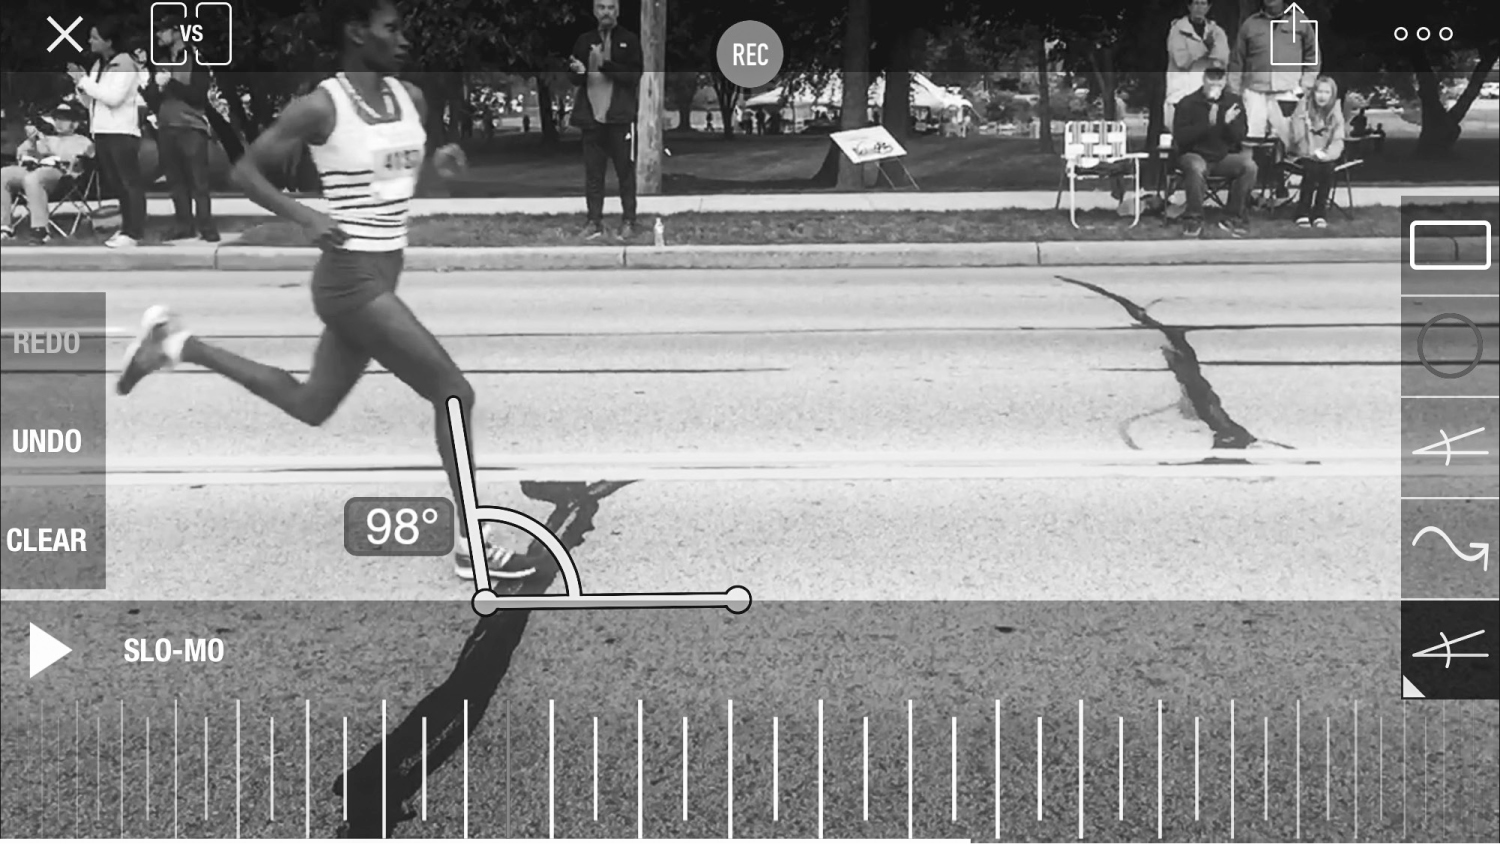
Figure 5.9 This elite runner has an SAT of 8 degrees with her right leg.
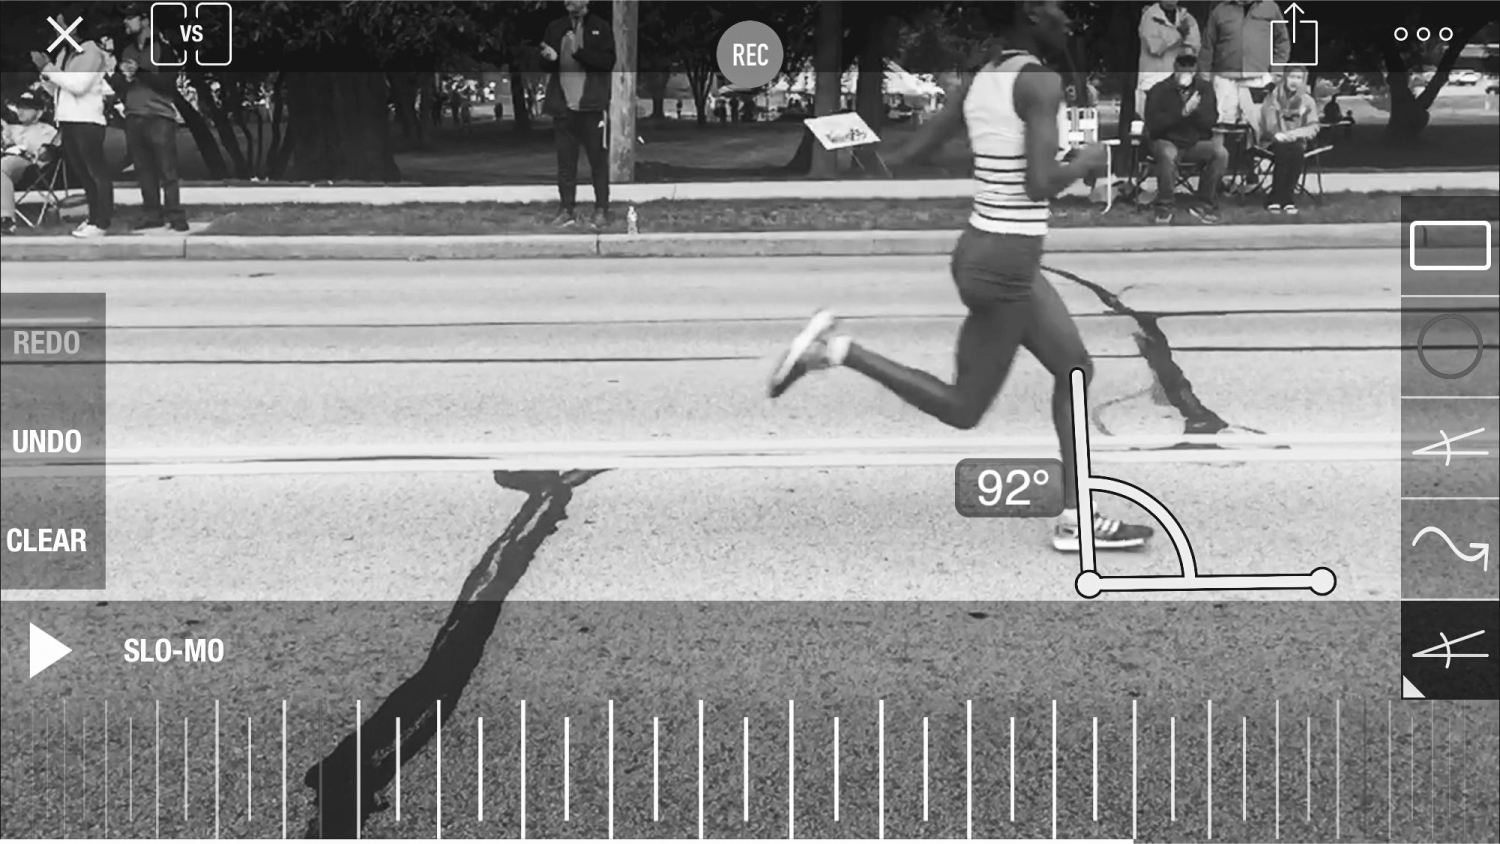
Figure 5.10 However, with her left leg SAT is 2 degrees. By using the drills found in this book, she can equalize SAT at ~6 degrees in each leg.
If you are a sprinter, three of the optimal values are quite different: FAT will be more negative, as the ankle will be more plantar-flexed at touchdown and initial contact will be with the front of the foot. MSA may be as great as 34 degrees and ROS may be as high as 26 to 28 degrees, in order to produce the greater speeds required for sprinting. However, SAT will still be approximately six to seven degrees.
Measuring Posture
To assess posture, select a moment from the video when the athlete is in mid-stance, and use the app to position three points on the runner’s body: center of the hip, center of the thorax, and middle of the head. Then draw a straight line from the hip to the center of the thorax, and another straight line from the thorax to the middle of the head.
When posture is good, the two lines should be continuous—that is, the thorax point should appear on the straight line drawn from the hip to the head. More commonly, the line from the thorax to the skull is inclined forward, compared with the line from the hip to the chest, and this can produce form trouble that hurts performance (figure 5.11).
The ideal complete straight line, which includes all three points (hip, trunk, and head), should have a slight forward inclination (figure 5.12). Don’t be confused by this. It is bad when the upper line from the trunk to the head is inclined forward relative to the lower line (from the trunk to the hip). But it is very good when the two lines make one straight line and that whole line is leaning forward. This helps the body move forward, rather than merely upward as propulsive force is applied to the ground during the stance phase of gait.

Figure 5.11 With poor posture, two distinct lines are created, one from the hips to the thorax, and one from thorax to center of head.
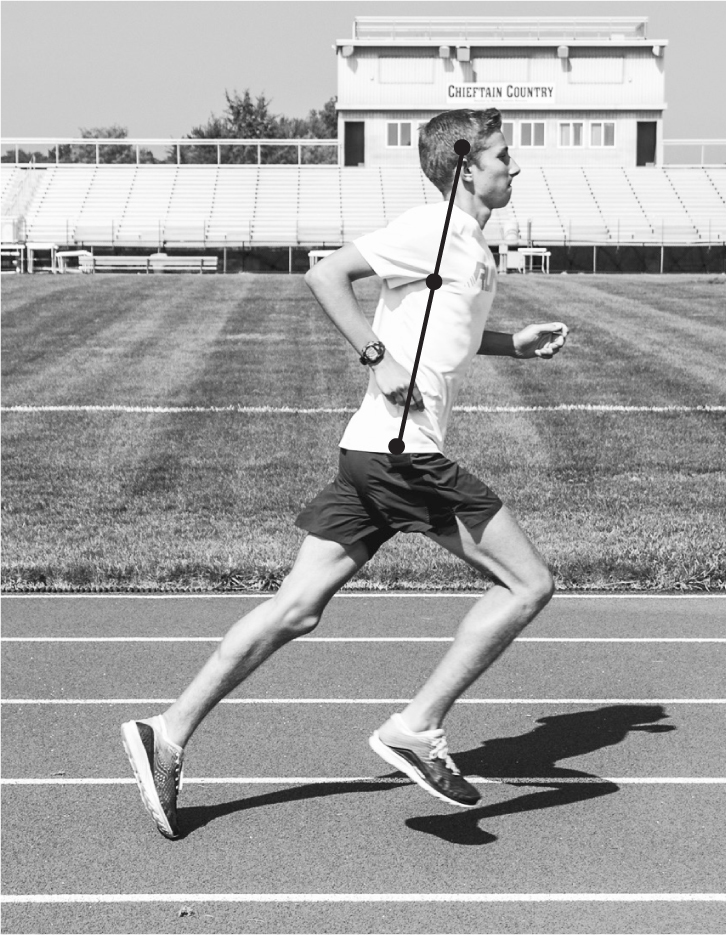
Figure 5.12 With good posture, a line through the center of the hips, center of thorax, and center of head is a straight line with a slightly forward overall inclination.
As posture can be somewhat fluid, determine posture during various phases of stance and swing for each leg at all three speeds. Take note of any differences between legs or any dramatic changes in posture over the course of the gait cycle. Drills and techniques for improving posture will be described fully in chapter 10.
Summary
You now have all the skills and tools you need to assess your running form properly. You can determine posture, foot-strike pattern (FAT), maximum shank angle (MSA), reversal of swing (ROS), shank angle at impact (SAT), and the key ratio, ROS/MSA, in straightforward ways. In the following chapters, you will learn exactly how to optimize your form and become a more-economical, faster runner with a lower risk of injury.