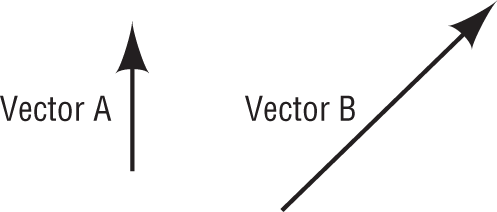
Figure 4-1 Two vectors.
© Jones & Bartlett Learning.
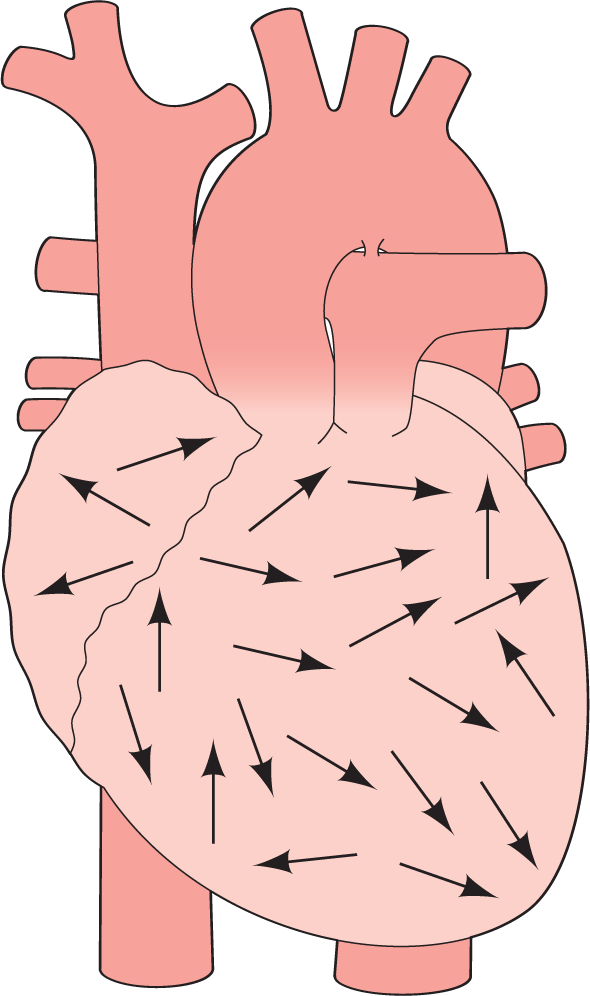
Imagine each cell giving rise to its own electrical impulse. These impulses vary in intensity and direction. We use the term vector to describe these electrical impulses. A vector is a diagrammatic way to show the strength and the direction of the electrical impulse. For example, suppose the amount of electrical activity generated by a cell is worth $1.00 and is directed to the top of the page. We’ll call that line Vector A (Figure 4-1). Now, another cell has an electrical discharge that is worth $2.00 and faces the upper right corner. The latter, Vector B, will be twice as big as Vector A. Well, as you can imagine, the heart has a few million of these individual vectors (Figure 4-2).

Figure 4-1 Two vectors.
© Jones & Bartlett Learning.

Figure 4-2 The heart contains millions of vectors.
© Jones & Bartlett Learning.