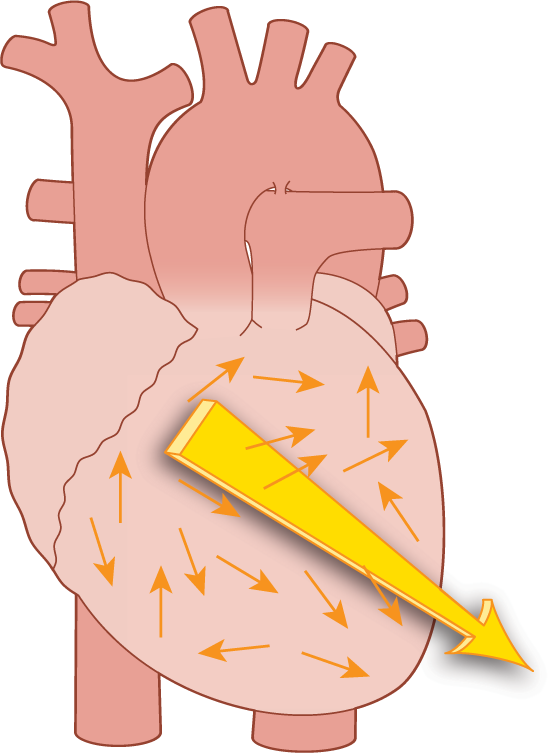
Figure 4-4 Sum of all ventricular vectors = electrical axis.
© Jones & Bartlett Learning.
The Electrical Axis of the Heart
Now, take the sum of all of the millions of vectors found in the ventricles of the heart. We’ll wait a few minutes while you add them up. That final vector, after all of the addition, subtraction, and direction changes, is known as the electrical axis of the ventricle (Figure 4-4). In the same way, each wave and segment has its own respective vector. There is a P-wave vector, a T-wave vector, an ST-segment vector, and a QRS vector. The ECG is a measurement of these vectors as they pass under an electrode. That’s it! It is an electronic representation of the electrical movement of the main vectors passing under an electrode, or a lead. In the next pages, we will discuss only the QRS vector.

Figure 4-4 Sum of all ventricular vectors = electrical axis.
© Jones & Bartlett Learning.