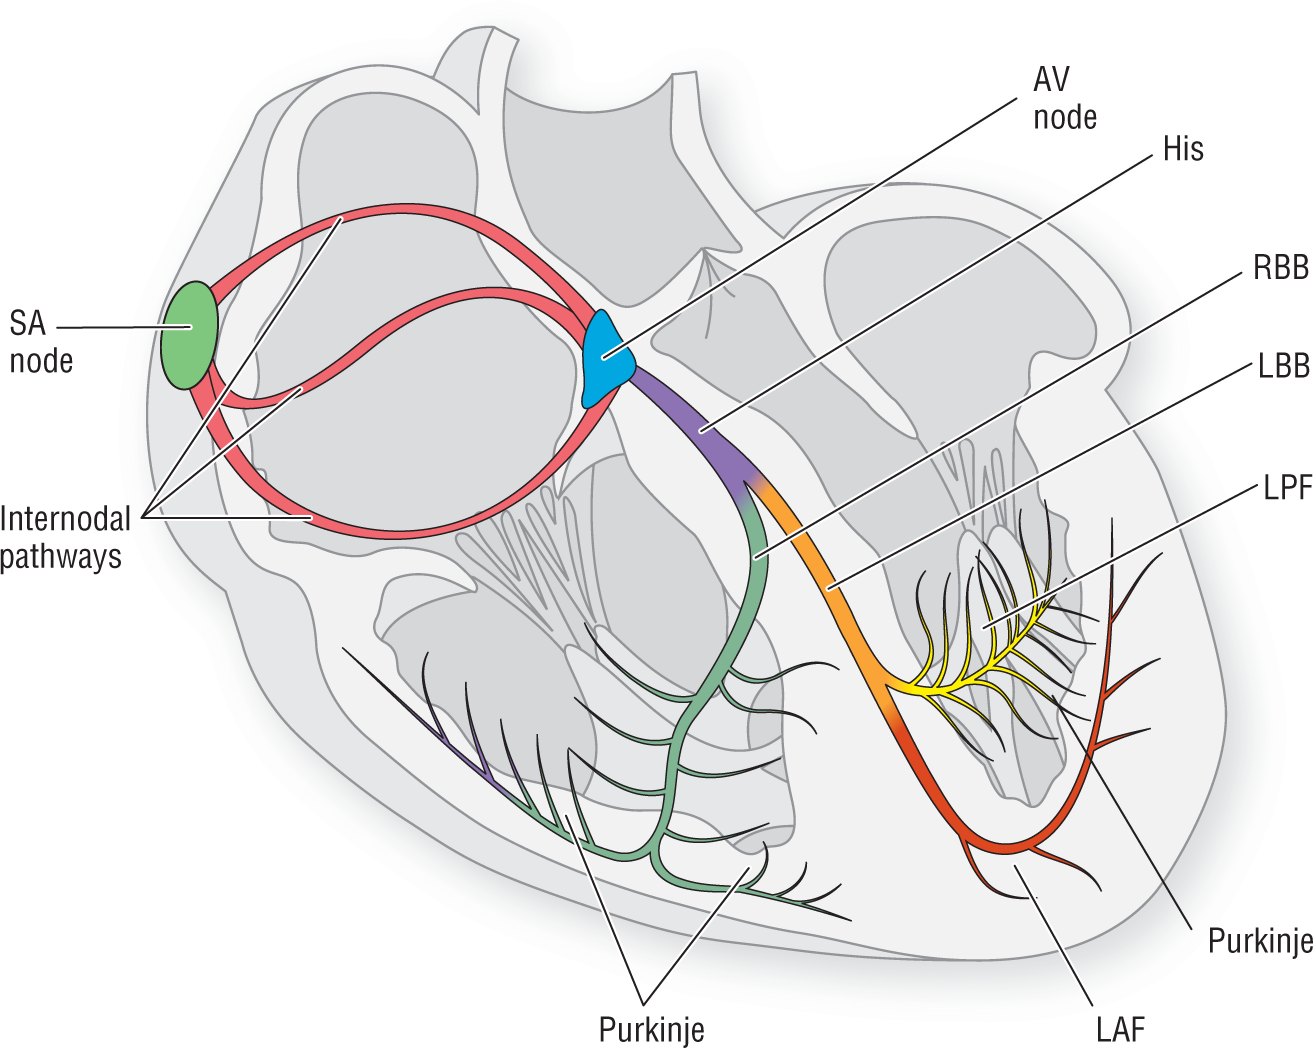
Figure 5-15 The heart and the electrical conduction system.
© Jones & Bartlett Learning.
In this section we will discuss the concept of the bundle branch block (BBB) to help you formulate a practical understanding of the electrocardiographic principles involved.
We need to start off our general discussion by revisiting the electrical conduction system (Figure 5-15). Notice that the bundle of His splits off into the left and right bundle branches (LBB and RBB). The LBB, in turn, divides into the left anterior and left posterior fascicles. Both the RBB and the two fascicles then split into smaller and smaller branches to form a network of terminal branches, which are collectively known as the Purkinje system (Figure 5-16). The Purkinje system allows the almost instantaneous firing of all of the ventricular cells at once.

Figure 5-15 The heart and the electrical conduction system.
© Jones & Bartlett Learning.
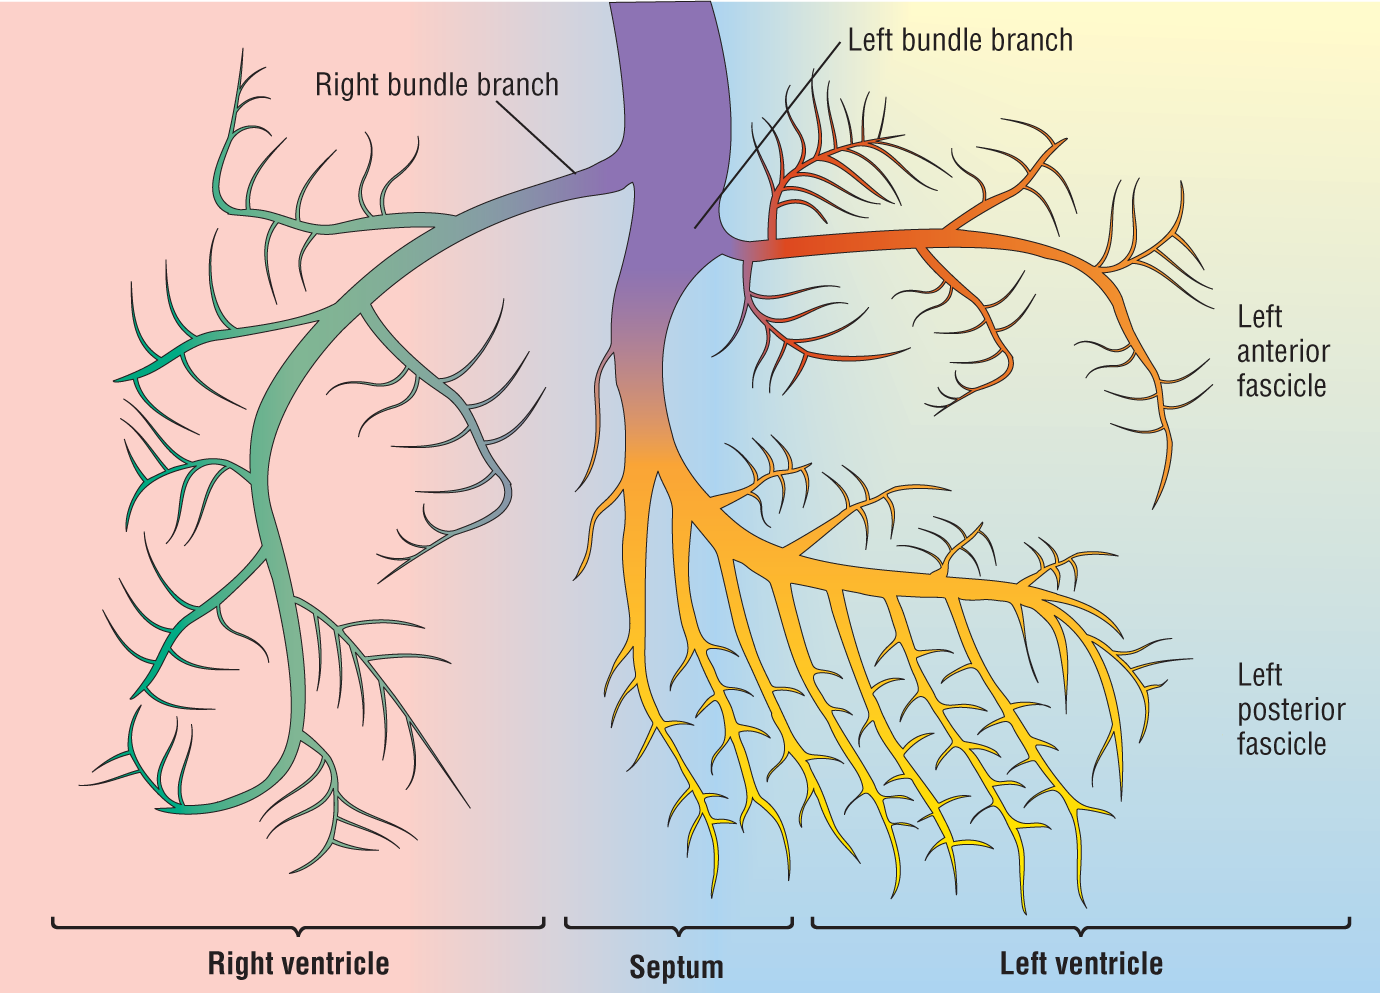
Figure 5-16 A closer look at the electrical conduction system.
© Jones & Bartlett Learning.
DescriptionLook at Figure 5-16. We want you to use your imagination to think about the ventricles of the heart as a flat sheet rather than a three-dimensional structure. Thinking about the system in this way will facilitate your understanding of the concepts.
Notice how the conduction system divides and innervates different areas of the heart. The left anterior fascicle innervates the superior and anterior aspects of the left ventricle (LV). The left posterior fascicle innervates the inferior and posterior aspects of the LV. The RBB innervates part of the septum and the right ventricle (RV).
Note that there is overlap of the different systems. This overlap is more prominent along the septum and along the border of the two fascicles.
What Happens If One Side Is Blocked?
OK, now suppose what would happen if the patient had an MI or something that blocks or destroys part of the conduction system (Figure 5-17)? Well, the normally functioning system would transmit the impulse down the section of normal pathway the same way it always does. The sections of the heart that are innervated by those fibers would then fire instantaneously and in a coordinated fashion. However, the section that is innervated by the blocked section would not receive a coordinated pulse. It would, instead, have to be depolarized by a slow transmission of the impulse that is spread directly from cell to cell (Figure 5-18), starting from somewhere along the septum and then spreading like a wave across the affected area of the heart.
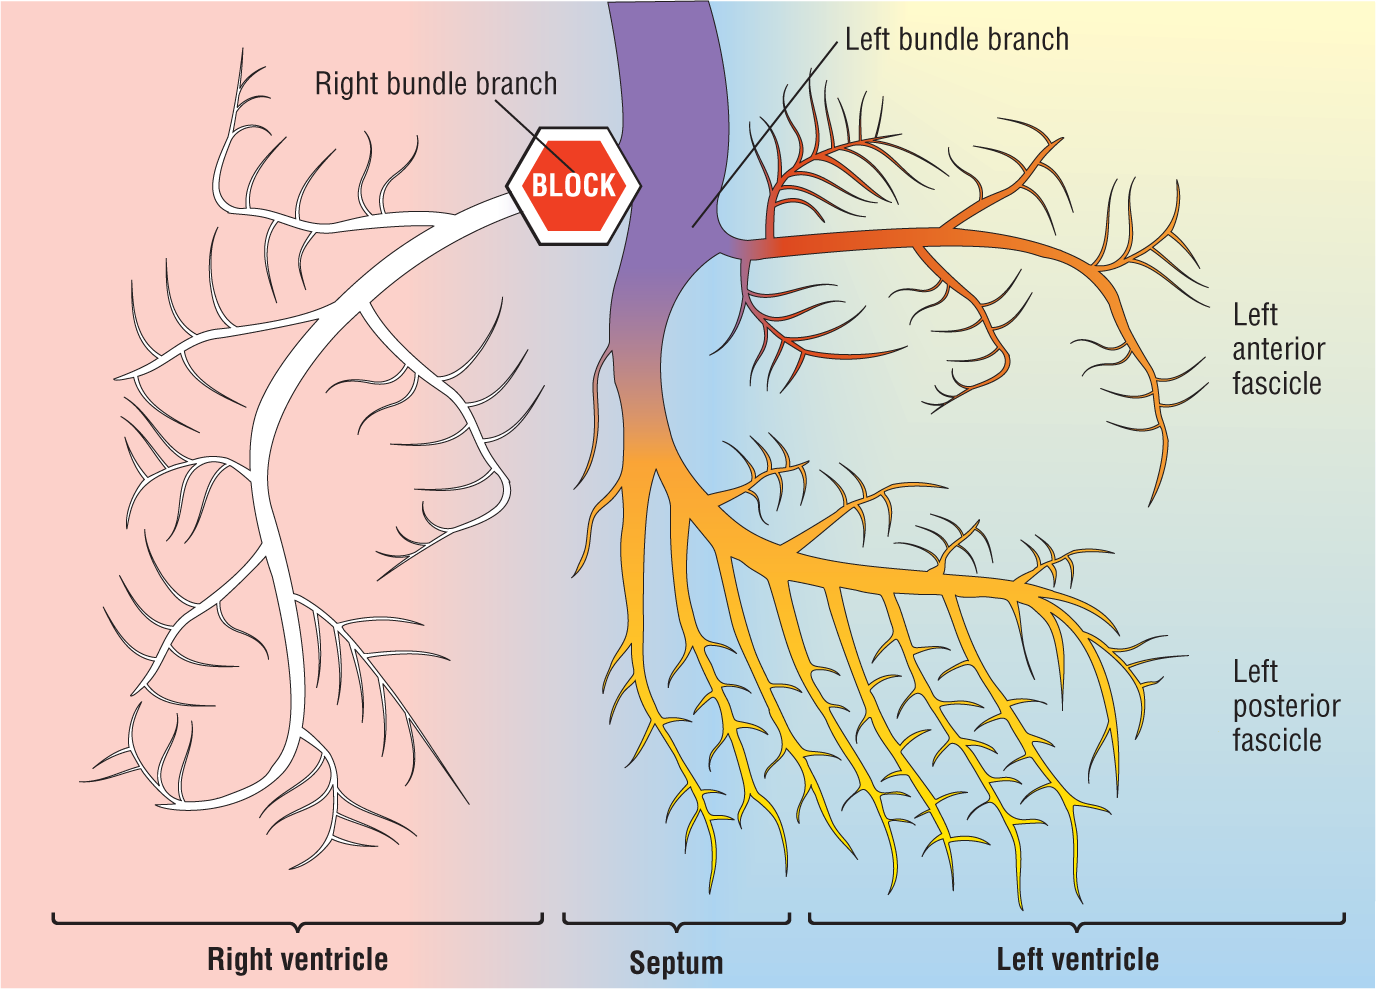
Figure 5-17 Bundle branch block.
© Jones & Bartlett Learning.
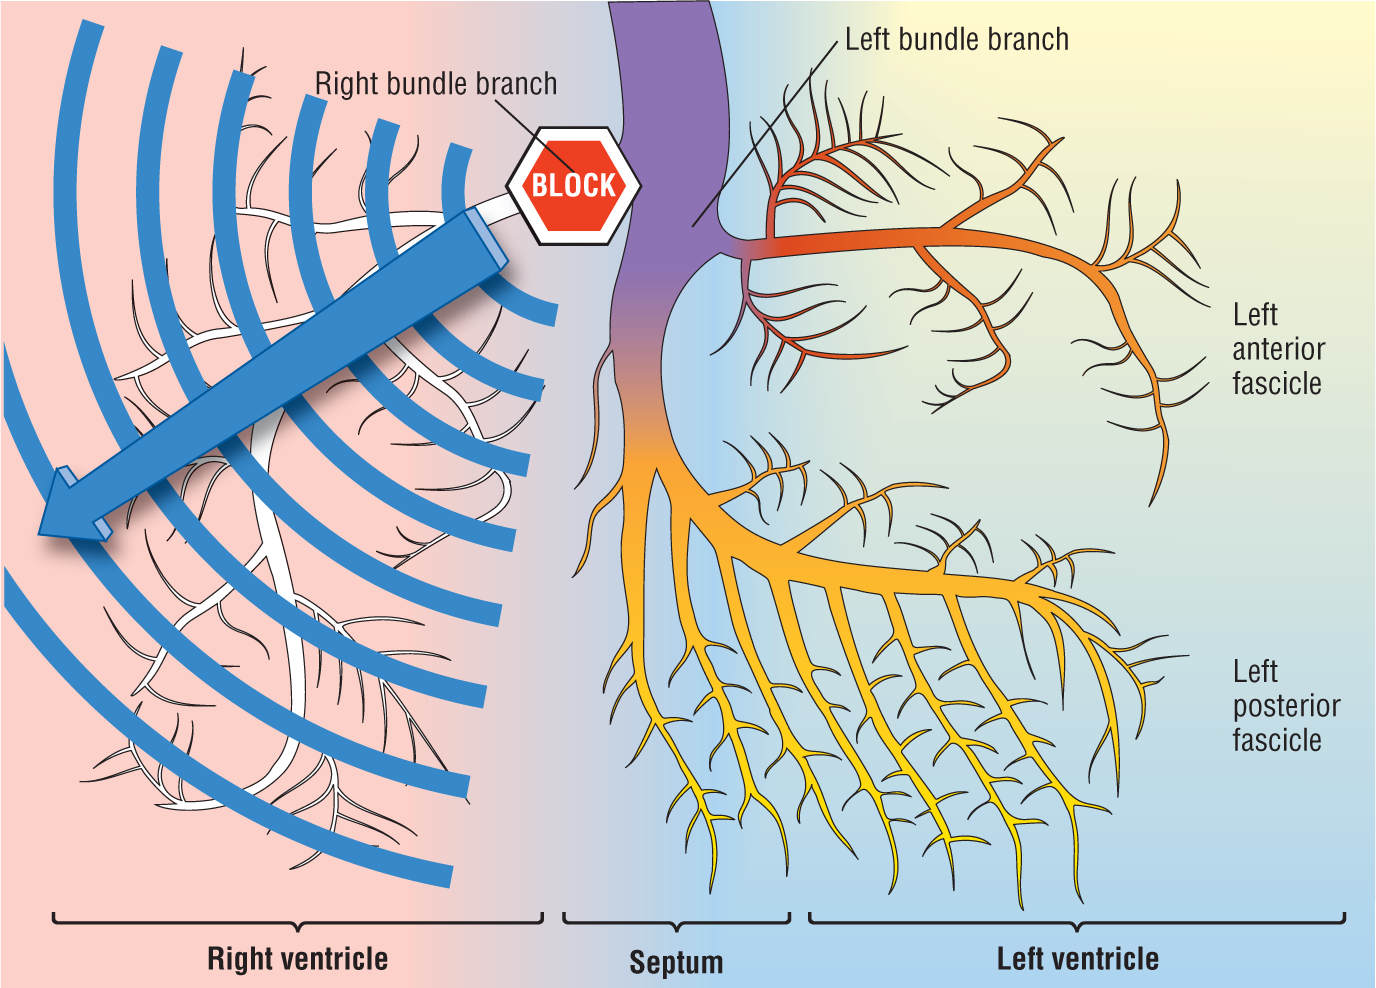
Figure 5-18 Slow depolarization caused by the bundle branch block.
© Jones & Bartlett Learning.
Let’s look at Figure 5-18 a little more closely. The impulse would travel down the left bundle normally. Hence, the LV and that section of the septum that is innervated by the LBB would fire normally. On the other hand, the rest of the septum, and the RV, would depolarize by the slower cell-to-cell route.
As you can imagine, this method of depolarizing the ventricles will give rise to abnormal-looking complexes on the ECG. Would the width of the QRS complex be increased? Yes. Why? Because the slow cell-to-cell transmission requires a longer period of time to depolarize that section of the heart. The net result is that the complexes are wider—greater than or equal to 0.12 seconds, to be exact.
Would the morphology be different? Yes, it would. Once again, the morphology of the complex is an electrocardiographic representation of the vectors occurring in the heart during depolarization and repolarization. By adding the block, we have now created a slow-moving vector that was not there originally. In addition, since it occurs after the LBB has fired, the slow vector would be unopposed. This extra and unopposed vector will dramatically alter the appearance of the QRS complex.
Right Bundle Branch Block (RBBB)
The Major Morphologies
Previously, we stated that the appearance of the QRS complex would be different from normal in both width and morphology. The good news is that there are only two major morphology patterns noted in bundle branch blocks: RBBB and LBBB. We will start with RBBB (Figure 5-19).
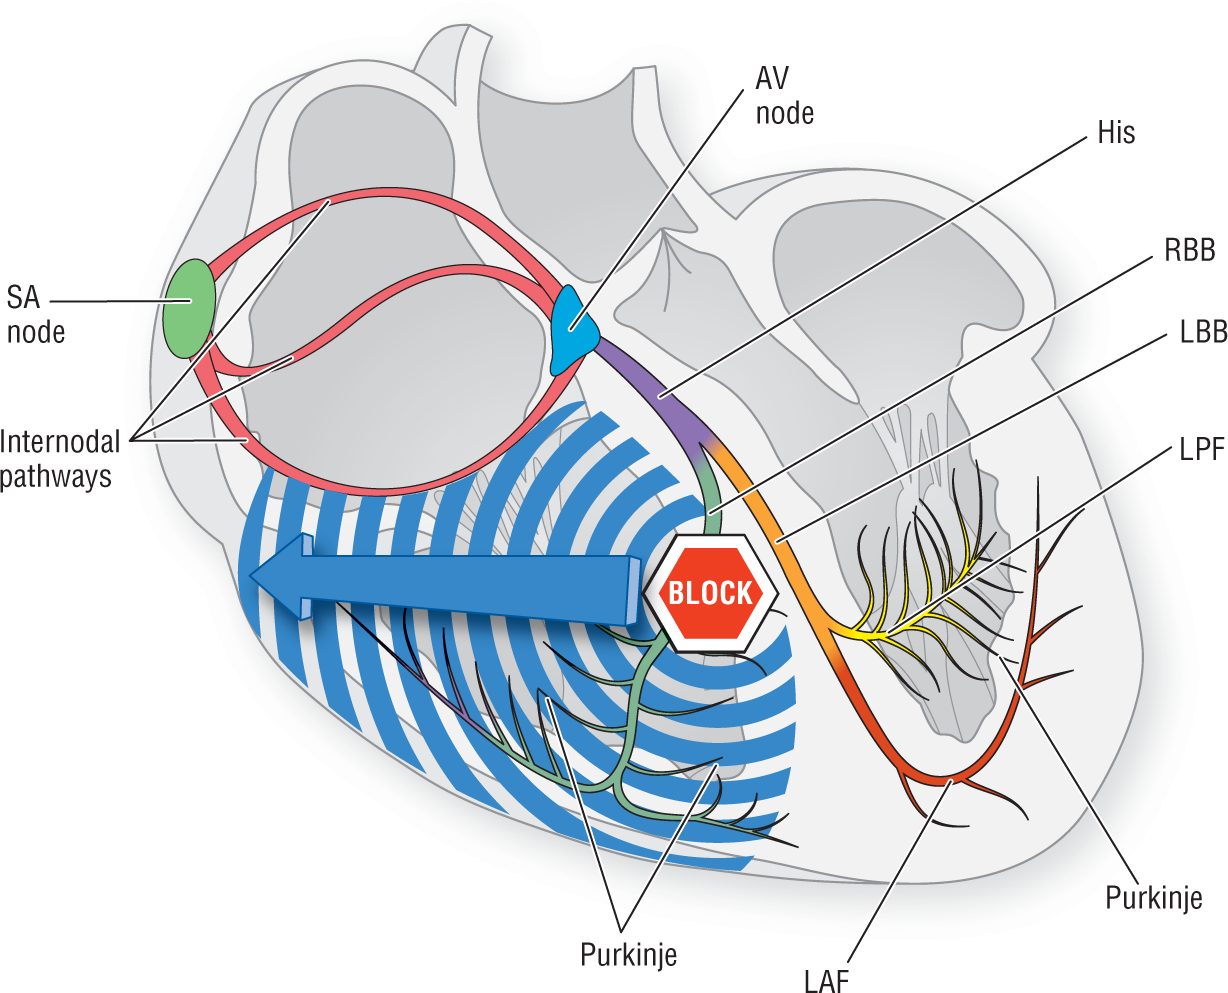
Figure 5-19 Right bundle branch block.
© Jones & Bartlett Learning.
RBBB pattern is caused by a block of the right bundle branch somewhere near its inception. The fact that the left side of the heart depolarizes normally gives rise to a QRS complex that initially starts with a normal appearance. That is to say, the first 0.04 to 0.08 seconds of the QRS complex appear nice and tight, with the initial deflection headed in the exact direction we would ordinarily expect.
The end of the complex, however, is a different matter. This part appears wide and bizarre because of the vector labeled 4 in Figure 5-20. That slow, unopposed vector appears as a slow, slurring S wave in leads I and V6. This occurs because vector 4 is heading toward the right, away from the electrodes placed at the lead I and V6 sites.
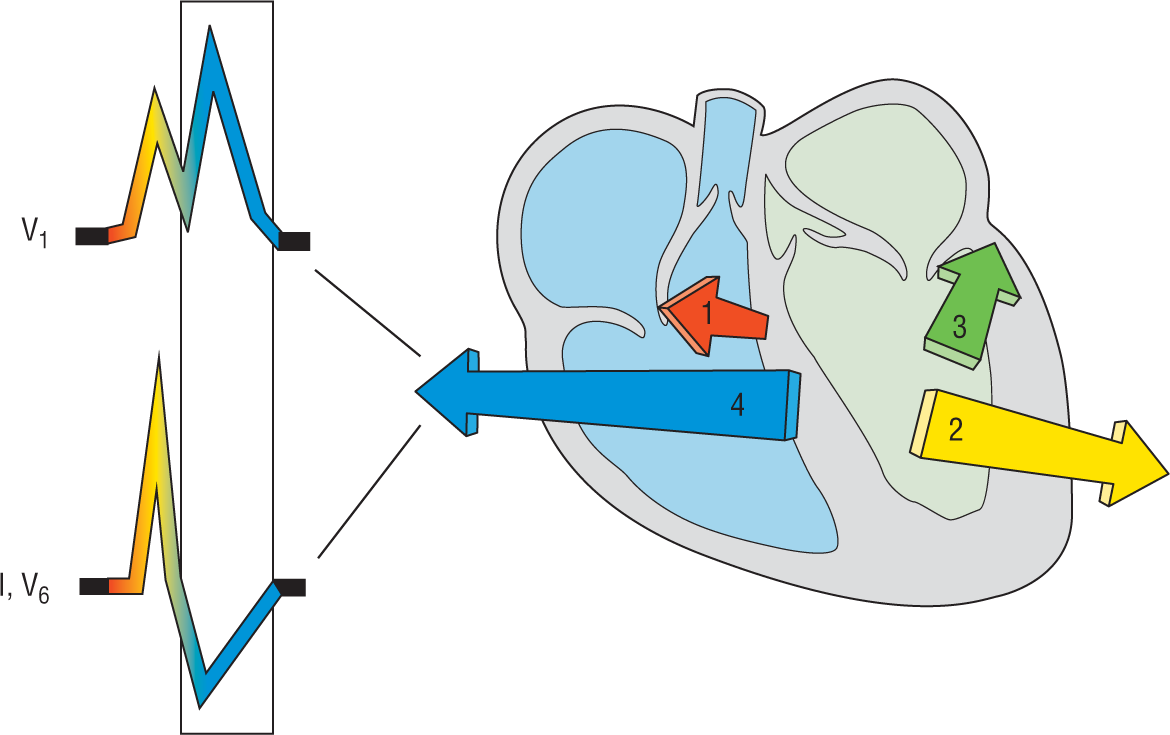
Figure 5-20 RBBB’s effect on the ECG.
© Jones & Bartlett Learning.
DescriptionIn lead V1, the pattern is a bit different. Here vector 1, which reflects septal depolarization, creates a small r wave. Next, the vectors marked 2 and 3 cause an S wave. The S wave does not get to complete, however, because vector 4 starts to oppose it. Shortly afterward, vector 4 comes into full, unopposed glory. Once again, the electrode at V1 sees a large, unopposed vector coming at it, and represents this as a much taller R’ wave. This is how the traditional rsR’ or RSR’ of RBBB in V1 is formed. Many people refer to this complex as the “rabbit ears” for obvious reasons (Figure 5-21).
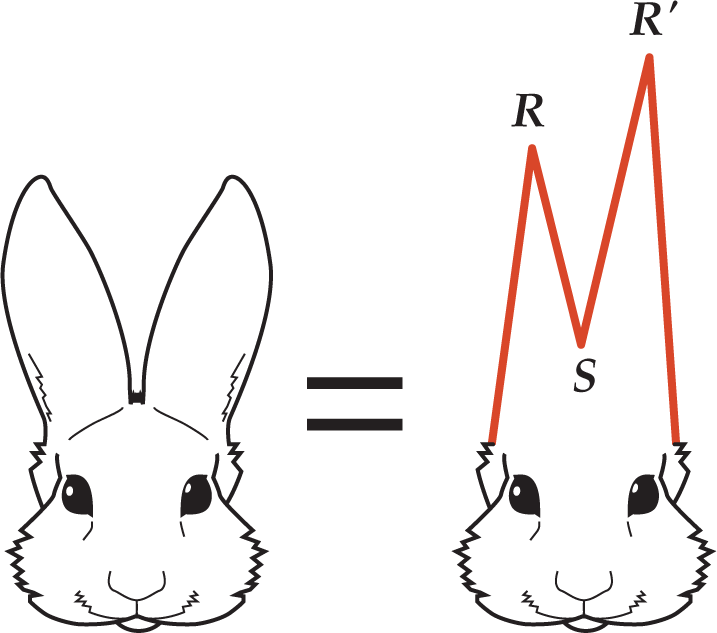
Figure 5-21 The RSR’ complex of RBBB in V1.
© Jones & Bartlett Learning.
We need to make one thing perfectly clear. We mentioned that a BBB gives rise to two major morphologies, but there are millions of minor morphologies depending on the location of the actual block, the direction of the slow depolarization wave, and so on. The net result is that the RSR’ and the slurred S waves can have millions of minor differences, just as there are millions of different appearances to real rabbit ears (Figure 5-22).

Figure 5-22 The various looks of a slurred S wave.
© Jones & Bartlett Learning.
DescriptionThis leads us to our next pearl of wisdom: Never count on rabbit ears to make the diagnosis of RBBB! Sometimes the complexes in lead V1 will not look like rabbit ears at all but just like a big R wave, or an R wave with a slight hump. This lack of obvious rabbit ears is the main failure to diagnose RBBB. This can be a critical mistake in interpreting an ECG. Many patients have died and many unfortunate practitioners have been sued because of this failure to diagnose RBBB.
The most important thing to notice in lead V1 is that you will always have positive complexes. You will never—we repeat, never—see negative complexes in lead V1 in the presence of an RBBB. This is because of that unopposed vector, which causes a markedly positive complex in lead V1.
So besides a positive complex in V1, what should we look for to make the diagnosis of RBBB? The answer is the slurred S waves in leads I and V6. Always look for the slurred S waves. They are much more consistent in appearance than the RSR’ complex. This is the opposite of what is suggested by authors who encourage a dependence on observing rabbit ears. We hope this does not offend anyone, but this is a rookie mistake. If the QRS complex is greater than or equal to 0.12 seconds, look for the slurred S waves and a positive complex in lead V1. If you see definite rabbit ears, then so much the better.
CLINICAL PEARL
Beware of rabbit ears! Look for the slurred S instead.
Applying the Criteria for RBBB
Get used to measuring intervals when you are calculating the rate on an ECG. Remember always to measure the widest wave or interval. If you find wide complexes that are greater than or equal to 0.12 seconds wide, then you could be dealing with a bundle branch block.
You should next look for slurred S waves in leads I and V6. If the S wave is fatter than the first part of the QRS complex and if the shape is slurred in any way, you can be quite confident that you are dealing with an RBBB.
Now look at V1. If there are positive complexes in this lead, regardless of morphology, you have definitely identified an RBBB pattern. This is simple, fast, and very accurate! Figure 5-23 summarizes the sequence of observations to make in identifying RBBB. The following list, along with Figure 5-24, illustrates the three criteria:
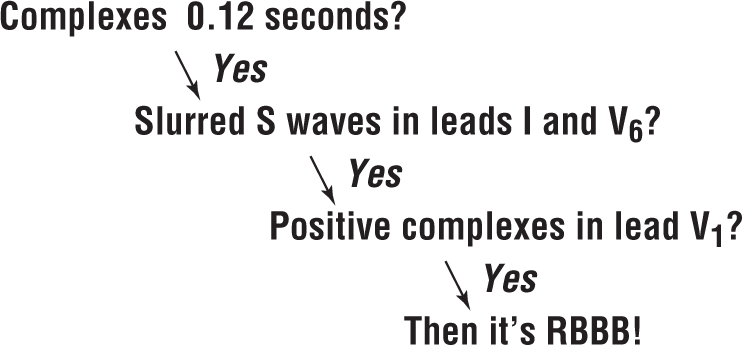
Figure 5-23 Decision sequence for RBBB.
© Jones & Bartlett Learning.
Description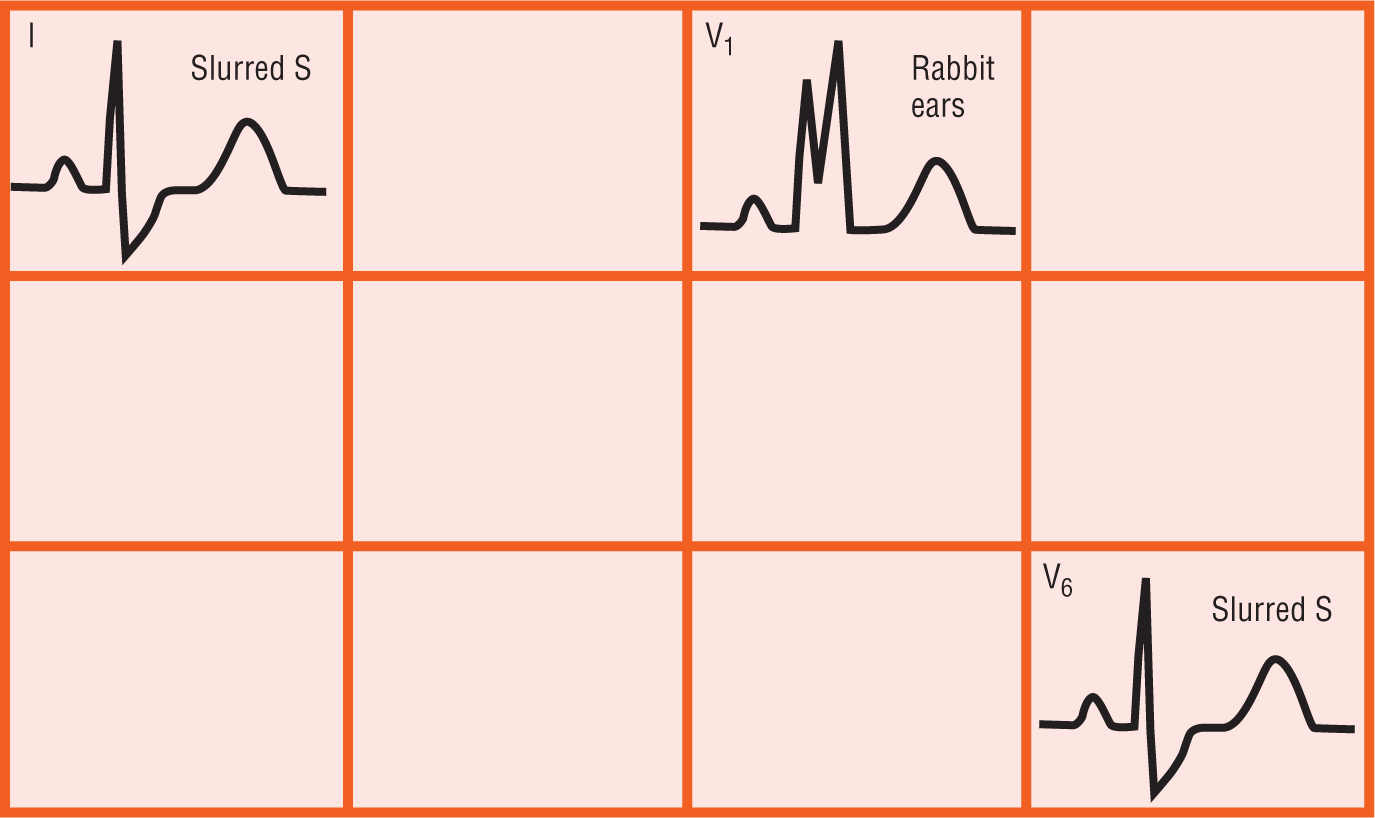
Figure 5-24 The ECG and RBBB.
© Jones & Bartlett Learning.
Left Bundle Branch Block (LBBB)
Remember these words of wisdom: Whenever you look at an ECG that has a regular rhythm and say, “Gee whiz, that’s an ugly gram!” you are probably looking at LBBB. The left bundle is always 0.12 seconds wide or more. So what makes these ECGs so ugly? They are usually composed of monomorphic complexes (either all positive or all negative) and have ST depression or elevation, and broad T waves. Note that the T waves should be discordant. This means that the last part of the QRS complex and the T wave should be electrically opposite each other. In other words, if the QRS complex is positive, then the T wave should be negative, or vice versa. If they both head in the same direction, it is called concordant; this is a sign of some pathologic process going on. The result of all of these findings is a “hunchback of Notre Dame” ECG.
The pathology involved in LBBB is caused by a block of the left bundle or of both fascicles of the left bundle. This block causes the electrical potential to travel down the right bundle first. Then ventricular depolarization proceeds from right to left by direct cell-to-cell transmission (Figure 5-25). The left ventricle is so big that the transmission is delayed, hence the 0.12 seconds or more criterion, and the complexes are not initially sharp as they were in the RBBB pattern. This slowed transmission with no sharp vectors gives rise to the broad, monomorphic complexes classically seen in LBBB. Furthermore, because the vector is proceeding from right to left, those complexes are negative in leads V1 to V2, and positive in I and V5 to V6. In other words: If you look at V1 and V6, you will note that the complexes are all positive or all negative, respectively (Figure 5-25). (Note: V1 and V2 may have a small r wave due to the initial vector produced by innervation through the right bundle.)
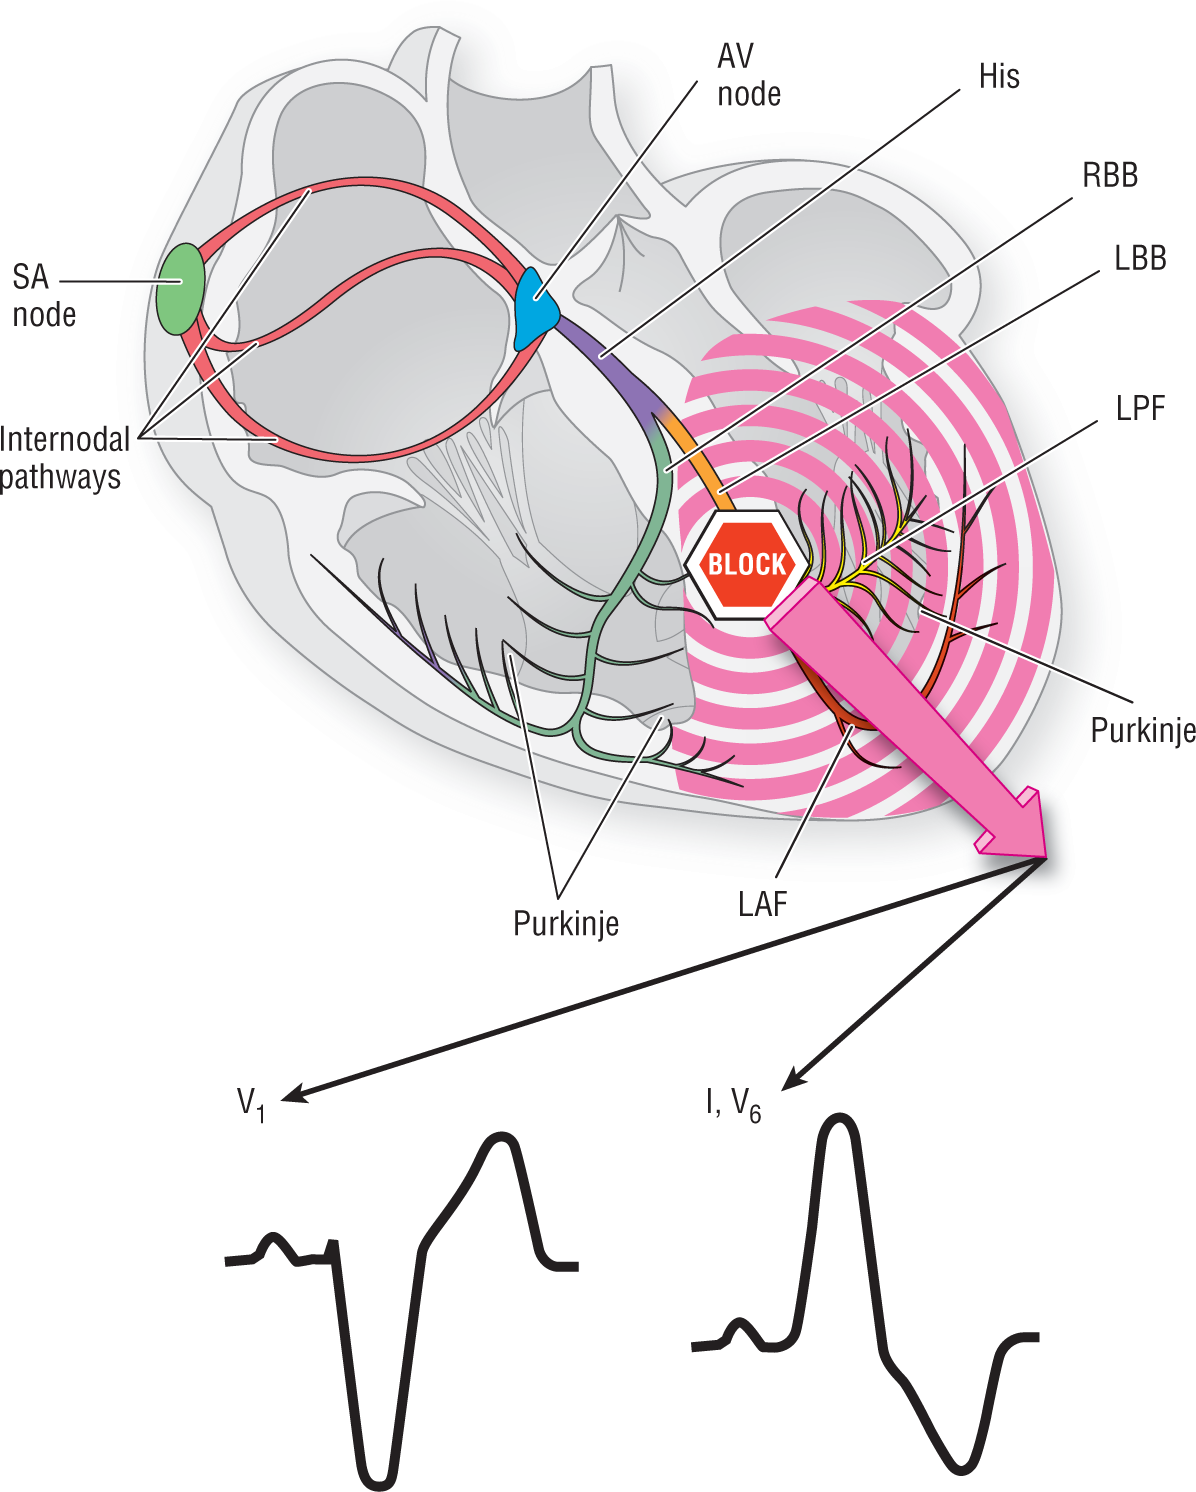
Figure 5-25 Left bundle branch block.
© Jones & Bartlett Learning.
DescriptionNOTE
The LBBB pattern is like a rock thrown up in the air; it either goes all up or all down!
Because the vector arising from the right bundle is small and canceled by the large vector from the left ventricle, the complexes are generally similar in different people. This makes the recognition of the LBBB pattern easier than that of RBBB. Just remember to look in V1 and V6; if the complexes are broad, monomorphic, and all up or down, you’ve identified LBBB!
Criteria for Diagnosing LBBB
As with RBBB, there are three main criteria for diagnosing LBBB (Figure 5-26):
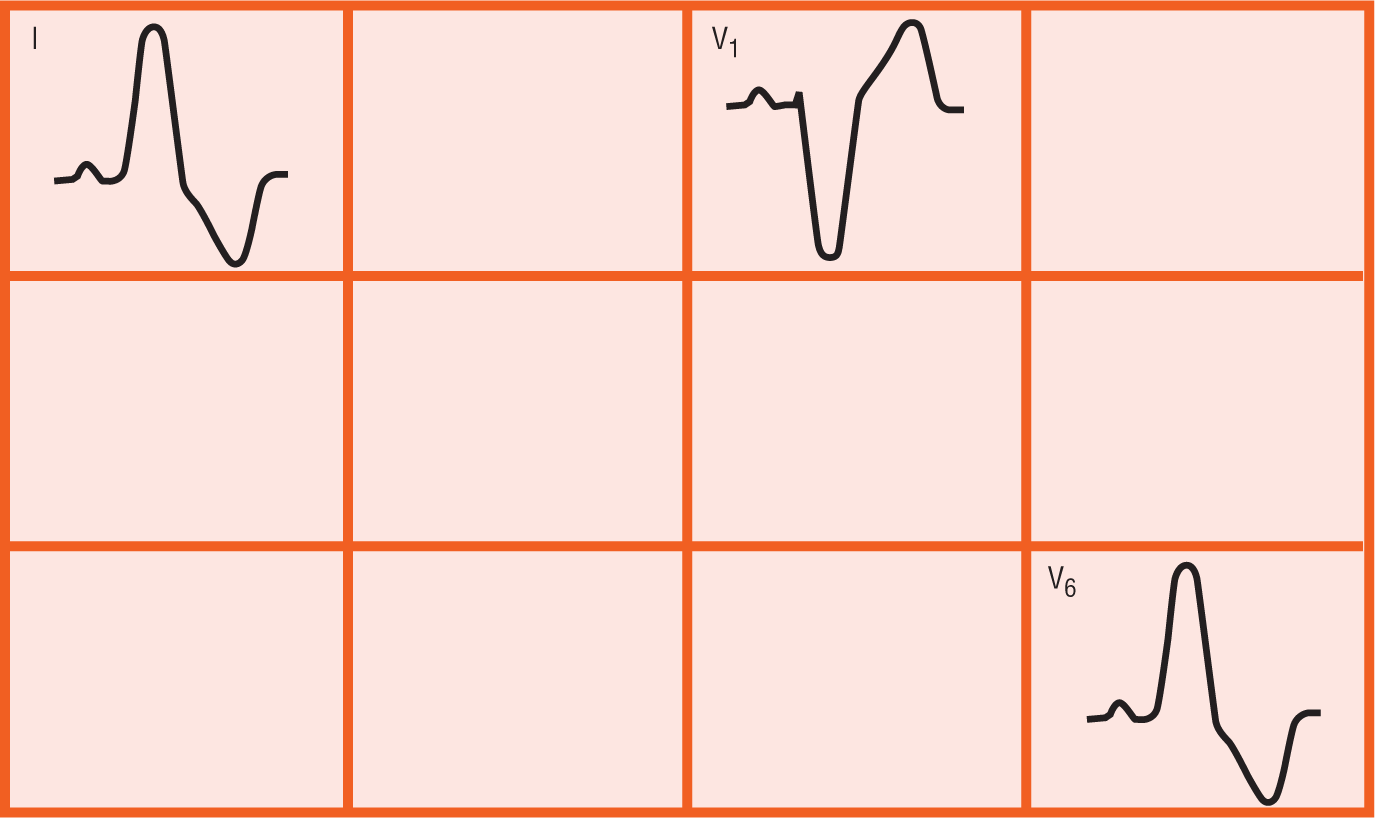
Figure 5-26 The ECG and LBBB.
© Jones & Bartlett Learning.
DescriptionJust as there are never any certainties in life, let us say that there are no certainties in the appearance of the complexes. In general, as mentioned earlier, all LBBBs are similar to each other—much more so than just about any other type of ECGs when it comes to the appearance of the complexes. However, having said this, some of the complexes may have various small differences; the R waves can be notched in V6, for instance (Figure 5-27). This notching can rarely be mistaken for an RSR’ pattern, but it is not RSR’! Remember that rabbit ears are associated with RBBB and are found in V1, not V6.
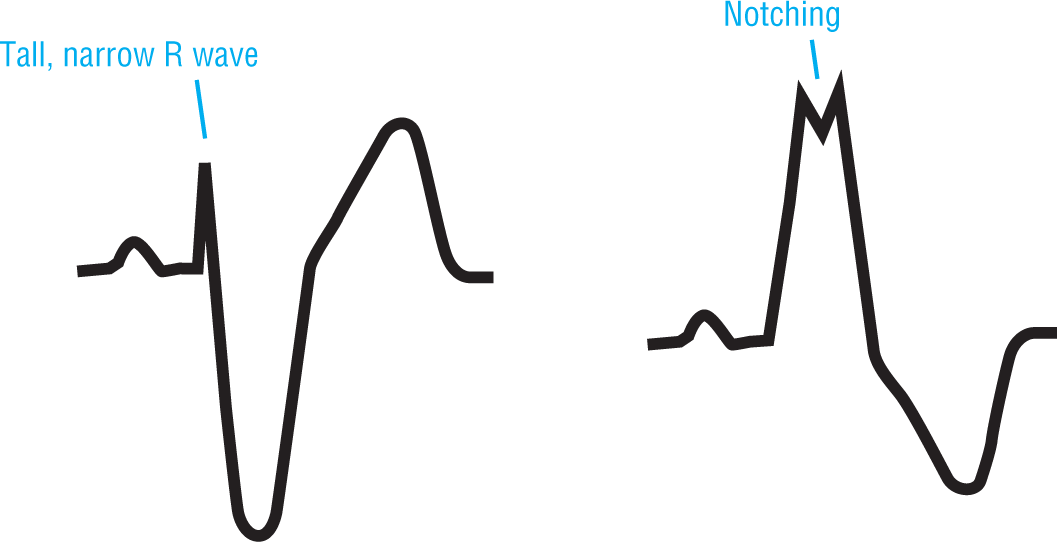
Figure 5-27 Here are some variations from the norm. Variations are not limited to the two examples shown in this illustration.
© Jones & Bartlett Learning.
There can also be some variations in the size of the R wave in V1. Note, for instance, that the R wave can be narrow—less than 0.03 seconds (Figure 5-27). Wider R waves can be a sign of a previous posterior AMI; we will discuss more on this later.