From Arrhythmia Recognition: The Art of Interpretation, courtesy of Tomas B. Garcia, MD.
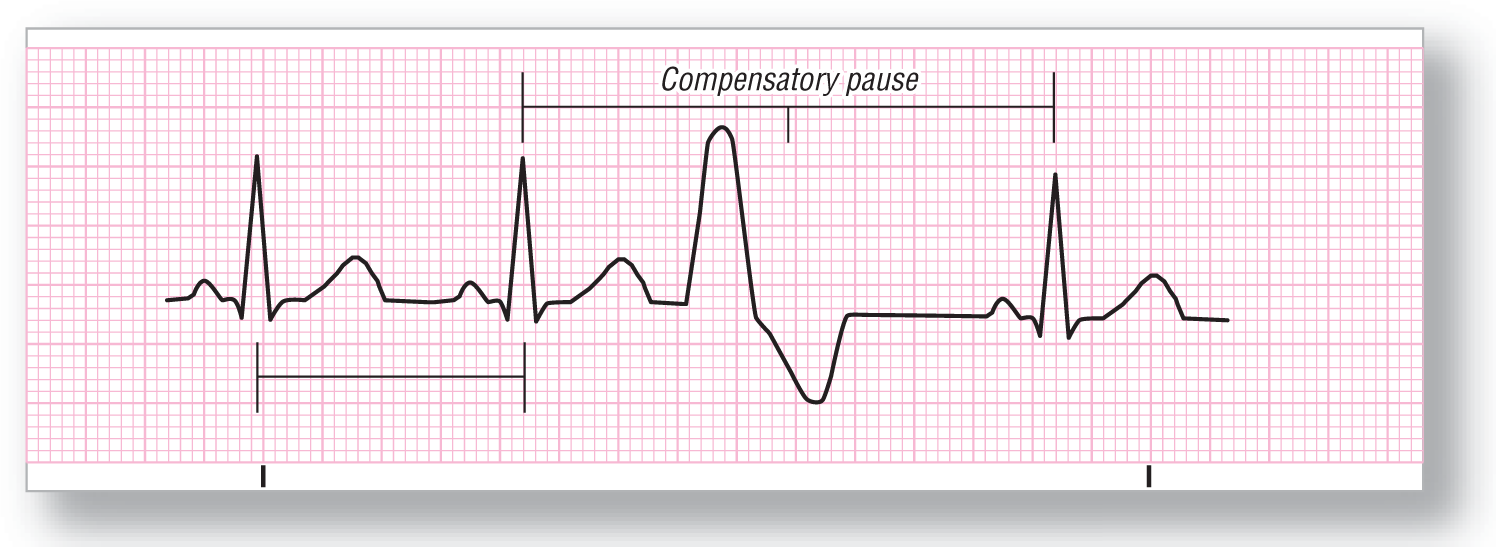
Premature Ventricular Contraction (PVC)

From Arrhythmia Recognition: The Art of Interpretation, courtesy of Tomas B. Garcia, MD.
|
Rate: Depends on underlying rhythm |
PR interval: None |
|
Regularity: Irregular |
QRS width: Wide (≥ 0.12 seconds), bizarre appearance |
|
P wave: Not present on the PVC |
Grouping: Usually not present |
|
P:QRS ratio: No P waves on the PVC |
Dropped beats: None |
Putting it all together:
A PVC is caused by the premature firing of a ventricular cell. The ventricular pacer fires before the normal SA node or supraventricular pacer, which causes the ventricles to be in a refractory state (not yet repolarized and unavailable to fire again) when the normal pacer fires. Hence, the ventricles do not contract at their normal time. However, the underlying pacing schedule is not altered, so the beat following the PVC will arrive on time. This is a compensatory pause.
Ventricular Escape Beat
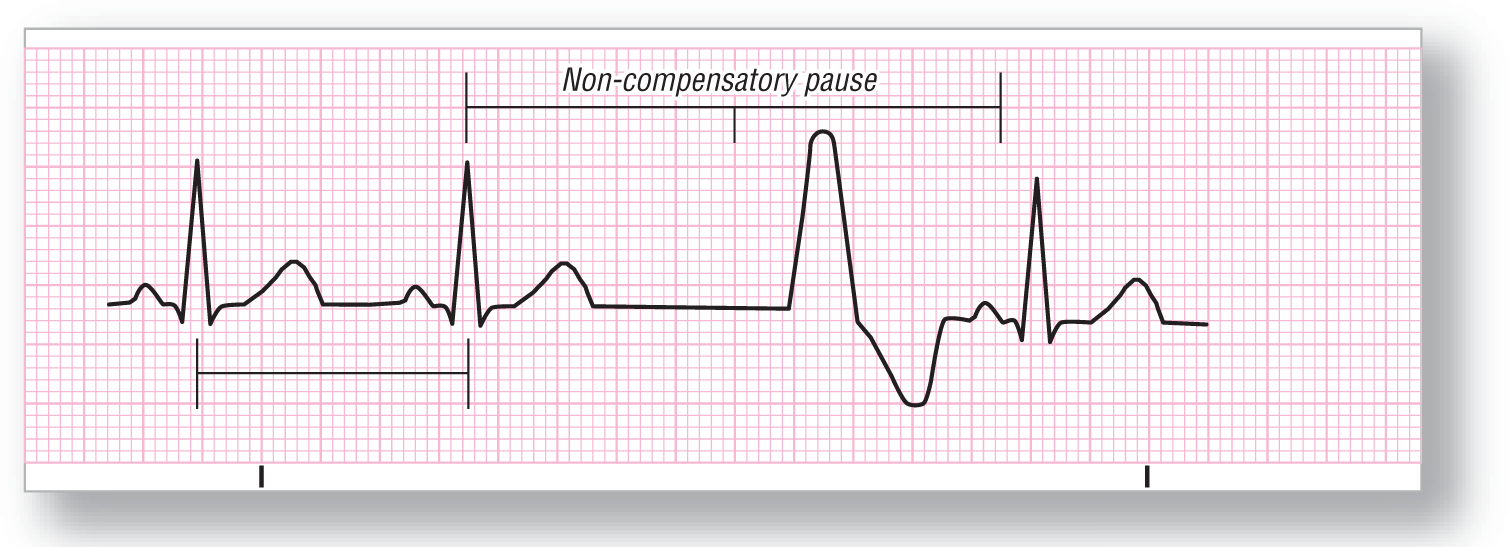
From Arrhythmia Recognition: The Art of Interpretation, courtesy of Tomas B. Garcia, MD.
Description|
Rate: Depends on underlying rhythm |
PR interval: None |
|
Regularity: Irregular |
QRS width: Wide (≥ 0.12 seconds), bizarre appearance |
|
P wave: None in the PVC |
Grouping: None |
|
P:QRS ratio: None in the PVC |
Dropped beats: None |
Putting it all together:
A ventricular escape beat is similar to a junctional escape beat, but the focus is in the ventricles. The pause is non-compensatory in this case because the normal pacer did not fire. (This is what led to the ventricular escape beat.) The pacer then resets itself on a new timing cycle, and may even have a different rate.
Idioventricular Rhythm
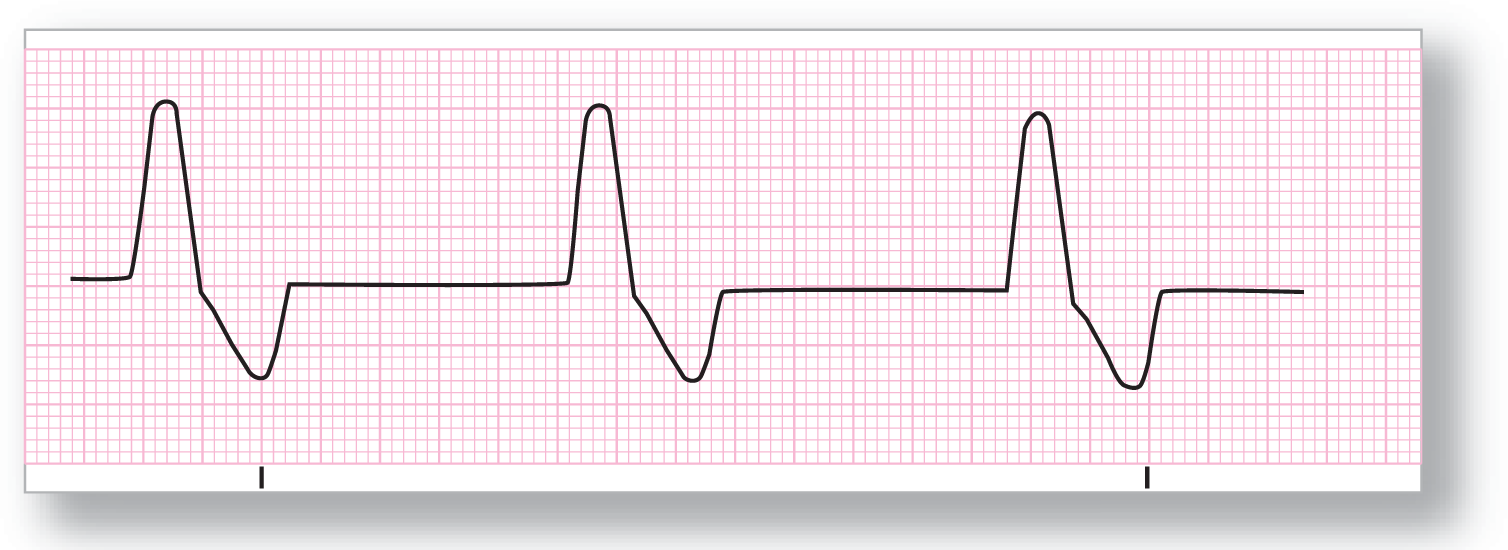
From Arrhythmia Recognition: The Art of Interpretation, courtesy of Tomas B. Garcia, MD.
|
Rate: 20–40 BPM |
PR interval: None |
|
Regularity: Regular |
QRS width: Wide (≥ 0.12 seconds), bizarre appearance |
|
P wave: None |
Grouping: None |
|
P:QRS ratio: None |
Dropped beats: None |
Putting it all together:
Idioventricular rhythm occurs when a ventricular focus acts as the primary pacemaker for the heart. The QRS complexes are wide and bizarre, reflecting their ventricular origin. This rhythm can be found by itself, or as a component of AV dissociation or third-degree heart block. (In these latter cases, there may be an underlying sinus rhythm with P waves present.)
CLINICAL PEARL
We usually try to stay away from treatment, but a word of caution: Do not treat this rhythm with antiarrhythmics! If you are successful in eliminating your last pacemaker, what do you have? Asystole.
Accelerated Idioventricular Rhythm

From Arrhythmia Recognition: The Art of Interpretation, courtesy of Tomas B. Garcia, MD.
|
Rate: 50–100 BPM |
PR interval: None |
|
Regularity: Regular |
QRS width: Wide (≥ 0.12 seconds), bizarre appearance |
|
P wave: None |
Grouping: None |
|
P:QRS ratio: None |
Dropped beats: None |
Putting it all together:
ECG 7-20 shows, basically, a faster version of an idioventricular rhythm. There are usually no P waves associated with it, in keeping with the ventricular source of the pacing. However, they can be present in AV dissociation or third-degree heart block.
Ventricular Tachycardia (VTach)
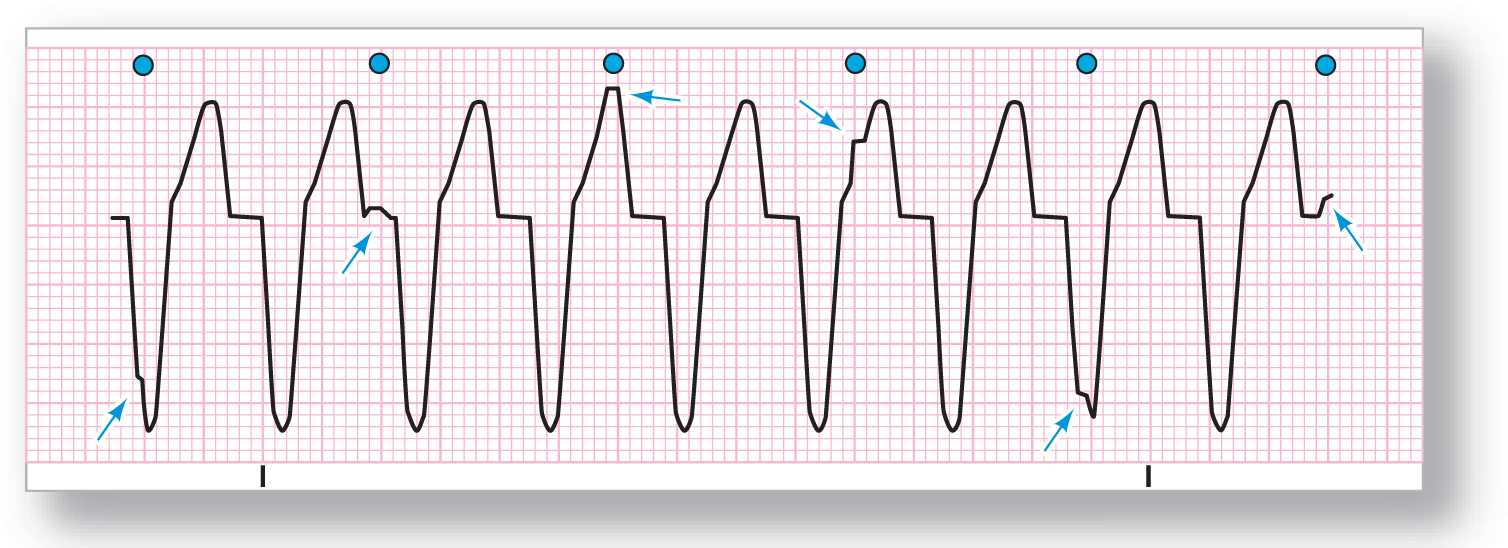
From Arrhythmia Recognition: The Art of Interpretation, courtesy of Tomas B. Garcia, MD.
Description|
Rate: 110–250 BPM |
PR interval: None |
|
Regularity: Regular |
QRS width: Wide, bizarre |
|
P wave: Dissociated atrial rate |
Grouping: None |
|
P:QRS ratio: Variable |
Dropped beats: None |
Putting it all together:
VTach is a very fast ventricular rate that is usually dissociated from an underlying atrial rate. In ECG 7-21, you will notice irregularities of the QRS morphologies at regular intervals. These irregularities are the underlying sinus beats. (Blue dots indicate sinus beats, and arrows pinpoint the irregularities.) There are many criteria related to VTach, which we’ll take a look at now.
Capture and Fusion Beats. Occasionally, a sinus beat will fall on a spot that allows some innervation of the ventricle to occur through the normal ventricular conduction system. This forms a fusion beat (ECG 7-22), which has a morphology somewhere between the abnormal ventricular beat and the normal QRS complex. This type of complex is literally caused by two pacemakers, the SA node and the ventricular pacer. Because two areas of the ventricle are being stimulated simultaneously, the result is a hybrid—or fusion—complex with some features of both. It may help to think of this in terms of the following analogy. If you mix a blue liquid with a yellow liquid, the result is a green liquid. A fusion beat is like the green liquid; it is the fusion of the two complexes.

ECG 7-22 Fusion and capture beats in VTach.
From Arrhythmia Recognition: The Art of Interpretation, courtesy of Tomas B. Garcia, MD.
DescriptionA capture beat, on the other hand, is completely innervated by the sinus beat and is indistinguishable from the patient’s normal complex. Why is it called a capture beat instead of a normal beat? Because it occurs in the middle of the chaos that is VTach, and is caused by chance timing of a sinus beat at just the right millisecond to “capture” or transmit through the AV node and depolarize the ventricles through the normal conduction system of the heart.
Fusion and capture beats are hallmarks of VTach; you will usually see them if the strip is long enough. If you see these types of complexes with a wide-complex, tachycardic rhythm, you have diagnosed VTach.
More VTach Indicators There are some additional signs we should look at. You don’t need to remember the names, but you should know about Brugada’s and Josephson’s signs (ECG 7-23). Brugada’s sign occurs during VTach. The interval from the R wave to the bottom of the S wave is ≥ 0.10 seconds. Josephson’s sign, which is just a small notching near the low point of the S wave, is another indicator of VTach.
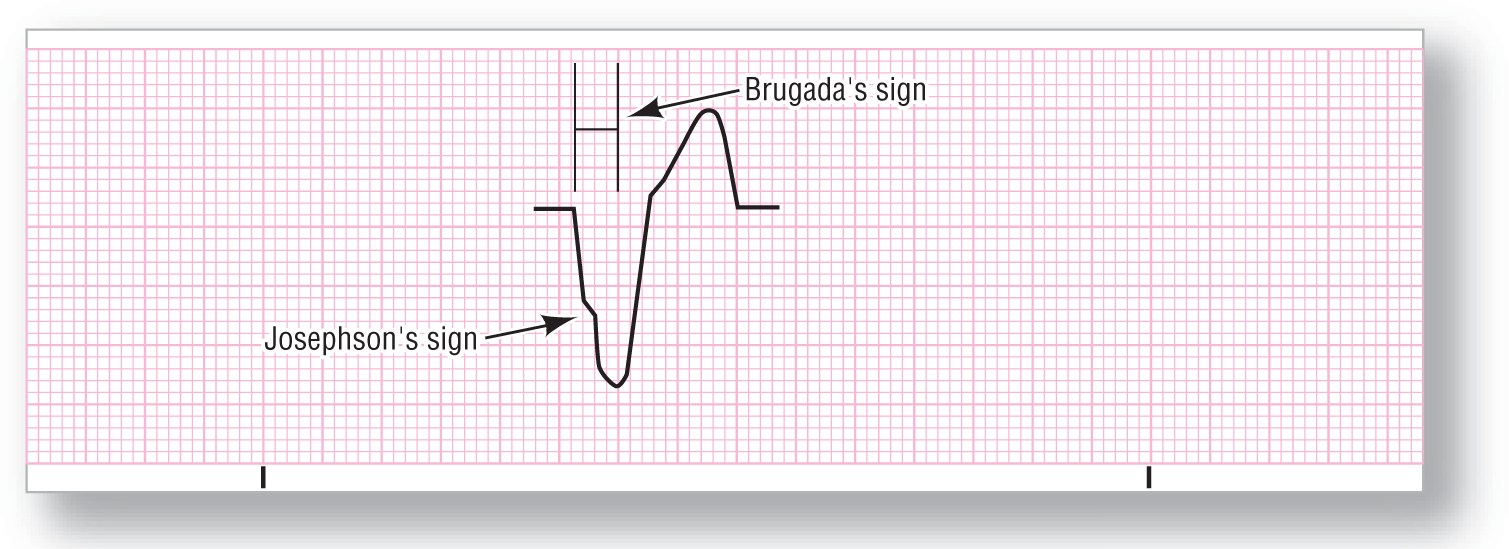
ECG 7-23 Brugada’s and Josephson’s signs in VTach.
From Arrhythmia Recognition: The Art of Interpretation, courtesy of Tomas B. Garcia, MD.
DescriptionSome additional aspects in VTach include a total QRS width of ≥ 0.16 seconds, and a complete negativity of all precordial leads (V1–V6). Why are we spending so much time on VTach? It is a life-threatening arrhythmia that is difficult to diagnose under the best of circumstances.
CLINICAL PEARL
A word to the wise: When confronted with any wide-complex tachycardia, treat it as VTach unless you have very strong evidence to the contrary. Do not assume it is a supraventricular tachycardia with aberrancy, a common error with potentially disastrous consequences.
REMINDER
Criteria for diagnosing VTach:
• Wide-complex tachycardia
• AV dissociation
• Fusion and capture beats
• Complexes in all of the precordial leads are negative
• Duration of the QRS complex is often ≥ 0.16 seconds
• Josephson’s and Brugada’s signs
Torsade de Pointes
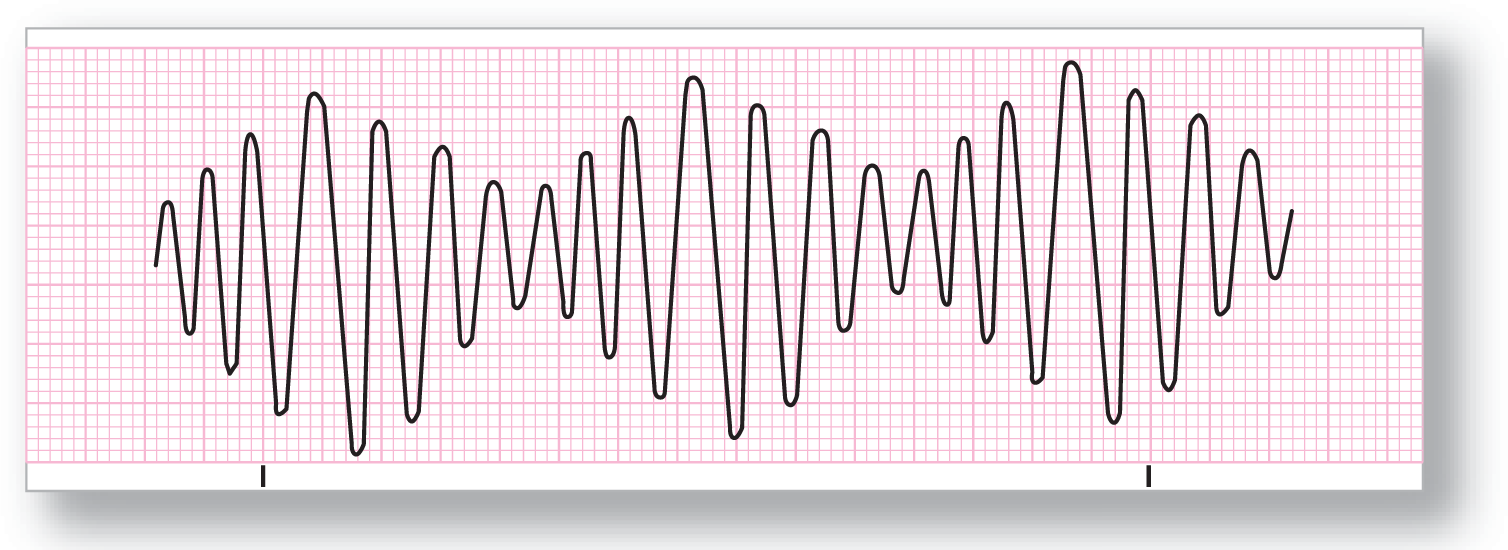
From Arrhythmia Recognition: The Art of Interpretation, courtesy of Tomas B. Garcia, MD.
|
Rate: 200–250 BPM |
PR interval: None |
|
Regularity: Irregular |
QRS width: Variable |
|
P wave: None |
Grouping: Variable sinusoidal pattern |
|
P:QRS ratio: None |
Dropped beats: None |
Putting it all together:
Torsade de pointes occurs with an underlying prolonged QT interval. It has an undulating, sinusoidal appearance in which the axis of the QRS complexes changes from positive to negative and back in a haphazard fashion. (The name, torsade de pointes, means twisting of points.) It can convert into either a normal rhythm or ventricular fibrillation. Be very careful with this rhythm, as it is a harbinger of death!
Ventricular Flutter
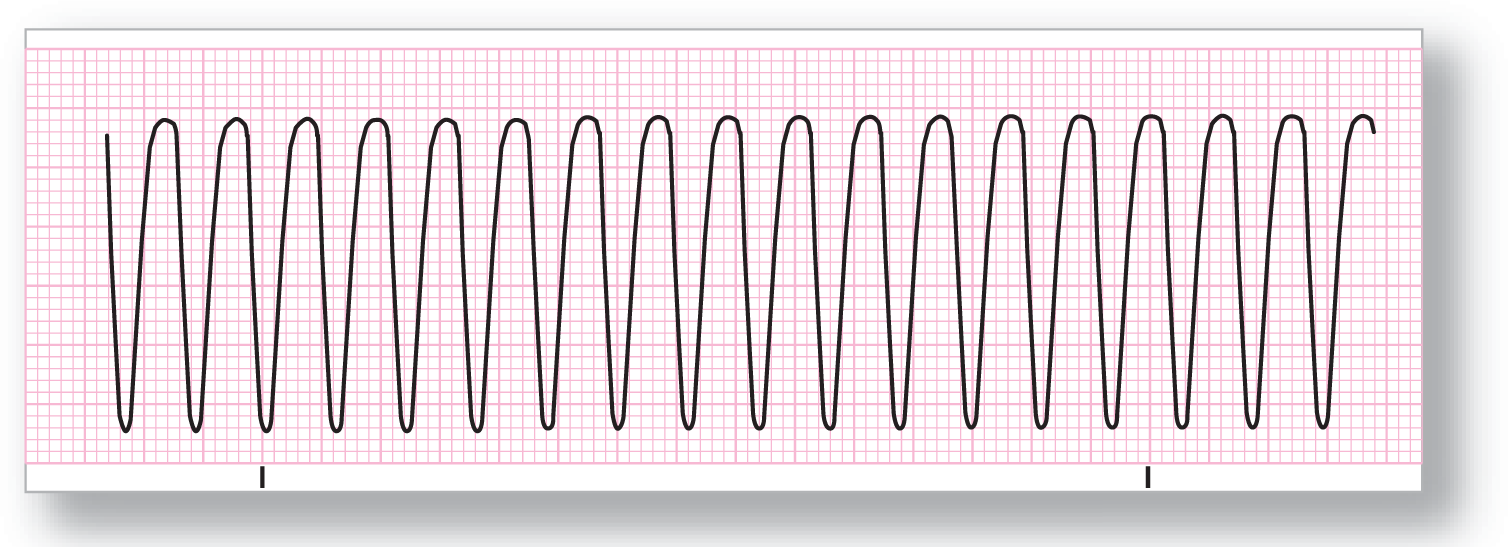
From Arrhythmia Recognition: The Art of Interpretation, courtesy of Tomas B. Garcia, MD.
|
Rate: 150–300 BPM |
PR interval: None |
|
Regularity: Regular |
QRS width: Wide, bizarre |
|
P wave: None |
Grouping: None |
|
P:QRS ratio: None |
Dropped beats: None |
Putting it all together:
Ventricular flutter is very fast VTach. When you can no longer tell if it is a QRS complex, a T wave, or an ST segment, you have ventricular flutter. The beats are coming so fast that they fuse into an almost straight sinusoidal pattern with no discernible components.
CLINICAL PEARL
When you see ventricular flutter at a rate of 300 BPM, you should think about the possibility of Wolf-Parkinson-White syndrome with 1:1 conduction of an atrial flutter. (We know this may not mean much now, but it will later on.)
Ventricular Fibrillation
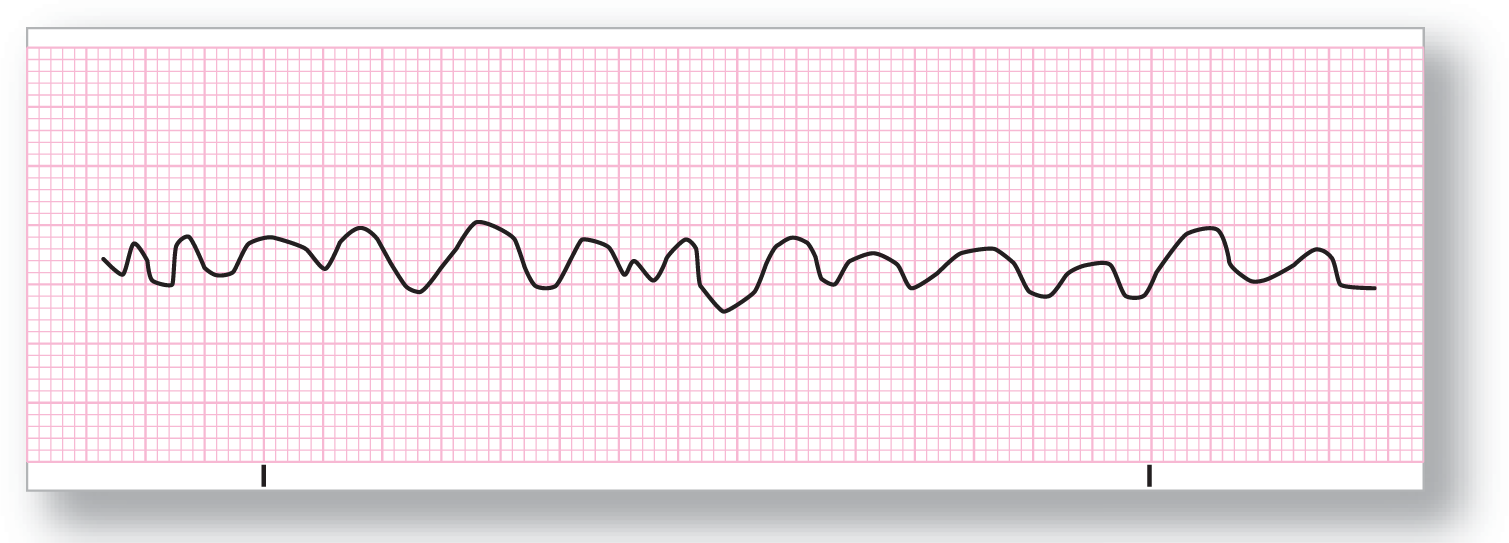
From Arrhythmia Recognition: The Art of Interpretation, courtesy of Tomas B. Garcia, MD.
|
Rate: Indeterminate |
PR interval: None |
|
Regularity: Chaotic rhythm |
QRS width: None |
|
P wave: None |
Grouping: None |
|
P:QRS ratio: None |
Dropped beats: No beats at all! |
Putting it all together:
If you were going to draw a picture of cardiac chaos, this would be it. The ventricular pacers are all going haywire and firing at their own pace. The result is many small areas of the heart firing at once with no organized activity.
CLINICAL PEARL
If your patient looks fine and is wide awake and looking at you, a lead has fallen off and this is an artifact, not ventricular fibrillation.
First-Degree Heart Block
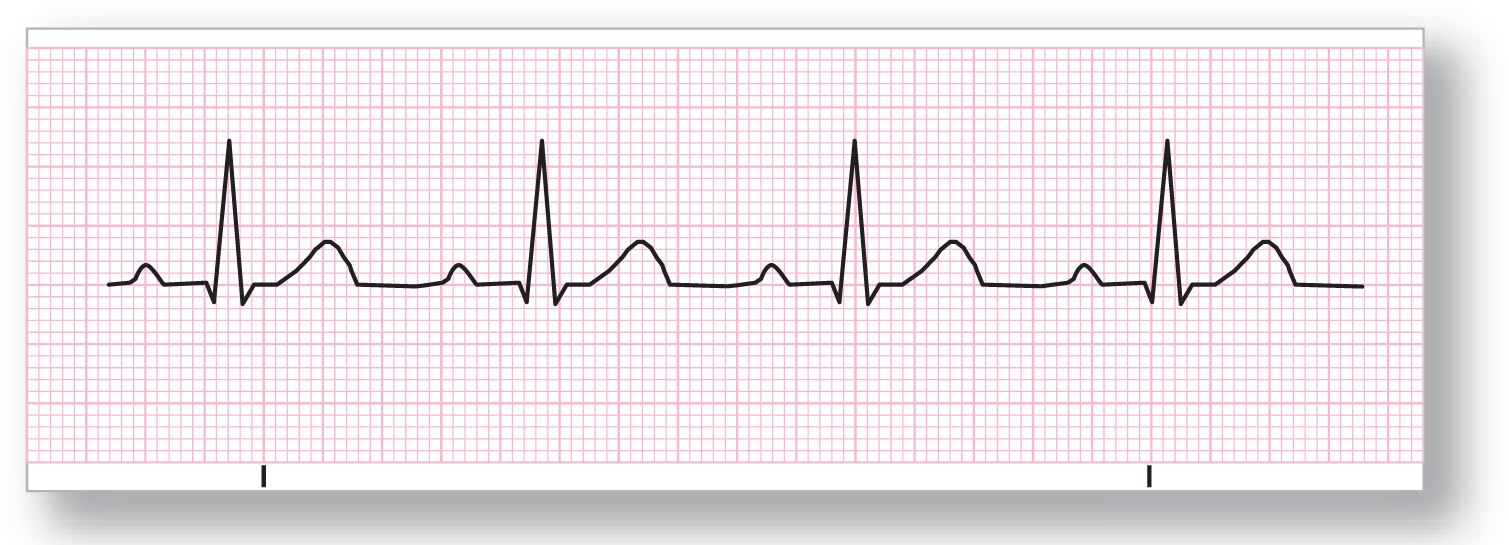
From Arrhythmia Recognition: The Art of Interpretation, courtesy of Tomas B. Garcia, MD.
|
Rate: Depends on underlying rhythm |
PR interval: Prolonged > 0.20 seconds |
|
Regularity: Regular |
QRS width: Normal |
|
P wave: Normal |
Grouping: None |
|
P:QRS ratio: 1:1 |
Dropped beats: None |
Putting it all together:
First-degree heart block results from a prolonged physiologic block in the AV node. This can occur because of medication, vagal stimulation, and disease, among others. The PR interval will be greater than 0.20 seconds.
NOTE
A word of caution about the nomenclature of blocks: The rhythm disturbances we are looking at here are AV nodal blocks. There are also bundle branch blocks, a very different phenomenon.
Mobitz I Second-Degree Heart Block (Wenckebach)

From Arrhythmia Recognition: The Art of Interpretation, courtesy of Tomas B. Garcia, MD.
Description|
Rate: Depends on underlying rhythm |
PR interval: Variable |
|
Regularity: Regularly irregular |
QRS width: Normal |
|
P wave: Present |
Grouping: Present and variable (see blue shading in ECG 7-28) |
|
P:QRS ratio: Variable: 2:1, 3:2, 4:3, 5:4, etc. |
Dropped beats: Yes |
Putting it all together:
Mobitz I is also known as Wenckebach (pronounced WENN-key-bock). It is caused by a diseased AV node with a long refractory period. The result is that the PR interval lengthens between successive beats until a beat is dropped. At that point, the cycle starts again. The R-R interval, on the other hand, shortens with each beat.
Mobitz II Second-Degree Heart Block
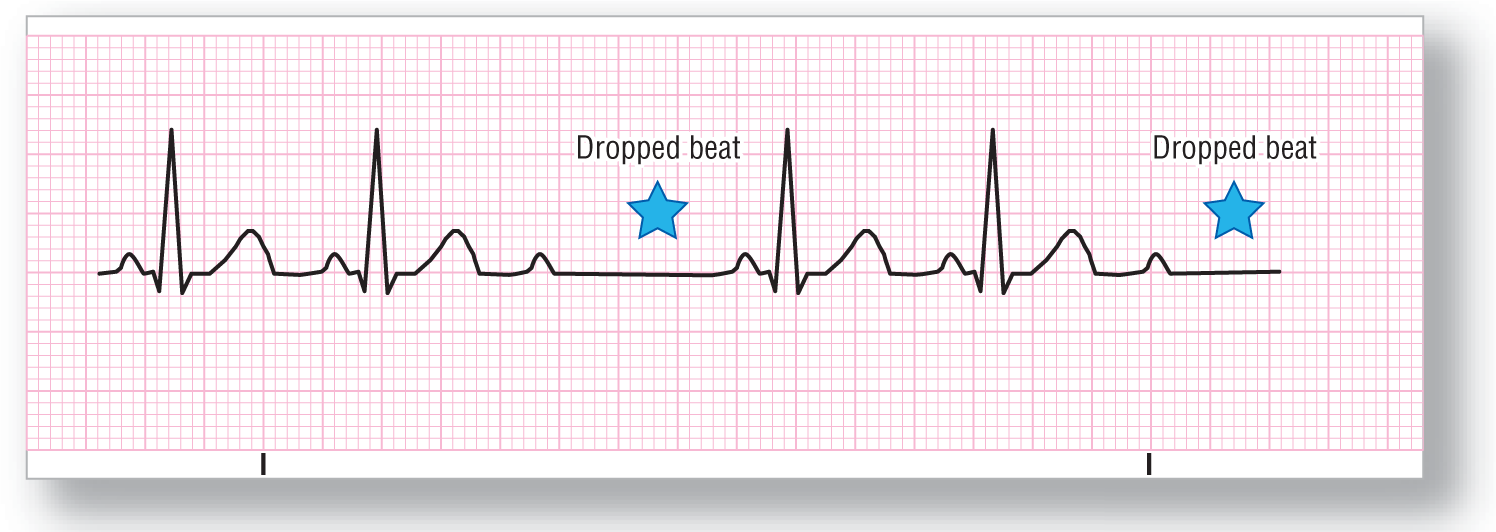
From Arrhythmia Recognition: The Art of Interpretation, courtesy of Tomas B. Garcia, MD.
|
Rate: Depends on underlying rhythm |
PR interval: Normal |
|
Regularity: Regularly irregular |
QRS width: Normal |
|
P wave: Normal |
Grouping: Present and variable |
|
P:QRS ratio: X:X–1; e.g., 3:2, 4:3, 5:4, etc. The ratio can also be variable on rare occasions. |
Dropped beats: Yes |
Putting it all together:
In Mobitz II, there are grouped beats with one beat dropped between each group. The key point to remember is that the PR interval is the same in all of the conducted beats. This rhythm is caused by a diseased AV node, and it is a harbinger of bad things to come—namely, complete heart block.
CLINICAL PEARL
What if there is a 2:1 ratio of Ps to QRSs? Is this Mobitz I or Mobitz II? In reality, you can’t tell. This example is named a 2:1 second-degree block (no type is specified). Because you can’t tell, assume the worst—Mobitz II. You cannot go wrong by being overly cautious with a patient’s life.
Third-Degree Heart Block

From Arrhythmia Recognition: The Art of Interpretation, courtesy of Tomas B. Garcia, MD.
Description|
Rate: Separate rates for the underlying (sinus) rhythm and the escape rhythm. They are dissociated from one another. |
PR interval: Variable; no pattern |
|
Regularity: Regular, but P rate and QRS rate are different |
QRS width: Normal or wide |
|
P wave: Present |
Grouping: None |
|
P:QRS ratio: Variable |
Dropped beats: None |
Putting it all together:
ECG 7-30 shows a complete block of the AV node; the atria and ventricles are firing separately—each to its own drummer, so to speak. The sinus rhythm can be bradycardic, normal, or tachycardic. The escape beat can be junctional or ventricular, so the morphology will vary.
NOTE
Semantics alert: If there are just as many P waves as there are QRSs, but they are dissociated, it is known as AV dissociation rather than third-degree heart block.