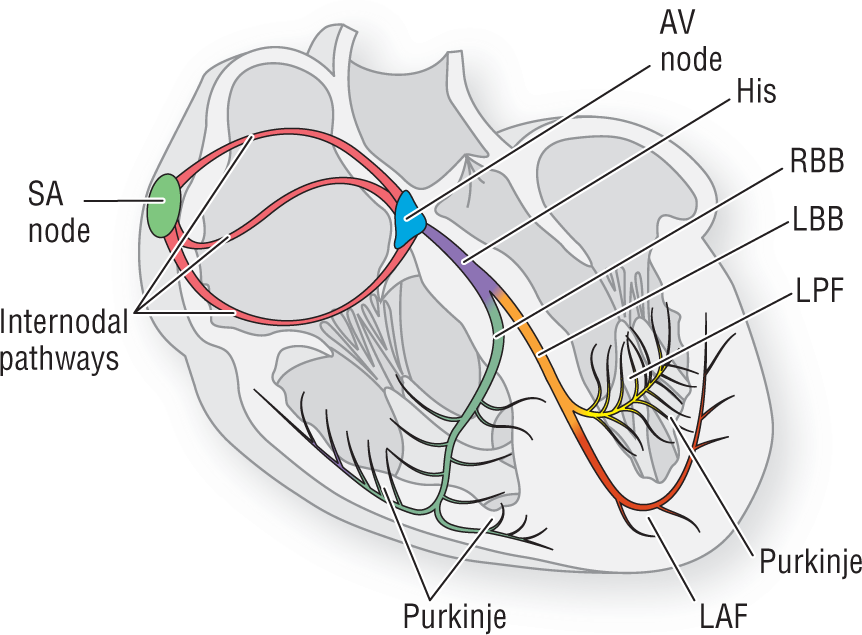
Figure 8-3 The electrical conduction system.
© Jones & Bartlett Learning.
DescriptionWe begin to look at NSR by seeing how the traditional electrocardiographic pattern is created. In the figures, depolarization is depicted as a spreading red wave. The process of repolarization is represented as a spreading blue wave. While reviewing this section, keep in mind that this is a continuous process. There is no actual period of rest or inactivity and the cycle repeats over and over again because of the automaticity of the SA node. Figure 8-3 provides a review of the electrical conduction system.

Figure 8-3 The electrical conduction system.
© Jones & Bartlett Learning.
DescriptionThe rate in NSR ranges from 60 to 100 BPM. Remember, by convention, any rhythms with rates below 60 BPM are considered bradycardias and any rhythms with rates at or above 100 BPM are considered tachycardias.
Cycle 1 (Figure 8-4A): The baseline is a period when the majority of the cardiac muscle is at rest. The SA node, however, is going through the process of automaticity and slowly depolarizing until the threshold potential is reached and the cells fire to start a new cardiac cycle.
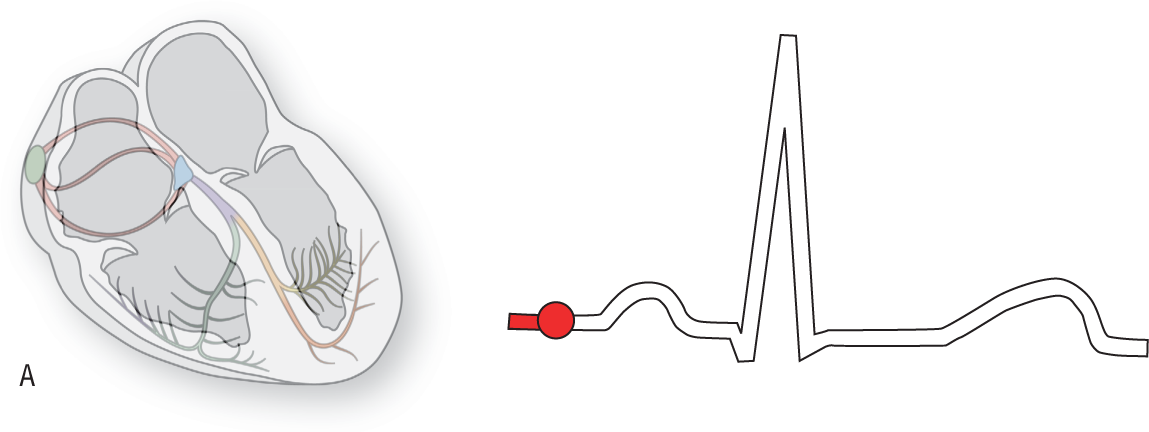
Figure 8-4A The baseline period.
© Jones & Bartlett Learning.
Cycle 2 (Figure 8-4B): At this point, the SA node is firing. The spread is being transmitted through the inter-nodal pathways on its way to the atrioventricular (AV) node. This period is electrocardiographically neutral because there are not enough depolarized myocytes to create a measurable vector.
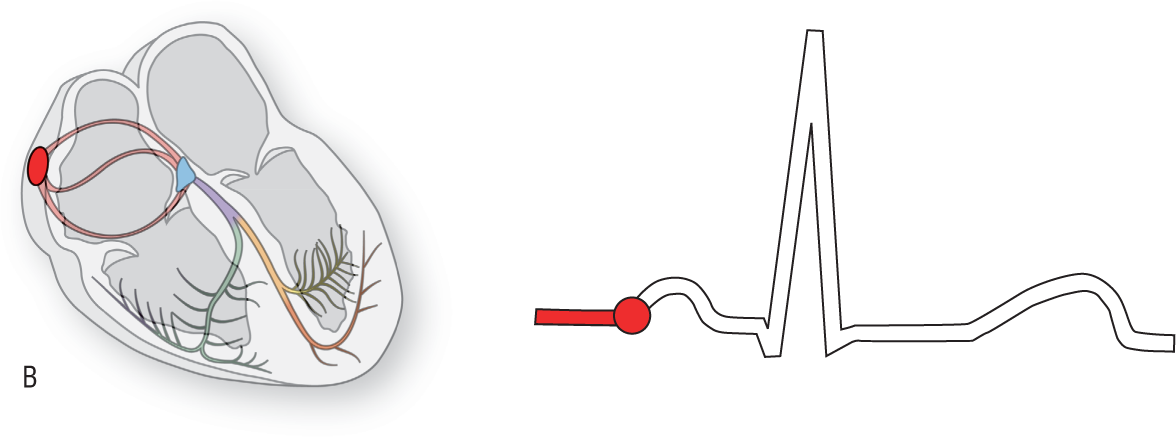
Figure 8-4B The SA node fires.
© Jones & Bartlett Learning.
Cycle 3 (Figure 8-4C): The right atrium has now depolarized. This gives rise to a vector that heads to the right, slightly anteriorly, and down (yellow vector). In addition, many other things are occurring (see Additional Information box on the next page). The AV node is performing its main function by causing the physiologic block.
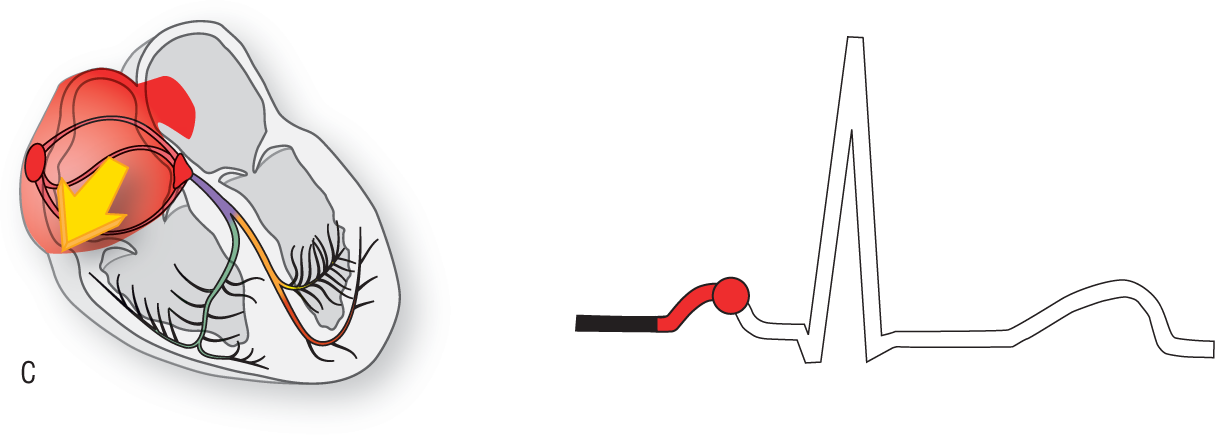
Figure 8-4C The right atrium depolarizes.
© Jones & Bartlett Learning.
DescriptionCycle 4 (Figure 8-4D): Both atria have depolarized completely. The SA node and the surrounding area have begun to repolarize. The left atrial vector is directed to the left, inferiorly, and slightly backwards (blue vector).
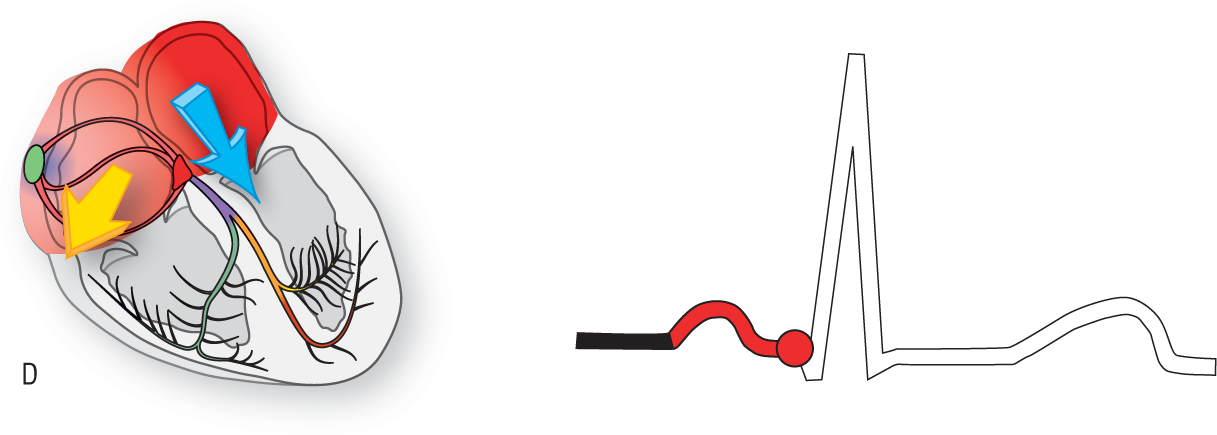
Figure 8-4D The left atrium depolarizes.
© Jones & Bartlett Learning.
DescriptionCycle 5 (Figure 8-4E): At this point, depolarization of the left atrium is almost complete and repolarization of the right atrium is fairly well along.

Figure 8-4E Depolarization is almost complete.
© Jones & Bartlett Learning.
Additional Information
Normal Sinus Rhythm
By definition, the SA node is always the primary pacemaker for the heart in NSR. Since there is only one pacemaker, the P waves need to be identical. In addition, since the distance and route taken to reach the AV node are the same, the PR intervals have to be both normal and consistent.
Since the impulse always starts at the SA node and spreads downward to depolarize the atria, the atrial vectors must always point inferiorly in NSR. In Figure 8-5, both the right atrial (yellow) vector and the left atrial (blue) vectors are heading inferiorly, directly toward leads II, III, and aVF of the hexaxial system. Positive vectors heading toward an electrode always give rise to positive waves on an ECG. This means that, electrocardiographically, the P wave must always be upright in leads II, III, and aVF during NSR. If the P waves are negative in leads II, III, and aVF, the rhythm cannot be NSR and there has to be an ectopic pacemaker (most commonly an ectopic atrial or a junctional pacemaker).
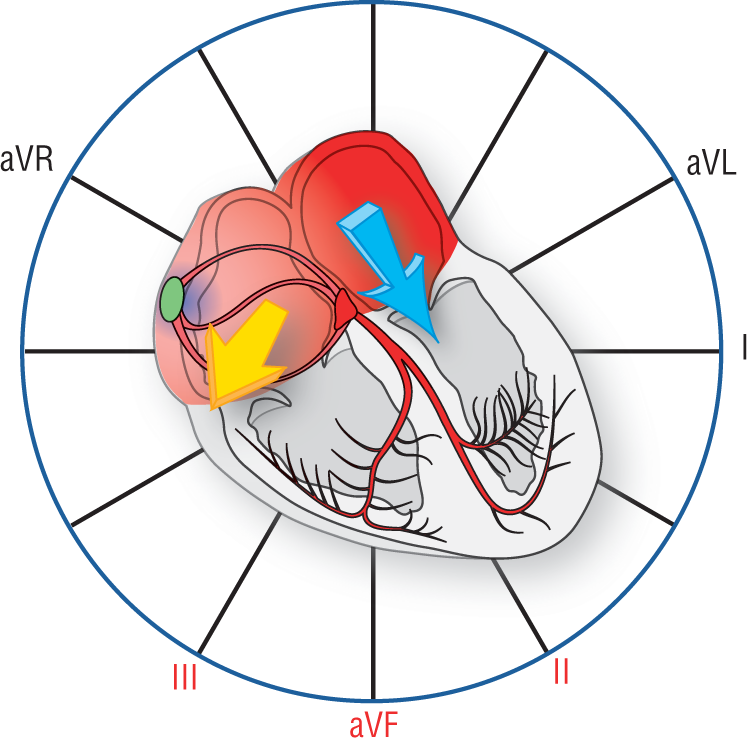
Figure 8-5 In normal sinus rhythm, the atrial vectors point inferiorly.
© Jones & Bartlett Learning.
DescriptionThe PR interval represents a very busy time in the cardiac cycle. The atria, the AV node, the bundle of His, both bundle branches, and the Purkinje system are all depolarizing and conducting the impulse (Figure 8-6). In addition, the AV node is performing its main function by causing a transient slowing of the impulse called the physiologic block. This slowing of the impulse is critical to coordinate the mechanical contraction of the atria in order to maximize ventricular filling. Without the block, the atria and ventricles would contract simultaneously.
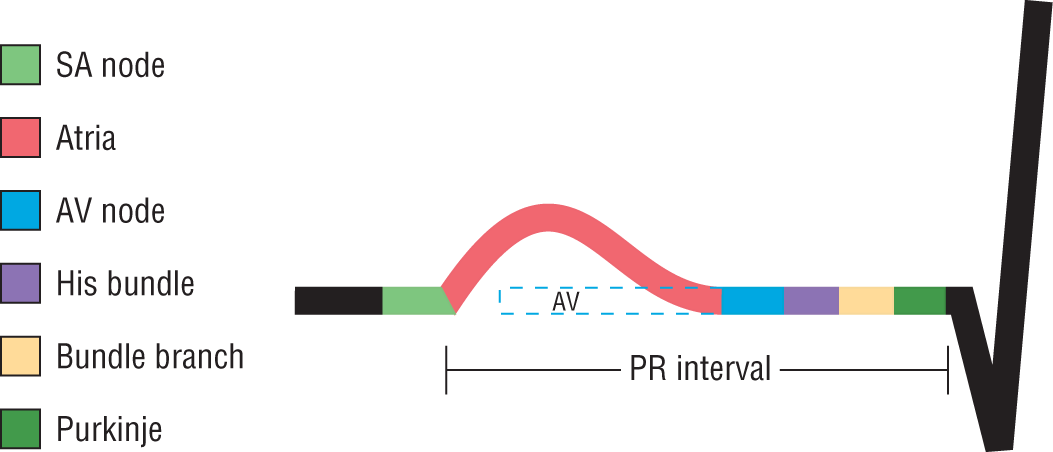
Figure 8-6 The PR interval.
© Jones & Bartlett Learning.
DescriptionThe PR interval is considered normal if it is between 0.12 seconds to 0.20 seconds in length. It is shortened if it is less than or equal to 0.11 seconds and prolonged if it is greater than or equal to 0.21 seconds. Some authors consider 0.20 seconds to be borderline prolonged.
Cycle 6 (Figure 8-4F): Repolarization has begun throughout most of the atria. The physiologic block is almost completed and the impulse is about to continue on to the ventricles.
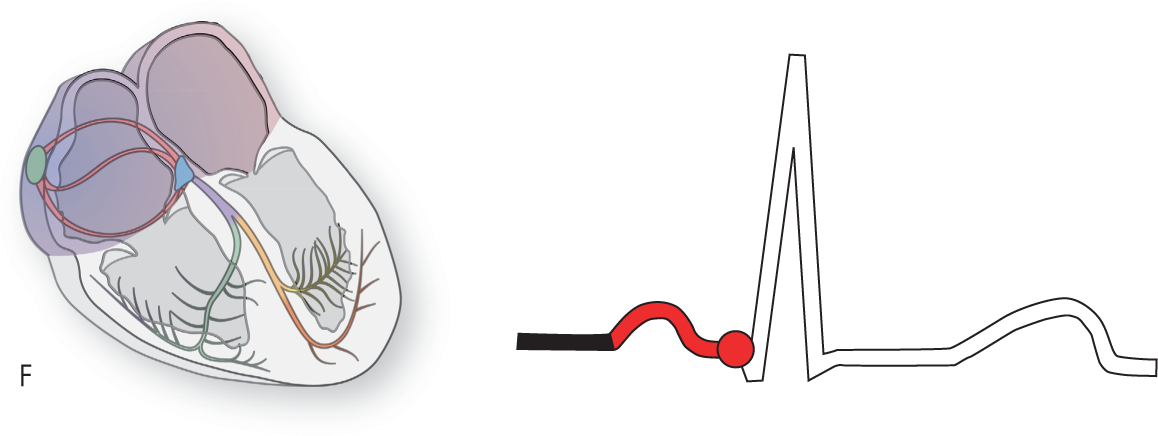
Figure 8-4F Repolarization has begun throughout most of the atria.
© Jones & Bartlett Learning.
Cycle 7 (Figure 8-4G): The physiologic block is completed and the impulse is proceeding through the bundle of His, the right and left bundles, the fascicles, and the Purkinje network. The impulse will be carried throughout most of the endocardium. Impulse spread will progress from endocardial surface to epicardial surface.
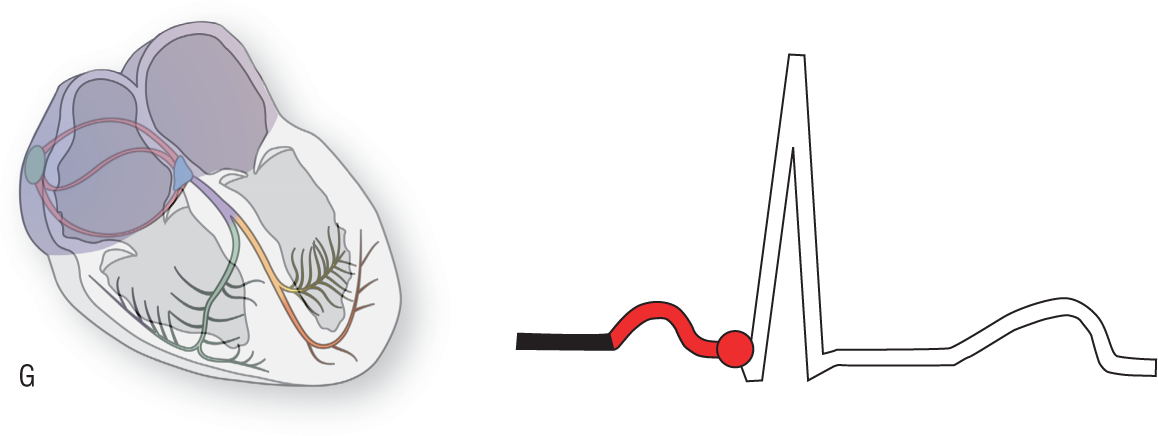
Figure 8-4G The impulse is proceeding through the bundle of His, right and left bundles, and the Purkinje network.
© Jones & Bartlett Learning.
Cycle 8 (Figure 8-4H): The very first area of the ventricles to depolarize is the upper septal area. It depolarizes from left to right giving rise to a small vector (pink vector) that is represented electrocardiographically as the septal Q waves.
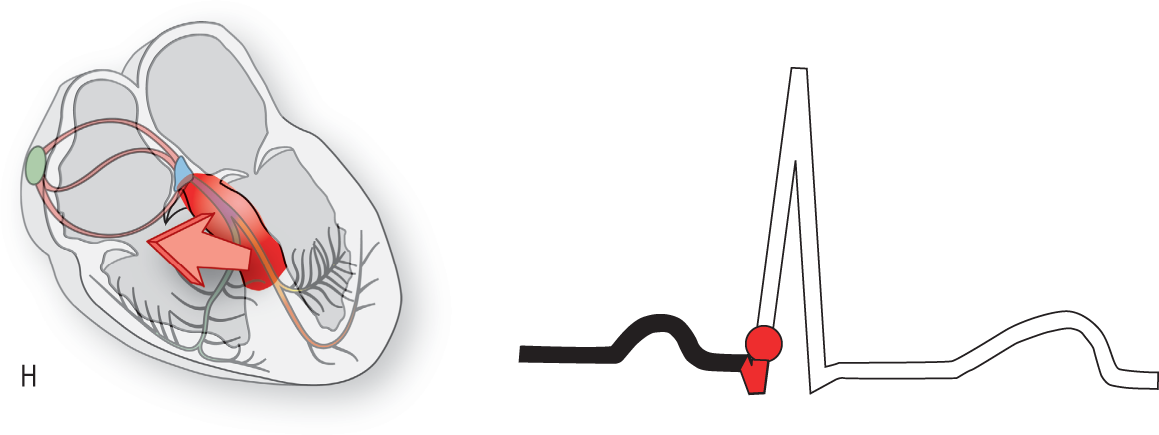
Figure 8-4H The upper septal area of the ventricles starts to depolarize.
© Jones & Bartlett Learning.
DescriptionCycle 9 (Figure 8-4I): The depolarization of the main portion of the left ventricle gives rise to a large vector (yellow vector) that is directed inferiorly, posteriorly, and backward. It gives rise to the large R wave depicted in this example.
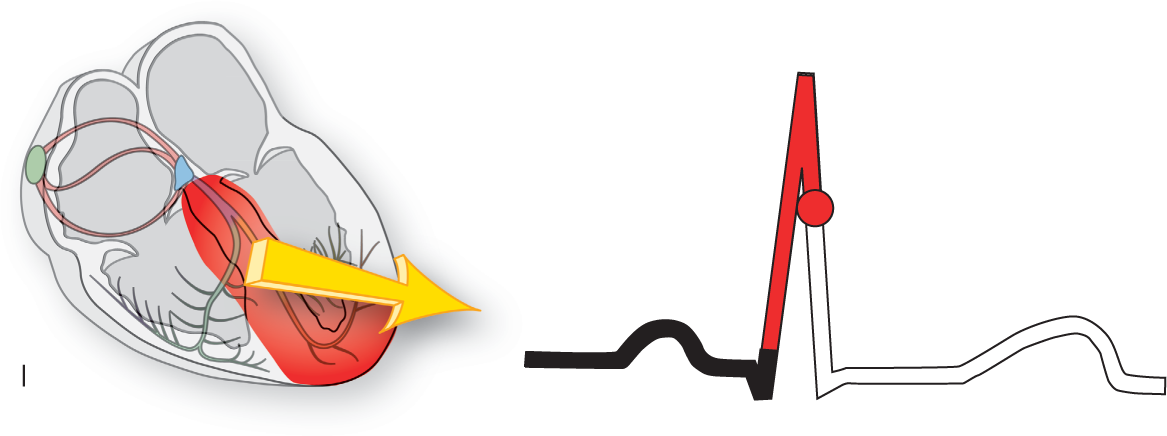
Figure 8-4I Depolarization of the main portion of the left ventricle gives rise to a large R wave.
© Jones & Bartlett Learning.
DescriptionCycle 10 (Figure 8-4J): The last part of the left ventricle to depolarize is the upper, posterior part on the left. The positive depolarization wave going in that direction gives rise to a vector (blue vector) that is electrocardiographically represented as the S wave or terminal portion of the QRS complex.

Figure 8-4J The last portion of depolarization gives rise to an S wave.
© Jones & Bartlett Learning.
DescriptionCycle 11 (Figure 8-4K): At this point, both ventricles have depolarized. The QRS complex is complete. Since the depolarization of the ventricles occurred using the normal electrical conduction system, the QRS complex should be normal in duration. The normal QRS interval is within 0.06 and 0.11 seconds inclusive.
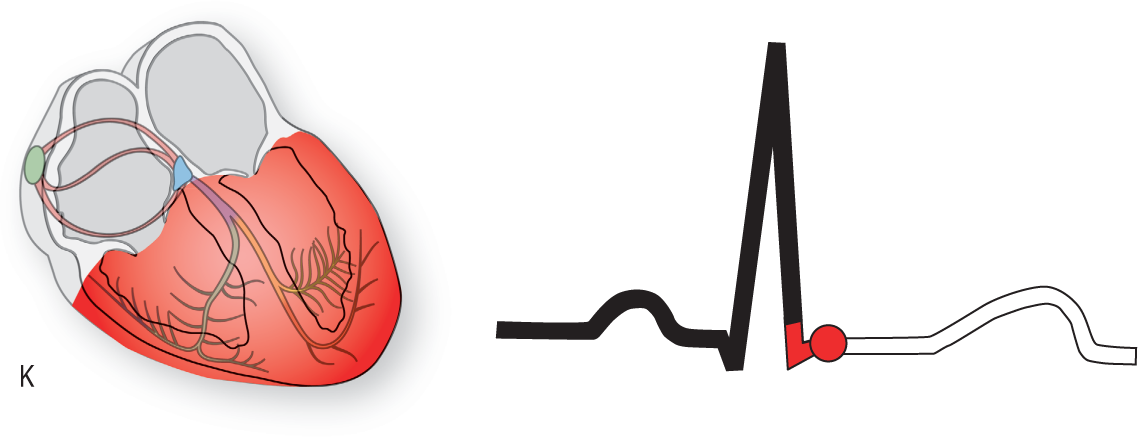
Figure 8-4K Both ventricles have depolarized and the QRS complex is complete.
© Jones & Bartlett Learning.
Cycle 12 (Figure 8-4L): This period represents a time when the ventricles are completing depolarization and are beginning to repolarize. The repolarization of the ventricles gives rise to the T wave. (See Additional Information box.)
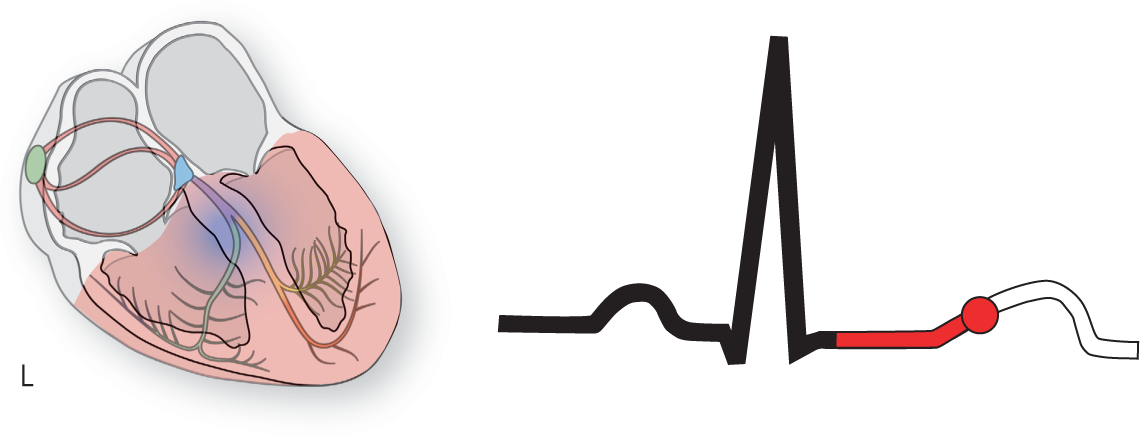
Figure 8-4L The ventricles are completing depolarization and beginning to repolarize, giving rise to a T wave.
© Jones & Bartlett Learning.
Additional Information
Absolute Refractory Period
The early part of the T wave represents a period known as the absolute refractory period. If you notice on the graphic of the heart in cycle 12 and Figure 8-4L, most of the ventricle is still somewhat depolarized (represented by the pink areas). These areas would be refractory to any new impulses. In other words, since they are still depolarized (more positive), they would not be able to fire or conduct any new impulses. To use an analogy, let’s think of a cannon. A loaded cannon can easily be fired by pulling the trigger. However, if you quickly pull the trigger again before the cannon has been adequately reloaded, it won’t fire the second time even though the trigger was pulled.
Only some small isolated areas show complete repolarization (represented by the blue areas in the previous figures and blue cells in Figure 8-7) and would be available for another impulse. As more cells are repolarized, this can create a problem; as we shall see in the next Additional Information box.
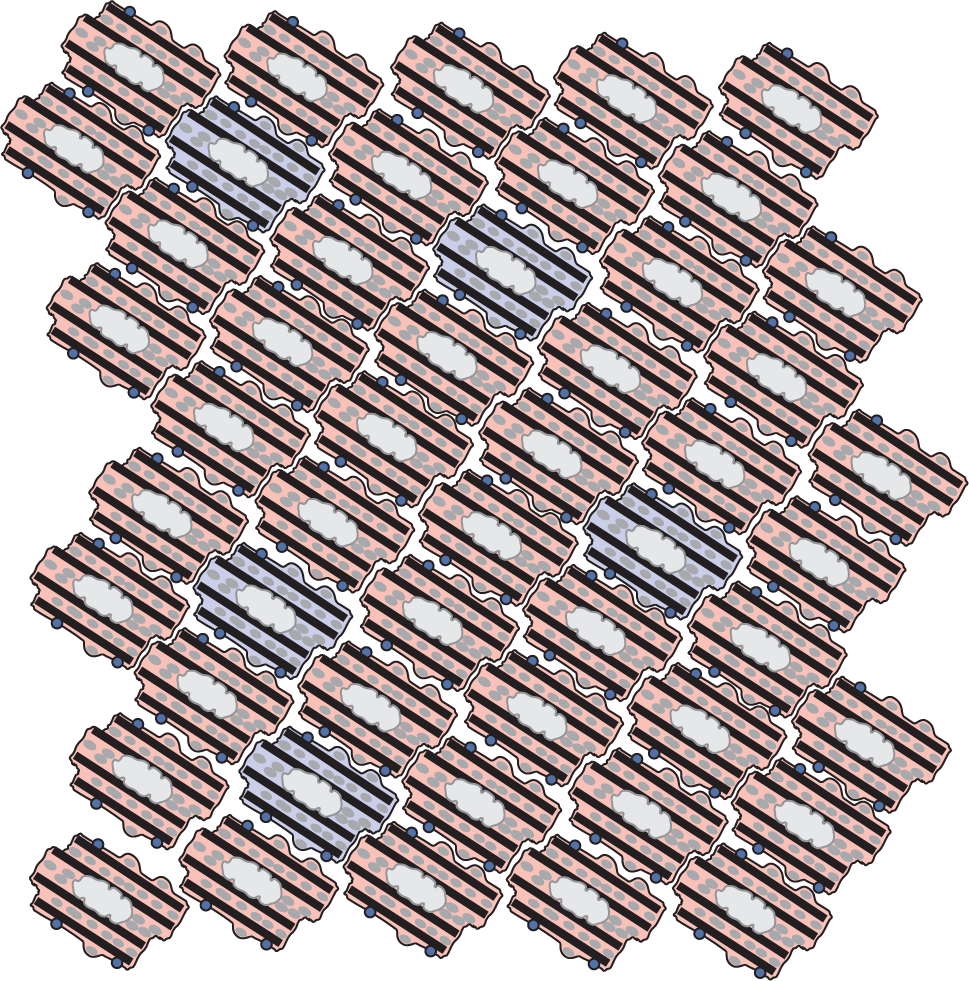
Figure 8-7 Only some cells are completely repolarized and ready for another impulse.
© Jones & Bartlett Learning.
Cycle 13 (Figure 8-4M): The T wave is now well on its way electrocardiographically. This late part of the T wave, along the downward slope (see blue area), represents a period known as the relative refractory period. (See the Additional Information box on the next page.)
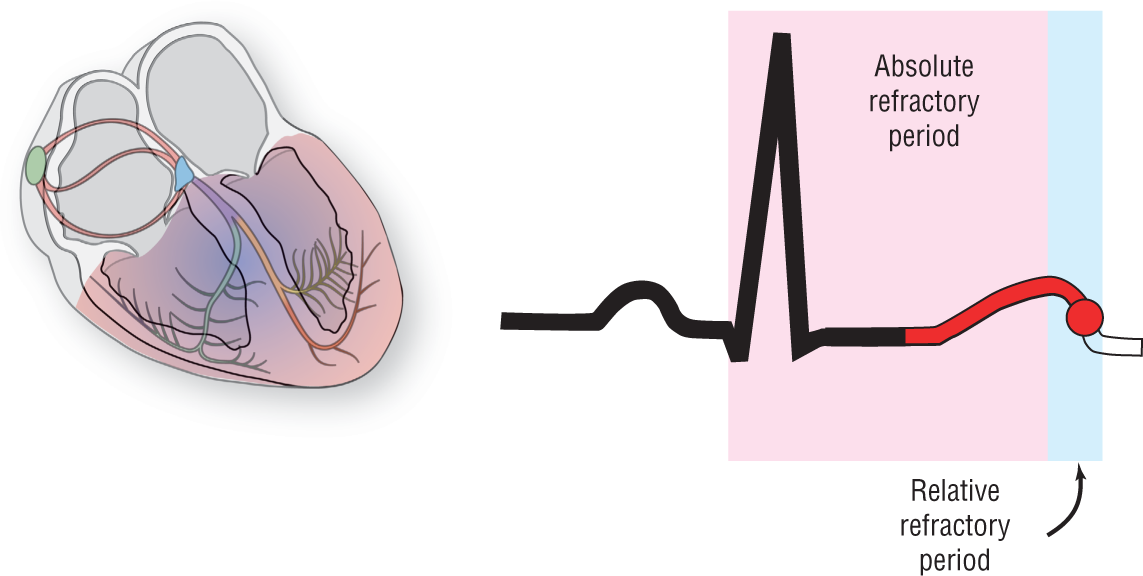
Figure 8-4M The late part of the T wave represents the relative refractory period.
© Jones & Bartlett Learning.
DescriptionCycle 14 (Figure 8-4N): This is the final phase. The heart is relaxing at this point. However, automaticity of all of the cells continues. Remember, in NSR the SA node will win the automaticity rate as it is the principal, and fastest, pacemaker for the heart. If the heart is functioning normally, this process will repeat over and over continuously.
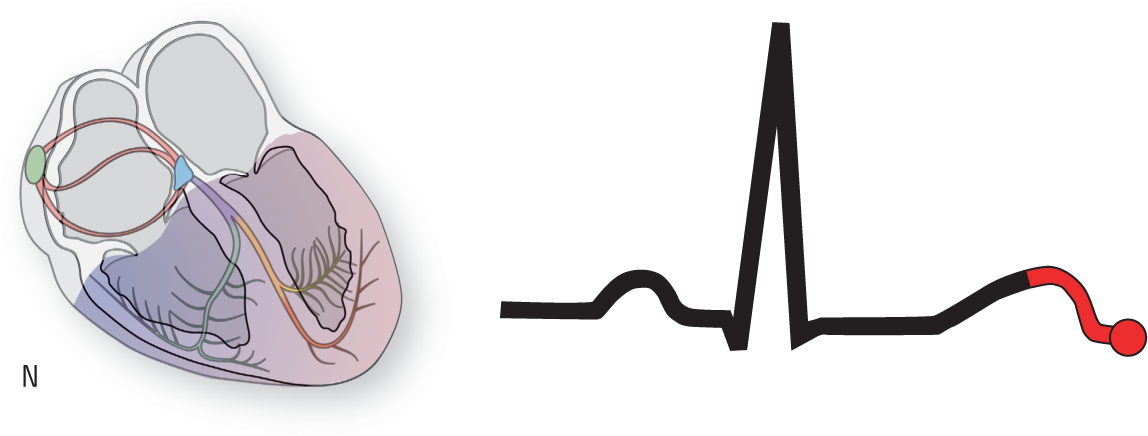
Figure 8-4N The final phase. In this phase, the heart is relaxing.
© Jones & Bartlett Learning.
Additional Information
Relative Refractory Period
During the relative refractory period many more cells are repolarized and ready to receive an impulse than during the absolute refractory period. As a result, transmission of impulses can occur, but often by very circuitous routes. Occasionally, a circular pathway is set up like the one in Figure 8-8. In this case, the impulse started out as a premature ventricular complex (PVC) at the pacemaker cell labeled with the red star. Then, slowly, by direct cell-to-cell transmission, the impulse made its way around a segment of the heart. The transmission was so slow that by the time the impulse reached the original pacemaking area, that area was again repolarized. That means it was ready to receive a transmission again. This type of circus movement can cause serious arrhythmogenic consequences and is a setup for ventricular tachycardia. We will spend a great deal more time on this later. This is just a short introduction to the topic of the absolute and relative refractory periods of the T wave.
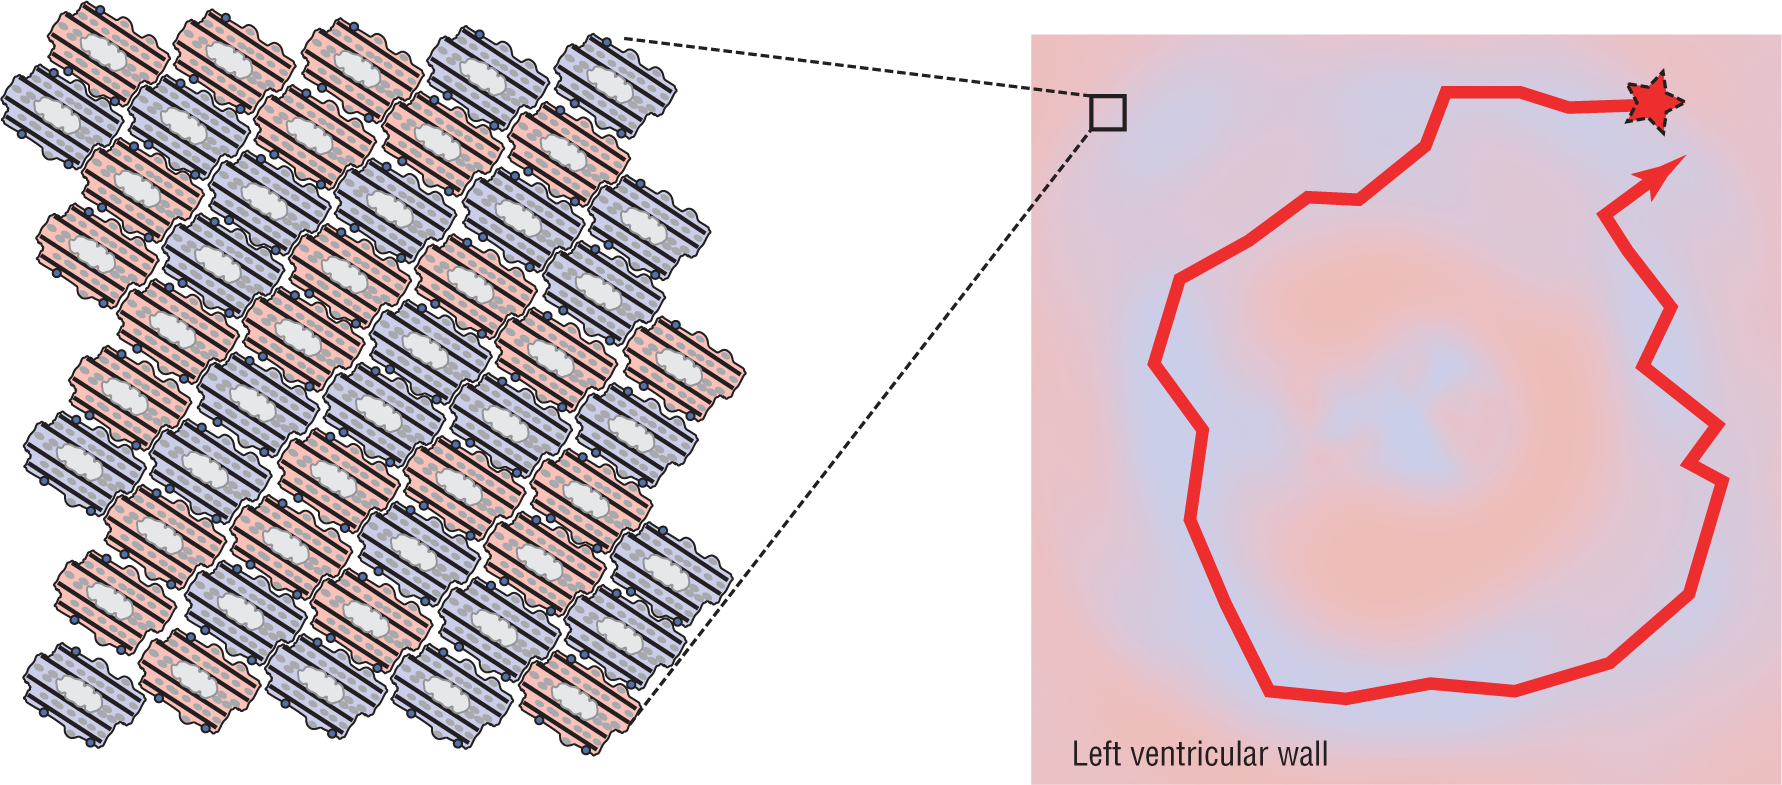
Figure 8-8 When an impulse starts out as a premature ventricular complex at the pacemaker cell, the transmission can be so slow that by the time the impulse reaches the original pacemaking area, the area is again repolarized.
© Jones & Bartlett Learning.