Figure 10-1 The sinus spectrum.
© Jones & Bartlett Learning.
DescriptionSinus tachycardia refers to a rhythm that originates in the SA node and has a rate faster than 100 BPM. In Figure 10-1 we see that it lies on the right or faster end of the sinus spectrum. In most cases, sinus tachycardia has a rate greater than 100 and ranging up to 160 BPM, but rates as high as 220 BPM can be seen. At higher rates, the diagnosis of sinus tachycardia becomes increasingly difficult, and it can be confused with some of the other supraventricular tachycardias. We will discuss the differential diagnosis of narrow complex tachycardias in great detail in Chapter 27, Narrow-Complex Supraventricular Tachycardia.

Figure 10-1 The sinus spectrum.
© Jones & Bartlett Learning.
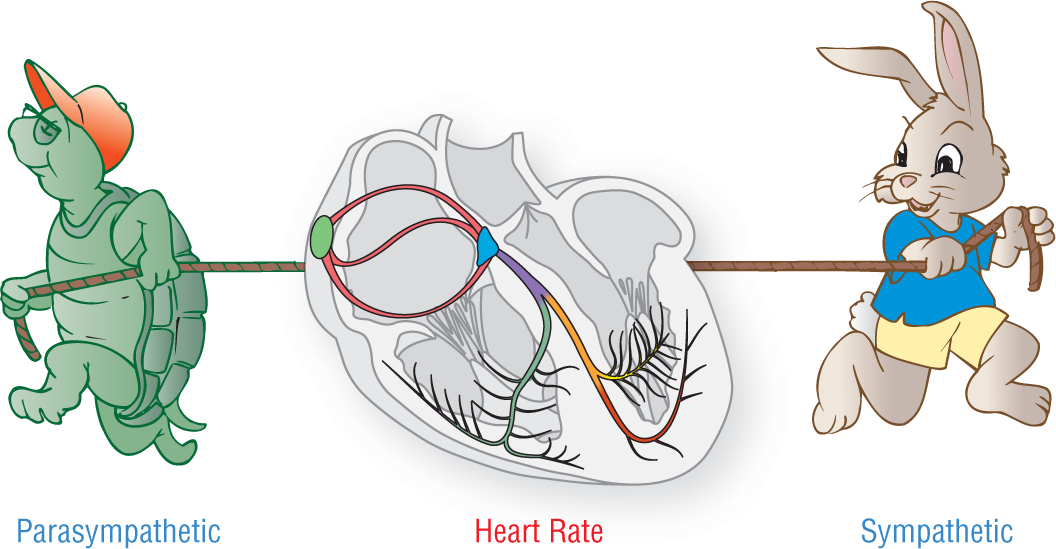
DescriptionFor any given patient, the heart rate is determined by a constant tug-of-war between the sympathetic and the parasympathetic divisions of the autonomic nervous system (Figure 10-2). If the parasympathetic dominates, the rhythm is slowed. If the sympathetic dominates, the rhythm is sped up. The effects of the sympathetic stimulation can go beyond the rate; it can sometimes cause minor morphologic differences in the appearance of the QRS complex. It can be difficult to distinguish pathologic presentations from tachycardia-related changes.

Figure 10-2 The sympathetic and parasympathetic nervous systems create a tug-of-war on the heart rate.
© Jones & Bartlett Learning.
Morphologically, sinus tachycardia has all of the characteristics of normal sinus rhythm (NSR) except for the heart rate and the acceptable widths of the QRS complex (complexes wider than 0.12 seconds are acceptable in sinus tachycardia.). Sympathetic stimulation does cause certain changes in the appearance of the cardiac complexes electrocardiographically, as mentioned above. Sympathetic stimulation alters the rate of conduction through most tissue by increasing transit times of the cardiac impulse. The P-wave amplitude is usually affected one way or the other by this increased transit time. Usually, the amplitude of the P waves is decreased; however, in some cases, the amplitude of the P waves may actually be increased.
Sympathetic discharge also causes faster transit times through the AV node. These faster rates shorten the length of the PR interval considerably. The interval, however, should still be between 0.12 and 0.20 seconds to be considered normal.
The QRS complex is usually not affected by the sinus tachycardia itself. However, there are two separate pathologies associated with any tachycardia that can be seen in sinus tachycardia: rate-related aberrancy and electrical alternans.
To quickly review, rate-related aberrancy refers to an aberrantly conducted impulse in the ventricles due to the impulses arriving at a section of the electrical conduction system before the refractory period has completed. The impulse must continue on from this refractory area by direct cell-to-cell transmission, which leads to a slow, abnormal QRS complex. For a complete discussion on this topic, please review Chapter 6, Electrocardiography and Arrhythmia Recognition.
Electrical alternans is an alteration of the size or amplitude of the QRS complex. This alteration in size can occur either every other beat or over a series of beats (Figure 10-3).

Figure 10-3 Electrical alternans can occur at every other beat or over a series of beats.
© Jones & Bartlett Learning.
DescriptionBriefly stated, the most common cause of electrical alternans is a tachycardic rhythm. The rapid mechanical contractions of the heart cause the electrical axis of the ventricles to fluctuate in its orientation (Figure 10-4). This fluctuation makes the size of the complex change as the axis points more directly toward an electrode one moment and more directly away from an electrode the next. Electrical alternans can also be seen in pericardial effusions, pericardial tamponade (a medical emergency), and as a respiratory variation. Complete discussion of this topic is beyond the scope of this book. If you would like a complete discussion of the topic, you may refer to our accompanying text 12-Lead ECG: The Art of Interpretation by Garcia and Holtz.

Figure 10-4 When the electrical axis fluctuates back and forth between two different orientations, the result is an alternating change in the size of the complex—electrical alternans.
© Jones & Bartlett Learning.
DescriptionThe ST segment in many tachycardic strips may be depressed. Some sinus tachycardia strips also show this variant morphology. The ST depression may be due to various reasons: the atrial repolarization wave or Tp wave, relative endocardial ischemia, actual endocardial ischemia, or a buried P wave, just to name a few possibilities. A word to the wise: Whenever you see any ST depression, get a full 12-lead ECG to evaluate the situation. It could save you and your patient a lot of heartache—literally!
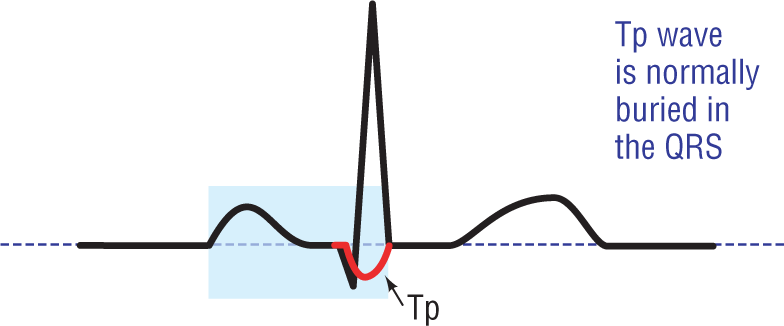
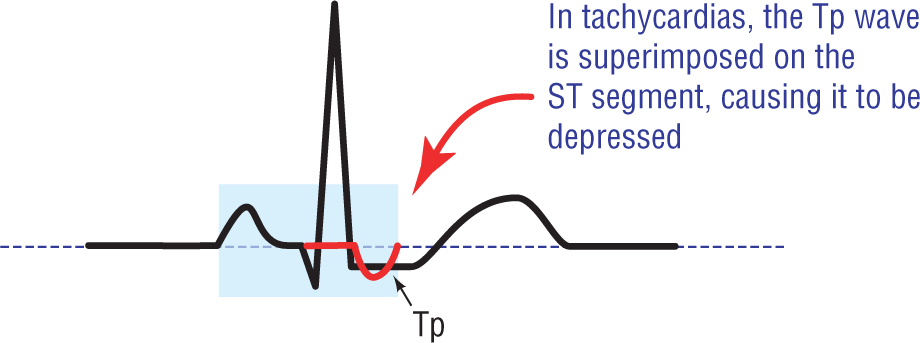
The Tp wave is discussed in Chapter 4, Vectors and the Basic Beat, and shown in Figure 10-5. To review, this is a negative wave that is caused by atrial repolarization. It is usually not seen because it is buried in the QRS complex. The electrical forces involved in ventricular depolarization overwhelm the relatively small forces of atrial repolarization, making it electrocardiographically invisible. In tachycardia, the QRS complex comes earlier in time due to a shorter PR interval. The result is that the Tp wave is visible as a slight depression of the ST segment (Figure 10-6).

Figure 10-5 The Tp wave.
© Jones & Bartlett Learning.

Figure 10-6 In tachycardia, the Tp wave is sometimes visible as a slight depression of the ST segment.
© Jones & Bartlett Learning.
The endocardium of the heart can be relatively, or actually, underperfused in any tachycardia. This can lead to ST depression. The endocardium can be relatively underperfused because tachycardias require the heart to contract forcefully and rapidly. This requires more oxygen stocking. In many cases, the endocardial tissue is receiving adequate amounts of oxygen but not enough to compensate for the increased workload. The result is relative ischemia. The endocardium can also experience actual ischemia even though the area is not infarcting. As we shall discuss in greater detail later in this chapter, tachycardias can cause a marked drop in cardiac output. This drop in cardiac output means that the heart is receiving less oxygen during a time when it needs it the most. That results in actual ischemia.
In addition to direct subendocardial injury, an acute myocardial infarction (AMI) occurring in an area electrocardiographically opposite a lead causes ST depression to appear in those leads. This is called the reciprocal changes of an AMI. (For a full discussion of this topic, see 12-Lead ECG: The Art of Interpretation.)
As we shall see in later chapters, certain tachycardias have more P waves than QRS complexes. Atrial flutter is one example. In these tachycardias, the F waves are sometimes buried or superimposed on the QRS, the ST segment, or the T wave. The result of these superimposed waves can vary depending on their orientation and their exact location. A negative P wave that falls directly on the ST segment can present as a downward deflection of the ST segment.
Now, let’s get back to the need for an ECG. As you can see, the cause of ST depression can vary from the benign to the life threatening. It is to isolate and identify these life-threatening events that a full 12-lead ECG should be obtained on any patient showing ST depression on a rhythm strip.
The QT interval is also not immune to the sympathetic stimulation with which the heart is being bombarded during periods of stress. The result is a marked shortening of the QT interval during sinus tachycardia. The shortening is directly proportional to the speed of the tachycardia; the faster the rate, the shorter the QT. The variation in the normal measurement of the QT interval with heart rate is the reason that the QTc was created. The QTc is a number that nullifies the effect of heart rate on the length of the interval. For more on this, see Chapter 4, Vectors and the Basic Beat.
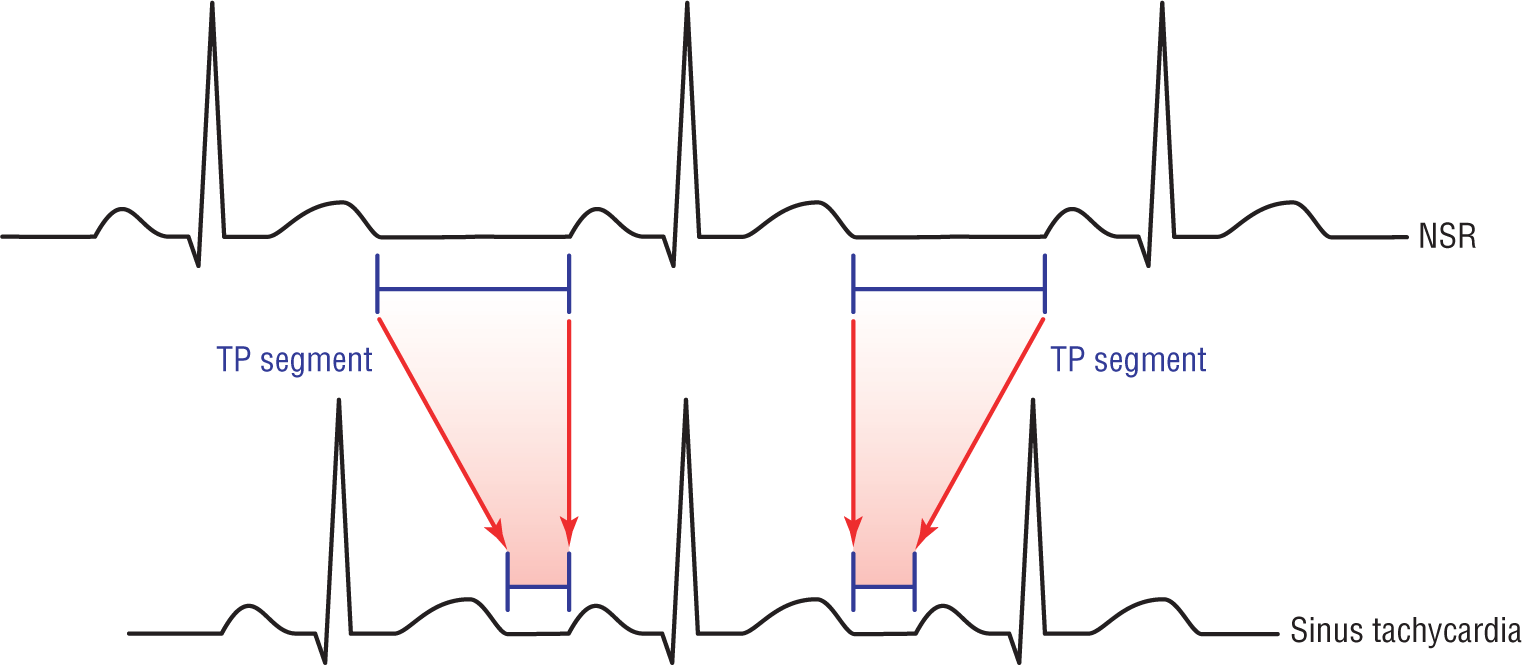
However, just as in sinus bradycardia, the area that is most affected by the sympathetic stimulation is phase 4 of the action potential and in its electrocardiographic representation, the TP segment. If you recall, sinus bradycardia caused a slowing of automaticity and a lengthening of the TP segment. In sinus tachycardia, because of the sympathetic stimulation, we see the opposite effect. The time during which phase 4 completes is greatly shortened and the TP segment follows suit by becoming much shorter (Figures 10-7 and 10-8).

Figure 10-7 In sinus tachycardia, phase 4 is shorter.
© Jones & Bartlett Learning.

Figure 10-8 In sinus tachycardia, the TP segments are shorter.
© Jones & Bartlett Learning.
Sinus tachycardia is easily identifiable because it has discrete complexes, which are identical to the NSR complexes but separated by shorter TP segments (Figure 10-8). Once again, notice that the P waves, PR intervals, and QRS complexes are all identical (except for the variations noted before).