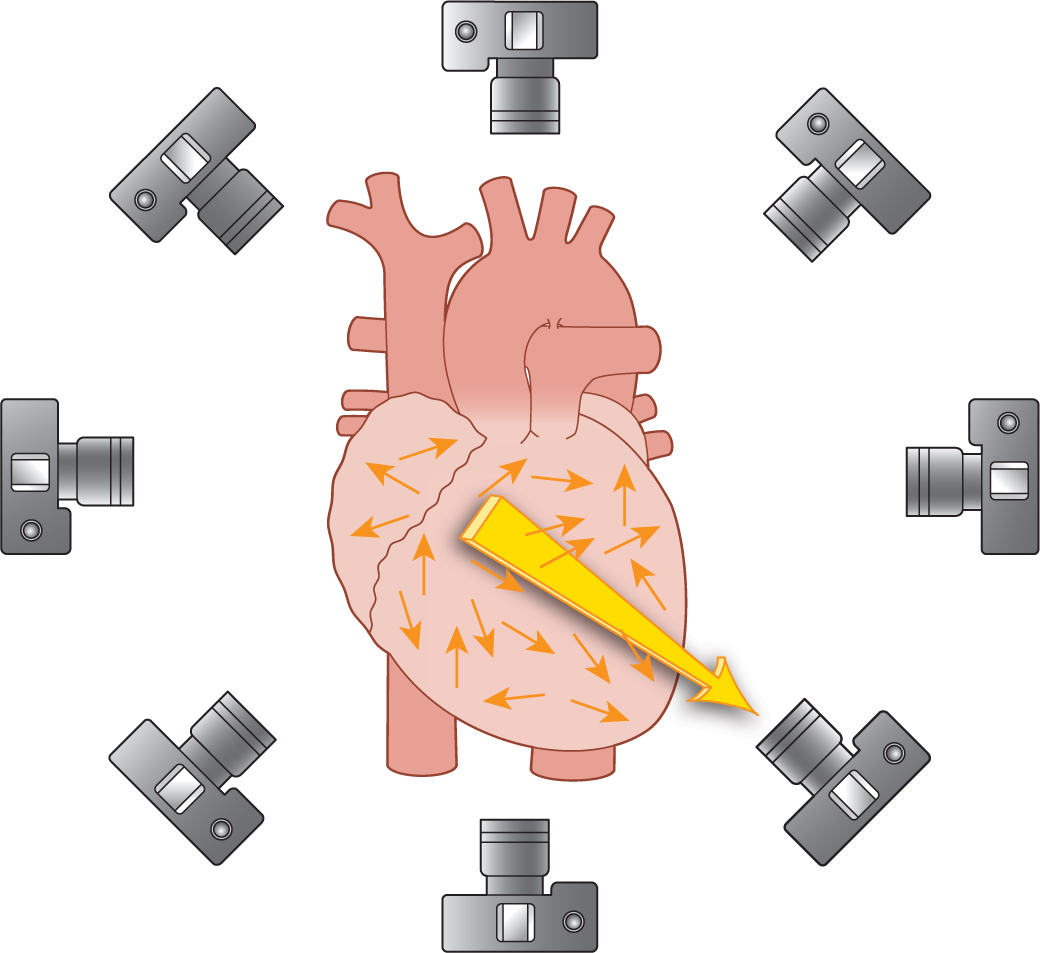
Figure 13-7 Leads are like cameras.
© Jones & Bartlett Learning.
In Chapter 4, Vectors and the Basic Beat, and Chapter 5, Introduction to 12-Lead ECGs, we reviewed the concept of the electrical axis of the heart. If you remember, each myocyte in the ventricles forms its own small electrical vector (Figure 13-7). The electrical axis of the heart is the main vector that remains when all of those individual small vectors are added together.

Figure 13-7 Leads are like cameras.
© Jones & Bartlett Learning.
So, why the big deal about the electrical axis? Well, an ECG machine or monitor does not measure each individual small vector. It only measures the single resultant vector produced during a single instant. In the case of the ventricles, that vector is the electrical axis.
Recall that the electrical leads act like cameras taking individual pictures of a vector from its own individual vantage point (Figure 13-7). That electrode sees a vector traveling toward it as a positive wave. A vector traveling away from it produces a negative wave (Figure 13-8). Since the vector causes the different positive and negative waves to appear on an ECG strip, the direction, amplitude, and duration of the vector are extremely important. These properties of the vector as seen over time form the resultant shape of the wave on the ECG tracing.
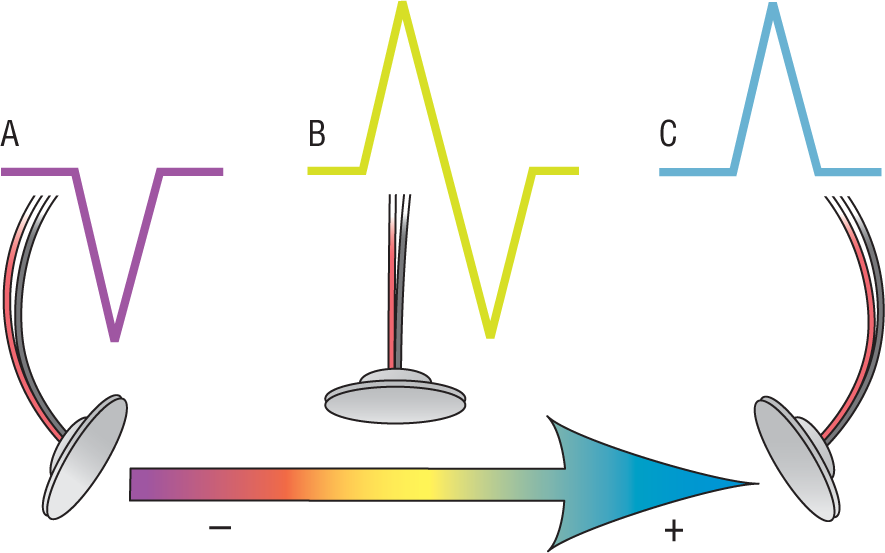
Figure 13-8 A positive wave heading toward an electrode gives rise to a positive deflection. A positive wave heading away from an electrode gives rise to a negative deflection.
© Jones & Bartlett Learning.
DescriptionIn the atria, the same process of vector formation occurs during the depolarization of the myocytes. The atrial myocytes each form their own individual vectors that, when added together, form one large vector. That large vector is known as the P-wave axis and is normally found around −60 degrees (Figure 13-9). Calculating the exact P-wave axis is more complicated than figuring out the ventricular axis and belongs with the study of 12-lead ECGs; however, the P-wave axis remains extremely important to the analysis of any arrhythmia in a way that is very simple and easy to identify: its relation to certain leads.
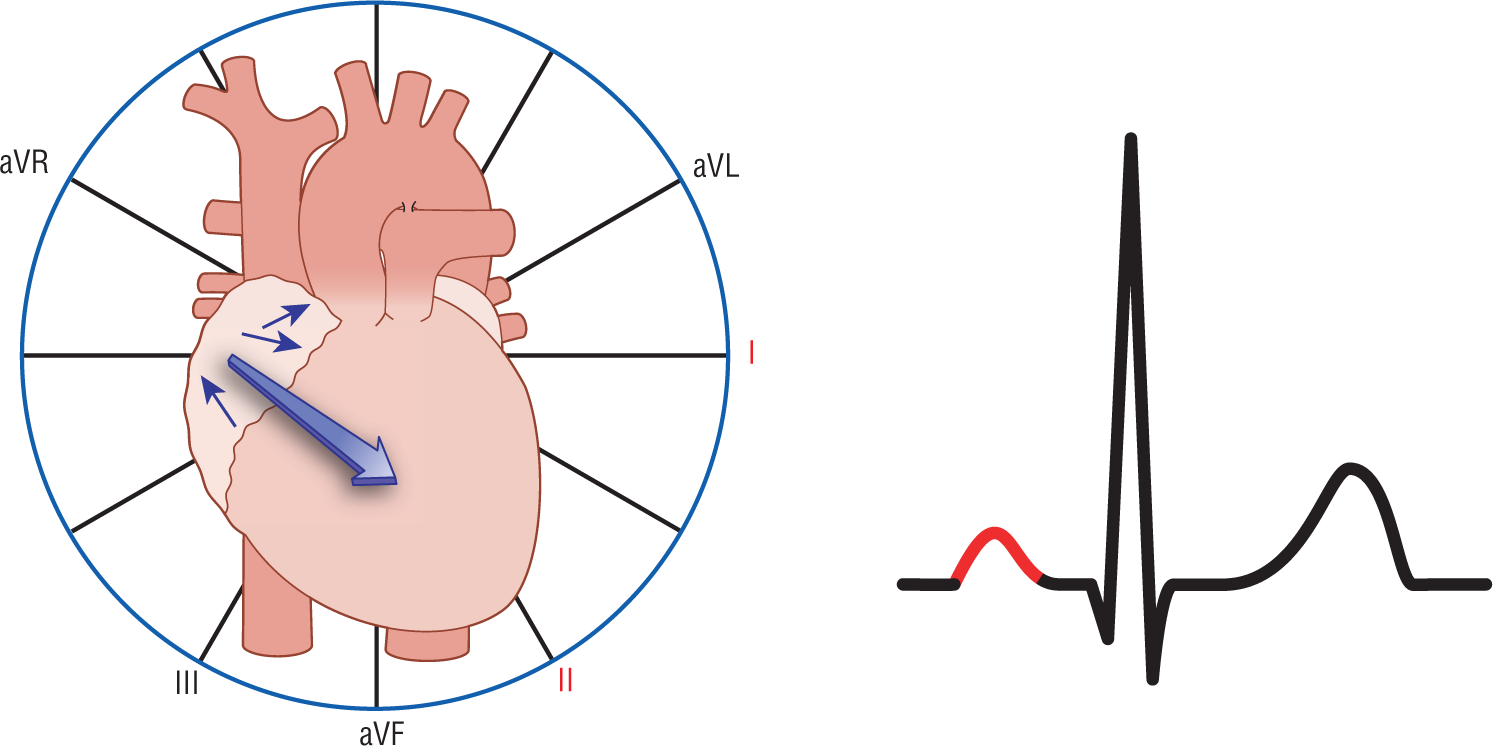
Figure 13-9 In this example, the P-wave vector is headed inferiorly, backward, and to the left. Leads I and II see a positive vector headed toward them, and this is represented electrocardiographically as a positive P wave in those leads.
© Jones & Bartlett Learning.
Remember, the electrocardiographic representation of the P wave in any one lead depends on its own particular vantage point as it views the P-wave axis. For example, if the P-wave axis is headed inferiorly, backward and to the left, the P wave will be seen in leads I and II as being positive (Figure 13-9). If, on the other hand, the vector is headed superiorly, backward, and to the right, the P wave will be seen in leads I and II as being negative (Figure 13-10). The length or duration of the P wave is dependent on the duration of the atrial depolarization process and, therefore, the length of its vector.
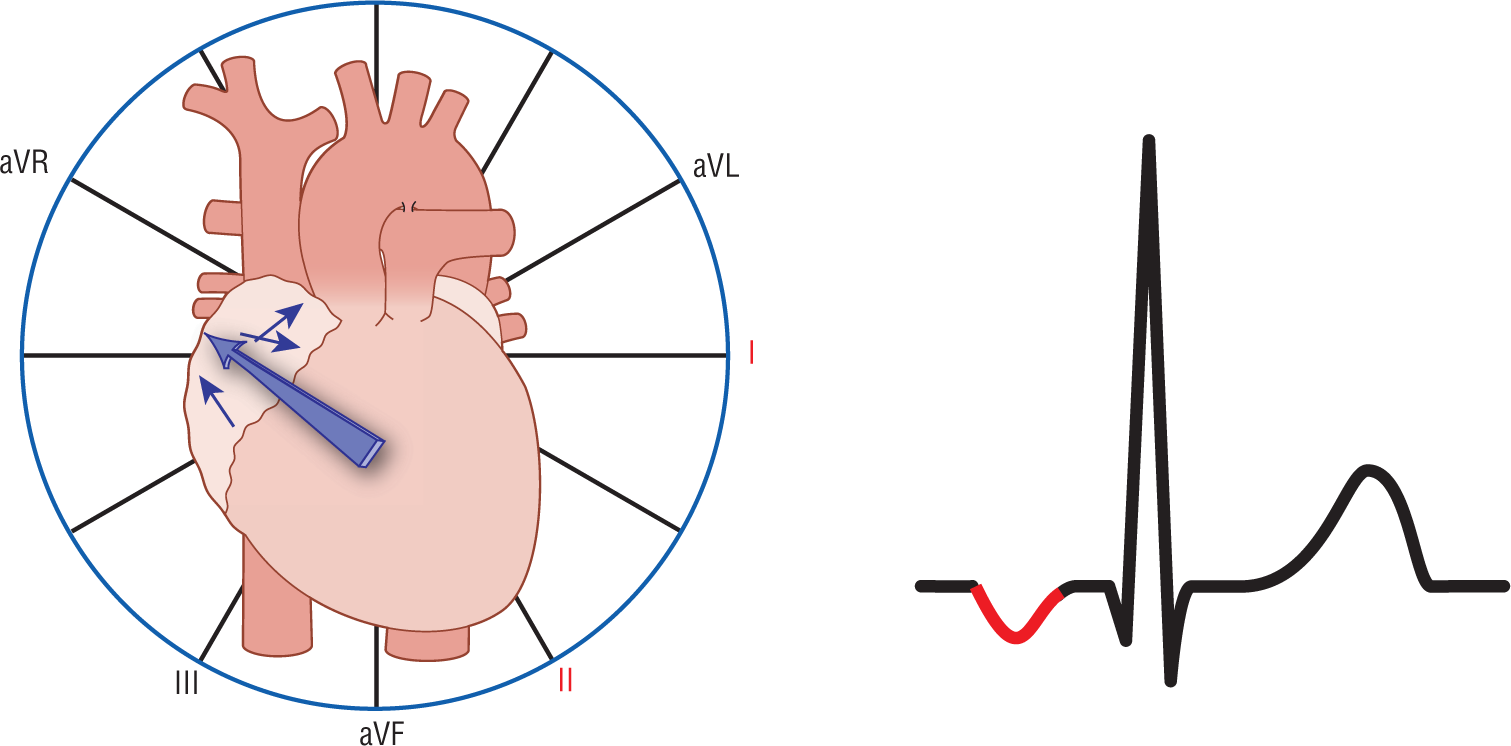
Figure 13-10 In this example, the P-wave vector is headed superiorly, backward, and to the right. Leads I and II see a positive vector headed away from them and this is represented electrocardiographically as a negative P wave in those leads.
© Jones & Bartlett Learning.
Notice how the number of possible combinations is pretty extensive, and so are the possible morphologies of the P waves. Since each myocyte is in a different three-dimensional position, each one will give rise to its own particular vector, its own way of initiating and propagating a depolarization wave, and, hence, its own particular P-wave morphology.
Now, let’s get back to PACs. PACs, by definition, originate in an ectopic atrial focus. The P-wave morphology in PACs and their PR intervals will, therefore, always differ from those complexes that originated in the sinus node. These morphologic differences provide some excellent clinical clues to the presence of an ectopic complex. The P waves can, however, provide another important diagnostic clue: the direction of the P wave in the various leads.
Previously we discussed the fact that a vector heading from the sinus node must travel inferiorly, anteriorly, and to the left (Figure 13-11). For the sake of simplicity, this causes the P waves to be upright in leads II, III, and aVF. (To be completely correct, the P waves must be upright in leads I, II, aVF, V1, V5–6, and negative in aVR, if you have a 12-lead ECG.) The P waves have to be upright in those leads because the sinus node is at the high end of the heart and the depolarization wave and its resulting vector has to head inferiorly. This is, therefore, the direction of the normal P-wave vector or, more technically, the direction of the P-wave axis.
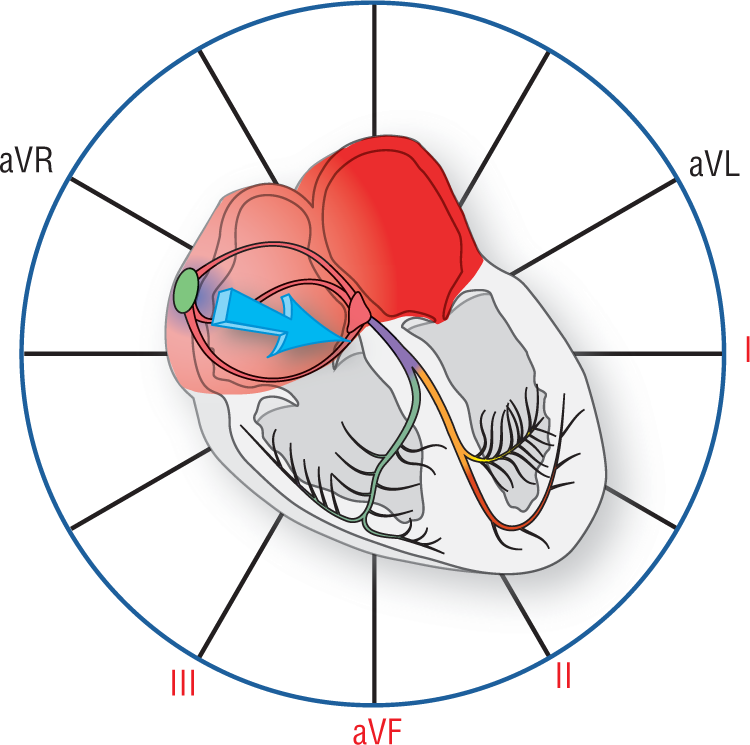
Figure 13-11 The sinus node and the P-wave vector. This Figure graphically represents the P-wave vector as a light blue vector heading inferiorly and to the left. Note that the vector is heading toward the positive poles of leads I and II. Remember, a vector heading toward the positive pole of a lead gives rise electrocardiographically to an upright or positive wave in that lead. Since an impulse that originated in the sinus node can travel only downward and to the left, the P wave has to be upright in leads I, II, III, aVF, and V5 to V6.
© Jones & Bartlett Learning.
Now, suppose you had an ectopic pacemaker triggering a PAC. The P-wave axis of that complex depends on the location of the ectopic pacer. As an example, look at Figure 13-12. In this example, the yellow area represents the irritable focus that fires early. As the depolarization wave proceeds outward from this zone, it creates a main P-wave vector that proceeds superiorly, anteriorly, and to the right. Would the P wave be positive in leads I, II, III, and aVF? The answer is no. The P waves would be negative because the vector is heading away from those leads.
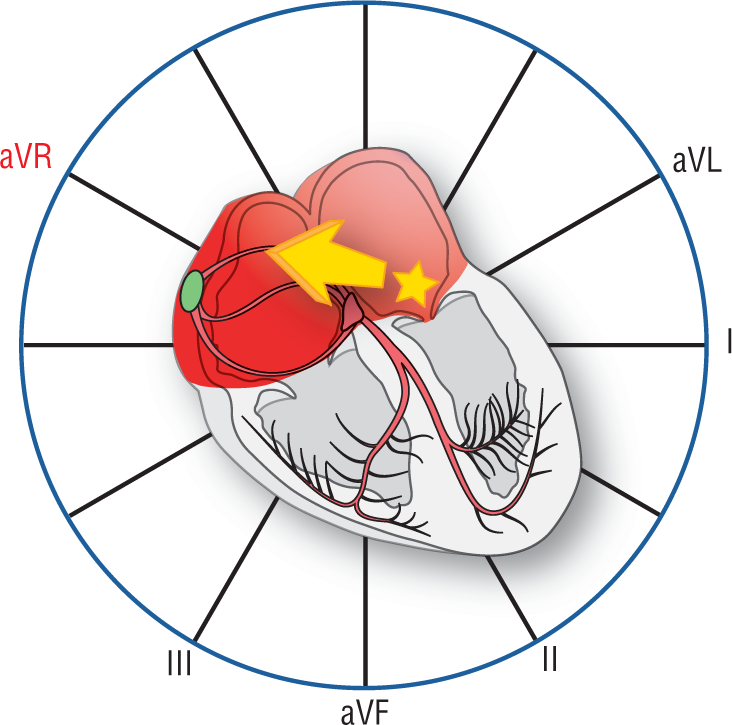
Figure 13-12 An ectopic focus and its P-wave vector. This Figure graphically represents the P-wave vector as a yellow vector heading superiorly and to the right. Note that the vector is heading toward the positive pole of lead aVR only. The P waves would be negative in leads I, II, III, and aVF.
© Jones & Bartlett Learning.
The main take-home points and the whole reason to discuss the P-wave axis can be summed up easily in a couple of sentences. If a complex starts out in the sinus node, the P wave will always be positive in leads I, II, III, and aVF. Likewise, the reverse leads us to one of the most important rules in arrhythmia recognition:
If the P wave is not upright in leads I, II, aVF, V1, and V5-6, and negative in aVR, then the P wave had to have originated in some ectopic focus.
The ectopic focus could be anywhere in the atria or below (as in the case of retrograde conduction to the atria from the AV node or the ventricles).
Take special note, however, of a very important implication of the previous statement. Many times you can still have an ectopic atrial pacemaker with upright P waves in leads II, III, and aVF. This can occur when the ectopic focus is adjacent to the sinus node or somewhere along the superior portions of the right atrium. These ectopic foci will still give you vectors that are directed downward and will, therefore, give rise to upright P waves in lead II of a rhythm strip. BUT, a negative P wave in either leads I, II, aVF, or V5–6 has to originate in some ectopic focus.
As you can imagine, the P-wave axis is a tremendous help in the differential diagnosis of a rhythm abnormality. The presence of an abnormal P-wave axis automatically focuses your differential diagnosis into either an ectopic atrial rhythm, or as a rhythm that originated in the AV node or below and is being spread retrogradely to the atria. Please take the time to understand this point completely and thoroughly, as we will refer to this concept over and over again throughout the rest of this book.