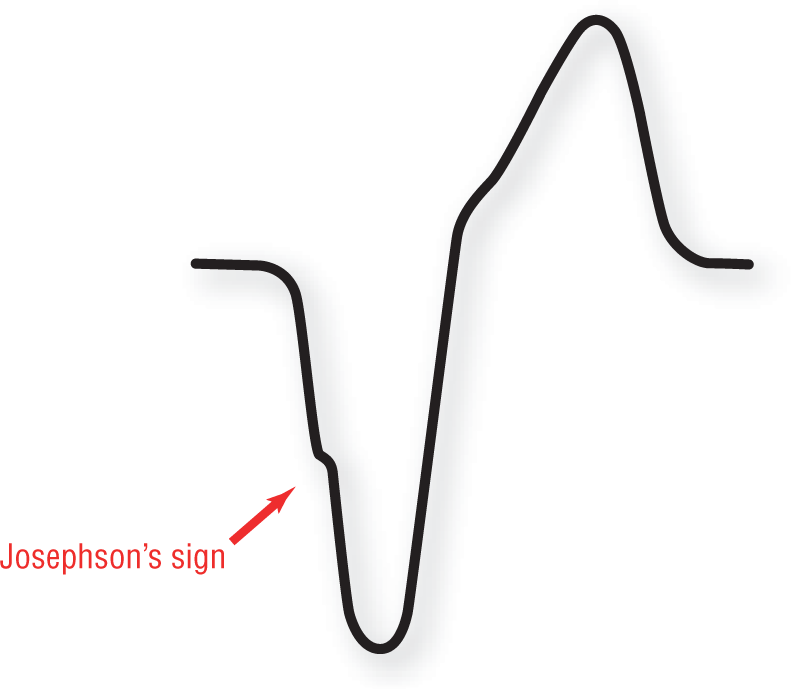
Figure 32-9 Josephson’s sign.
© Jones & Bartlett Learning.
General Characteristics of Ventricular Tachycardia
Morphology of the Complexes and Arrhythmia Recognition
If you understand the principles presented in Chapter 31, Ventricular Escape and Idioventricular Rhythms, then understanding VTach will be a breeze. This is because VTach is, rhythmically speaking, just a faster, deadlier form of accelerated idioventricular rhythm. VTach is characterized by the usual ectopic ventricular appearance of wide, bizarre complexes (wider than 0.12 seconds) and ST-T–wave abnormalities. Just as in any ventricular rhythm, the complexes are usually wider than you would expect to see in an uncomplicated bundle branch block, with widths of 0.16 and 0.20 seconds being common.
In addition to these general characteristics, the presence of Josephson’s sign (Figure 32-9) and Brugada’s sign (Figure 32-10) are fairly commonplace in many patients with VTach, and should be actively sought because it is essential to the differential diagnosis of VTach. (As we shall see, the presence of these two morphologic features will become very helpful to you in the differential diagnosis of wide-complex beats and tachycardias, as they are usually not present in supraventricular complexes with aberrant conduction or in patients with underlying bundle branch blocks.)
Figure 32-9 Josephson’s sign.
© Jones & Bartlett Learning.
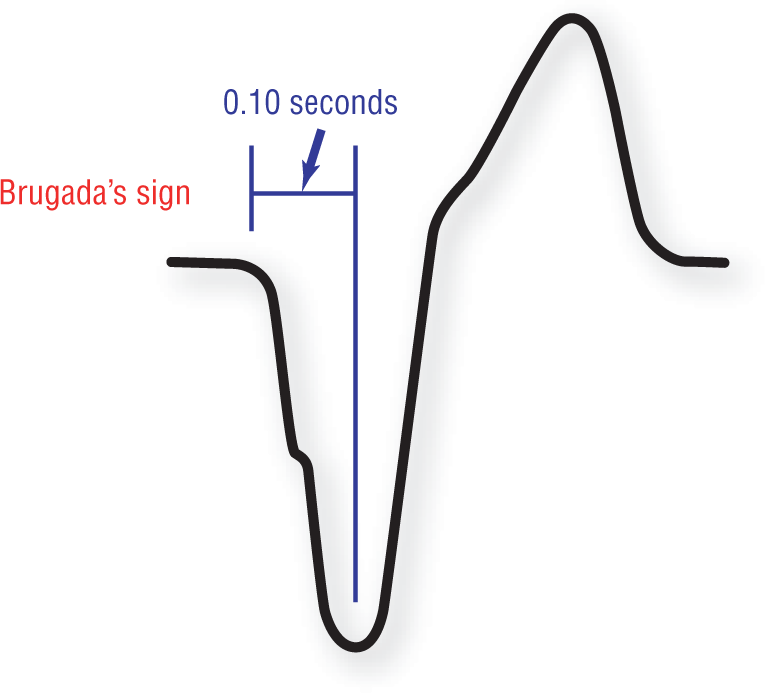
Figure 32-10 Brugada’s sign.
© Jones & Bartlett Learning.
ST-T–wave abnormalities are always present, just as in every other ventricular rhythm. The ST-T–wave abnormalities are even more pronounced in VTach because of the rapid rates involved. These abnormalities can often hide an underlying P wave or a supraventricular rhythm (in the case of atrioventricular [AV] dissociation).
It is extremely important at this time to go back to the basics of electrocardiography and remember that the morphology of the complexes depends on the leads being used. A common mistake made by beginners is to expect to always see the same morphologic appearance for VTach. Usually, it is similar to the morphology present in top left-hand strip on Figure 32-11. Often, when that expected morphologic appearance is not present, the diagnosis is missed and the rhythm is mistakenly assumed to be supraventricular in nature. This can be a deadly mistake.
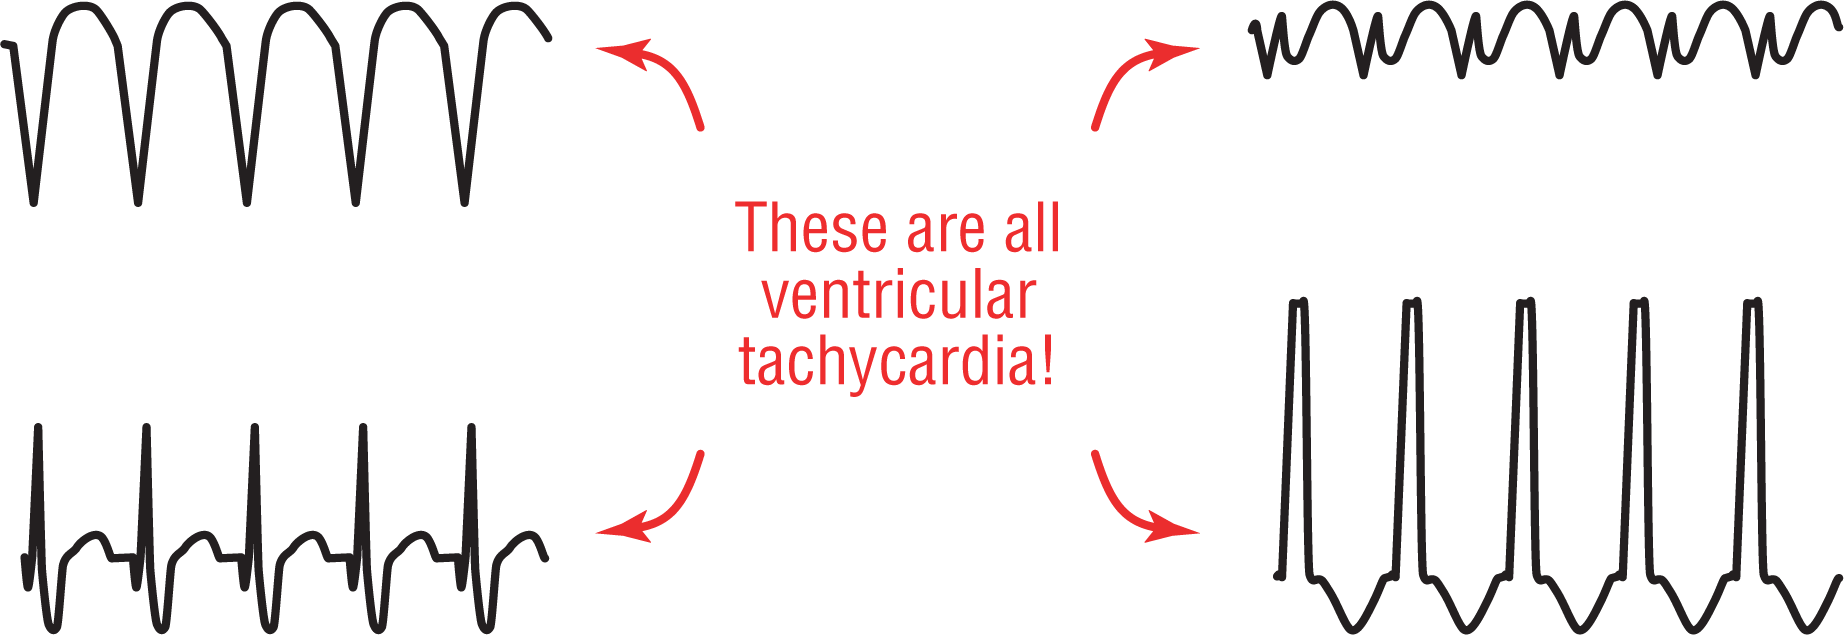
Figure 32-11 Ventricular tachycardia can have many different appearances!
© Jones & Bartlett Learning.
DescriptionRemember, if you don’t think of it, you cannot diagnose it. We need to remember that sometimes the complexes will be positive, and sometimes they will be negative. Sometimes they will be tall, and sometimes they will be short. Look for the presence of a wide-complex tachycardia first and foremost, keeping in mind that the appearance may be different depending on the lead and the direction of the ventricular vectors causing the electrocardiographic appearance.
In general, VTach is a very regular rhythm (Figure 32-12). We say “in general” because in over 90% of the cases, it appears with clockwork precision. In the other 10%, however, there can be some slight irregularity. This irregularity causes a variation in the cadence of the complexes but by no more than 0.16 seconds (about 4 small boxes on the strip). These irregularities are usually found if the VTach is slow.
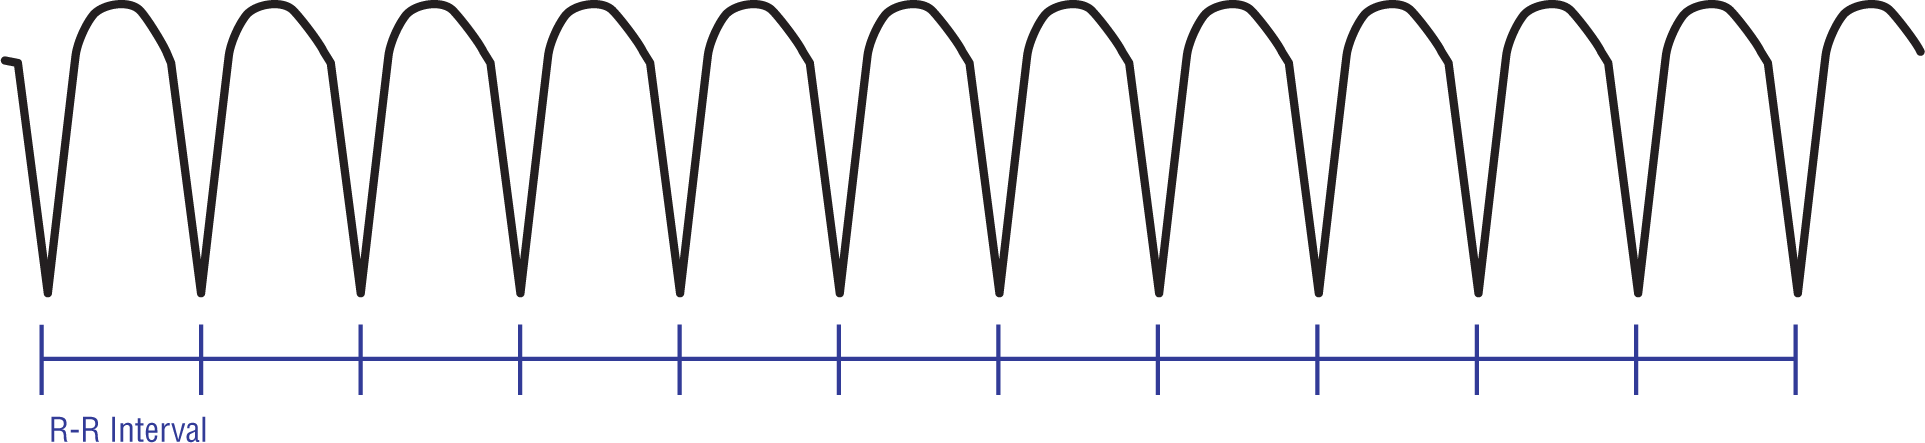
Figure 32-12 Ventricular tachycardia is very regular.
© Jones & Bartlett Learning.
Patients with VTach are frequently found to have had frequent PVCs prior to onset. Tachycardia is usually triggered by a PVC; therefore the rhythm can show some irregularity at the onset (Figure 32-13). This irregularity typically lasts for a few seconds (can be up to 10 to 20 beats) but quickly corrects itself once the rate of the rhythm stabilizes.
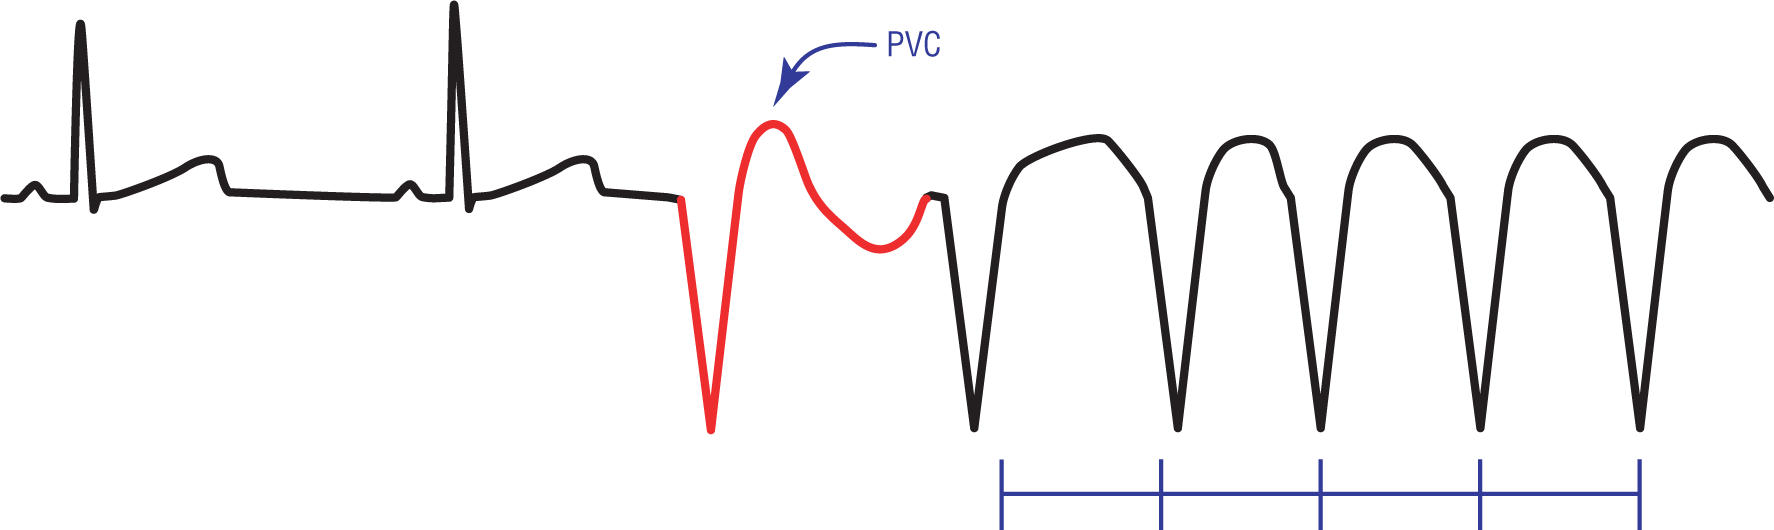
Figure 32-13 A PVC triggers off a run of VTach. Note that at the onset, the rhythm is irregular. This quickly stabilizes to the normal regular pattern typically found in VTach.
© Jones & Bartlett Learning.
As we saw in accelerated idioventricular rhythm, AV dissociation is very commonly found in ventricular rhythms. As we shall see, this is even more so in VTach. It is clearly and easily found in about 50% of the cases on close examination of the strip. (With a bit more detective work, it may actually be found in a few more cases because the P waves are frequently hidden from view by the overlying ventricular rhythm.) The diffuse ST-T–wave abnormalities and the bizarre, wide morphologies of the ventricular complexes can easily obscure the relatively small underlying P waves. For this reason, it is extremely important to look at every little abnormality on the strip and use your calipers to map any possible connection between them.
AV dissociation is actually the most important thing you can look for when you are trying to establish VTach as the cause of a wide-complex tachycardia (Figure 32-14). Always look for the presence of P waves, capture beats, and fusion beats. Remember, the presence of capture beats and fusion beats is indirect evidence of an underlying AV dissociation. (AV dissociation can also occur with a junctional tachycardia with a preexisting bundle branch block or aberrancy, but as you can imagine, this combination is rarely found.)
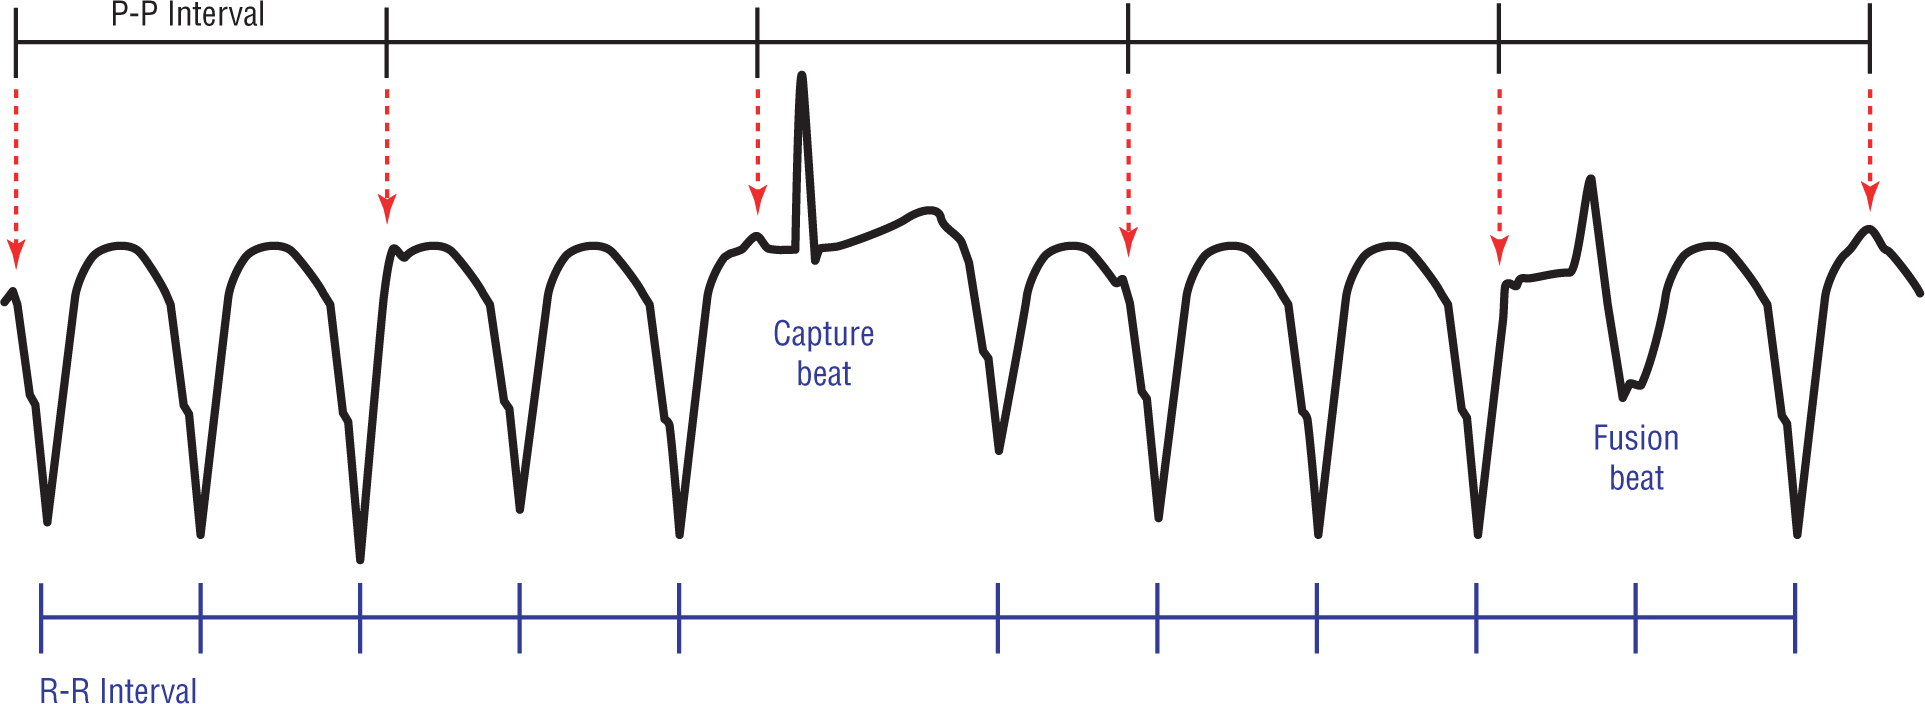
Figure 32-14 Ventricular tachycardia is quite frequently associated with AV dissociation. Always look for P waves, capture beats, and fusion beats!
© Jones & Bartlett Learning.
DescriptionFor clinical purposes, therefore, any wide-complex tachycardia with an AV dissociation should be considered VTach until proven otherwise. As a matter of fact, any wide-complex tachycardia should be considered VTach until proven otherwise, PERIOD. Being conservative and playing the odds is the clinically prudent thing to do when approaching these rhythms. That said, close clinical correlation and close examination of the strip can lead to the correct diagnosis in about 90% of the cases.
Figure 32-14 clearly shows a variation in the size of the QRS complexes. Yet, this is still an example of a monomorphic VTach. Why does this happen? The variation in the size of the complexes can be due to many reasons. Most commonly it is due to the electrical alternans that is frequently seen in most tachycardias. Other causes include: fusion with the component waves of the complexes around them, a fusion with a large underlying P wave in the case of AV dissociation, or a slight variation in the course of a reentry circuit (which could just alter the vector, and hence the morphology, slightly. Don’t let the slight variations fool you into thinking that this is anything but VTach!
Many times the complexes in monomorphic VTach will be identical to the morphology of previous PVCs associated with your patient (see Figure 32-13). The reason for this is that the reentry circuits are the same for both, but a repetitive cycle is not established with single PVCs.