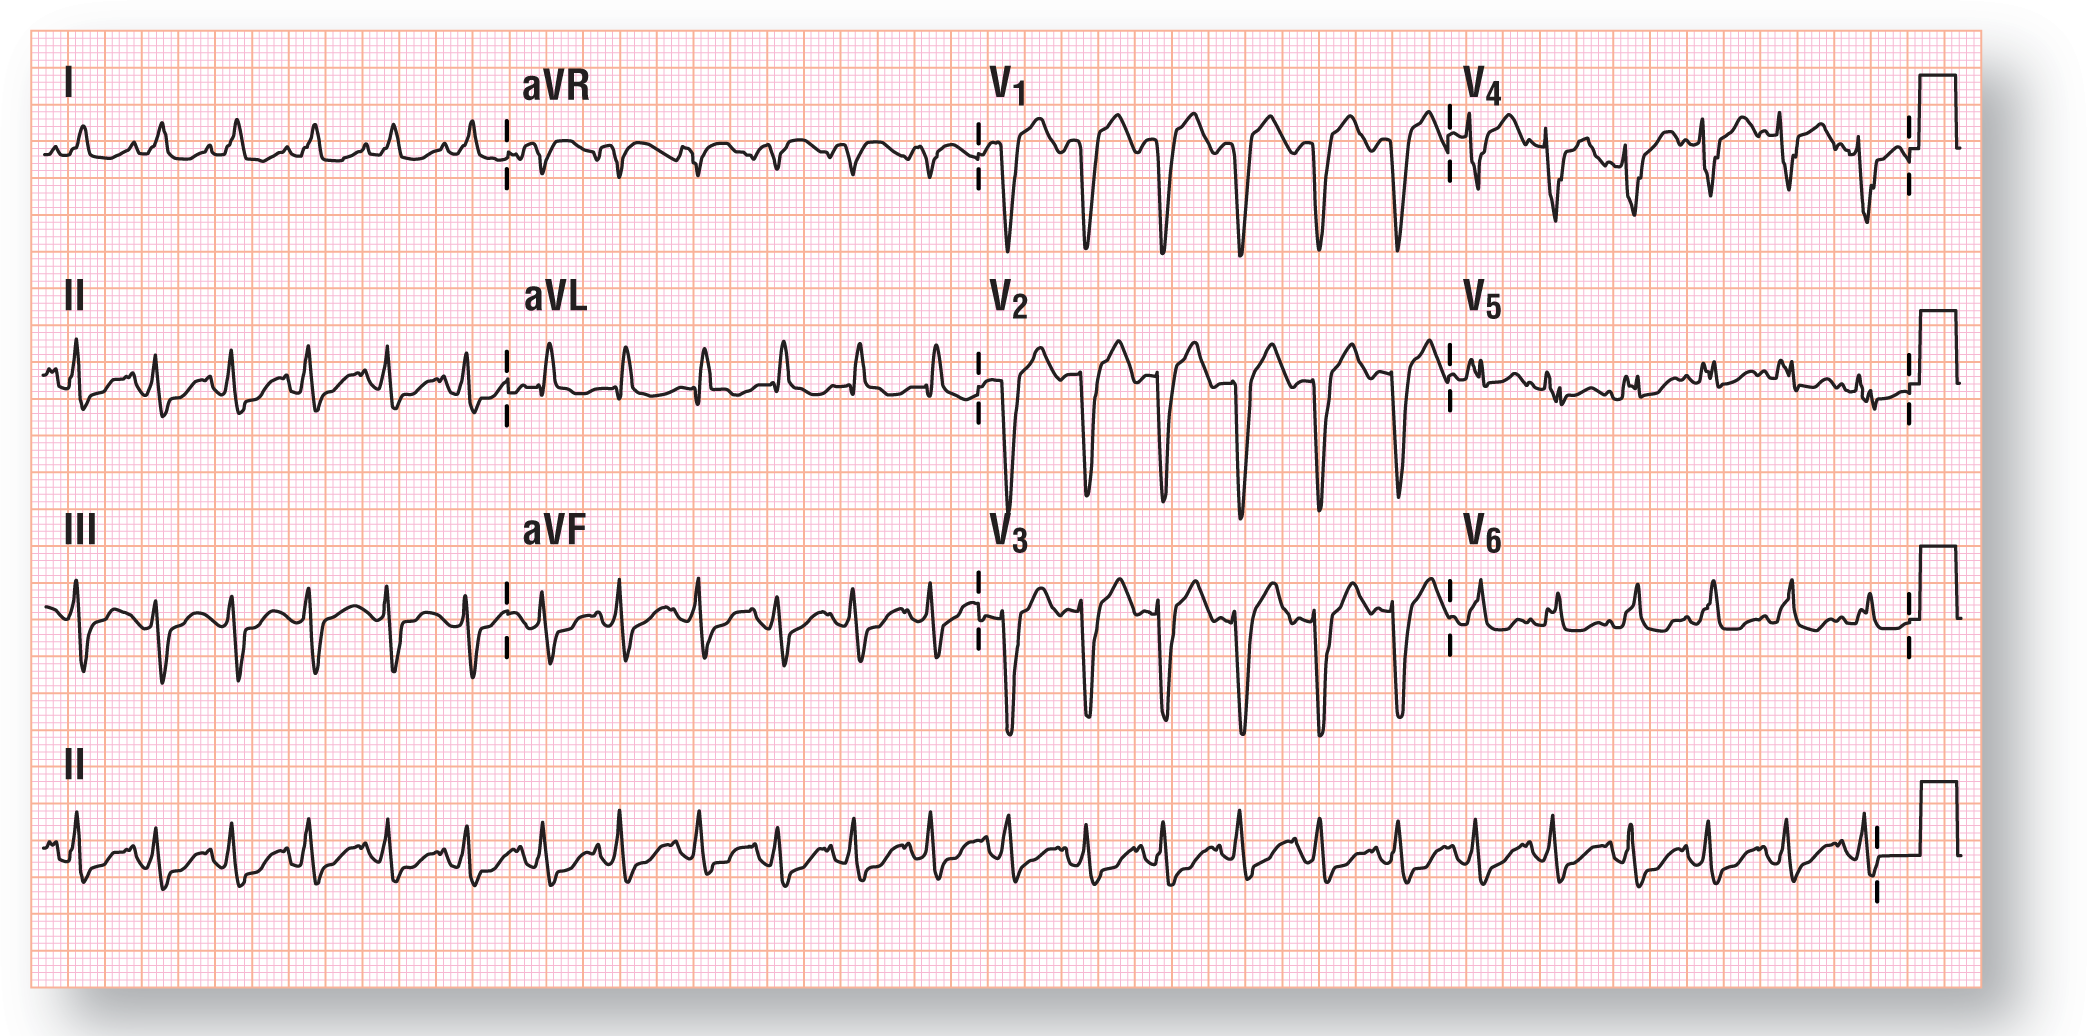
Figure 37-10 Presenting ECG for the patient in case 3.
From Arrhythmia Recognition: The Art of Interpretation, Second Edition, courtesy of Tomas B. Garcia, MD.
DescriptionHistory
Chief Complaint. Second-degree burns to the right lower extremity after opening a hot radiator.
History of Present Illness. 42-year-old man who presented to the emergency department (ED) after his car began to overheat while in the middle of a traffic jam on the expressway. Patient states the hot liquid spewed out, covered his right leg, and went inside his right shoe. Patient immediately took off his shoe and threw a cold drink over the area. Patient states that blisters containing clear liquid formed over the area. Patient is presently experiencing a grade 6 out of 10 pain over the burned area only. Patient denies any significant medical problems or conditions and was in good health prior to the event.
Cardiac Risk Factors.
Social History.
Past Medical History. Patient denies any pertinent past medical illnesses, conditions, or surgical procedures. No prior ECGs or rhythm strips were available.
Family History. Aunt died of breast cancer at 34 years old.
Medications. None.
Allergies. None.
Review of Systems. Negative.
Physical Examination
General Appearance. Patient appears to be in no acute distress.
Blood pressure. 134/58 mm Hg.
Heart Rate. 140 BPM, regular rate and rhythm, normal bilateral pulses, equal and symmetrical.
Respiratory Rate. 20 breaths per minute, regular.
Oxygen Saturation. 98% on room air.
Lungs. Normal breath sounds. No crackles, wheezes, or rubs are noted.
Cardiac. Jugular venous distention is normal. Arterial pulses are of normal intensity, equal, and symmetrical bilaterally. No palpable thrills or heaves are noted. Normal S1 and S2 are noted without any murmurs; no S3 or S4 is noted.
Extremities. No signs of clubbing or cyanosis are noted on the tips of the fingers and toes. Right extremity shows various small blisters and erythema throughout the anterior and medial surfaces of the leg and the arch and top of the foot. No evidence of bleeding, circumferential burns, thickening of the skin or infection. Dorsalis pedis and posterior tibial pulses are strong bilaterally, equal, and symmetrical. Normal capillary refill of all the toes bilaterally, with blanching of the nail beds when pressure is applied and a full return of color within 1 second of release.
Preliminary Thoughts Based on the History and Physical Exam
This case doesn’t require a tremendous amount of brainpower to figure out. The poor guy had some hot antifreeze fall on his leg and foot that gave him a second-degree burn. Thanks to his immediate action in throwing the cold drink on his burn, further tissue destruction was prevented.
Other than the burn, the only other relevant significant clinical finding was the heart rate of 136 BPM. Pain at the site and anxiety are common causes for the tachycardia in such patients. I’m sure we all know from personal experience that second-degree burns are quite painful. Well, for whatever reason, the ED staff decided to get an ECG and the answer was quite unexpected.
Electrocardiogram
This ECG can be a little tough to interpret if you don’t pay close attention (Figure 37-10). First of all, it is obviously tachycardia with a heart rate of 143 BPM. So, we know we are dealing with a tachycardia. Moving on, if you don’t measure the QRS complexes with the widest intervals, you could talk yourself into believing that this is actually a narrow-complex SVT. However, we are thorough and note that the QRS measures 0.12 seconds in quite a few leads. The narrower-looking leads appear thinner because of the presence of isoelectric segments either at the beginning or the end of the complexes. So, we are dealing with a WCT and not a simple SVT.

Figure 37-10 Presenting ECG for the patient in case 3.
From Arrhythmia Recognition: The Art of Interpretation, Second Edition, courtesy of Tomas B. Garcia, MD.
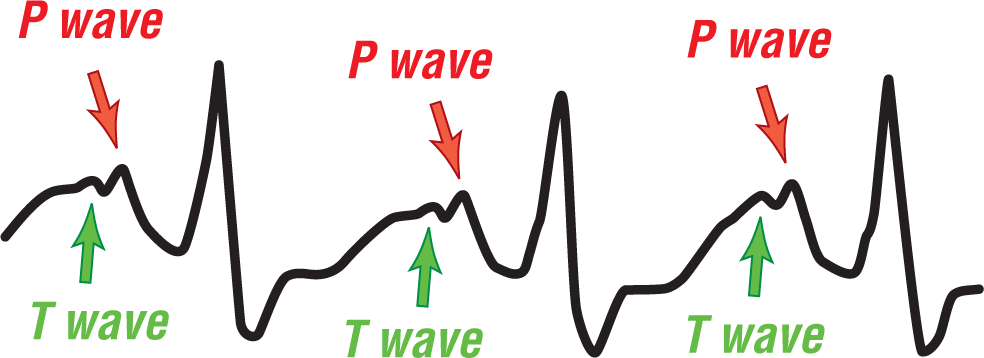
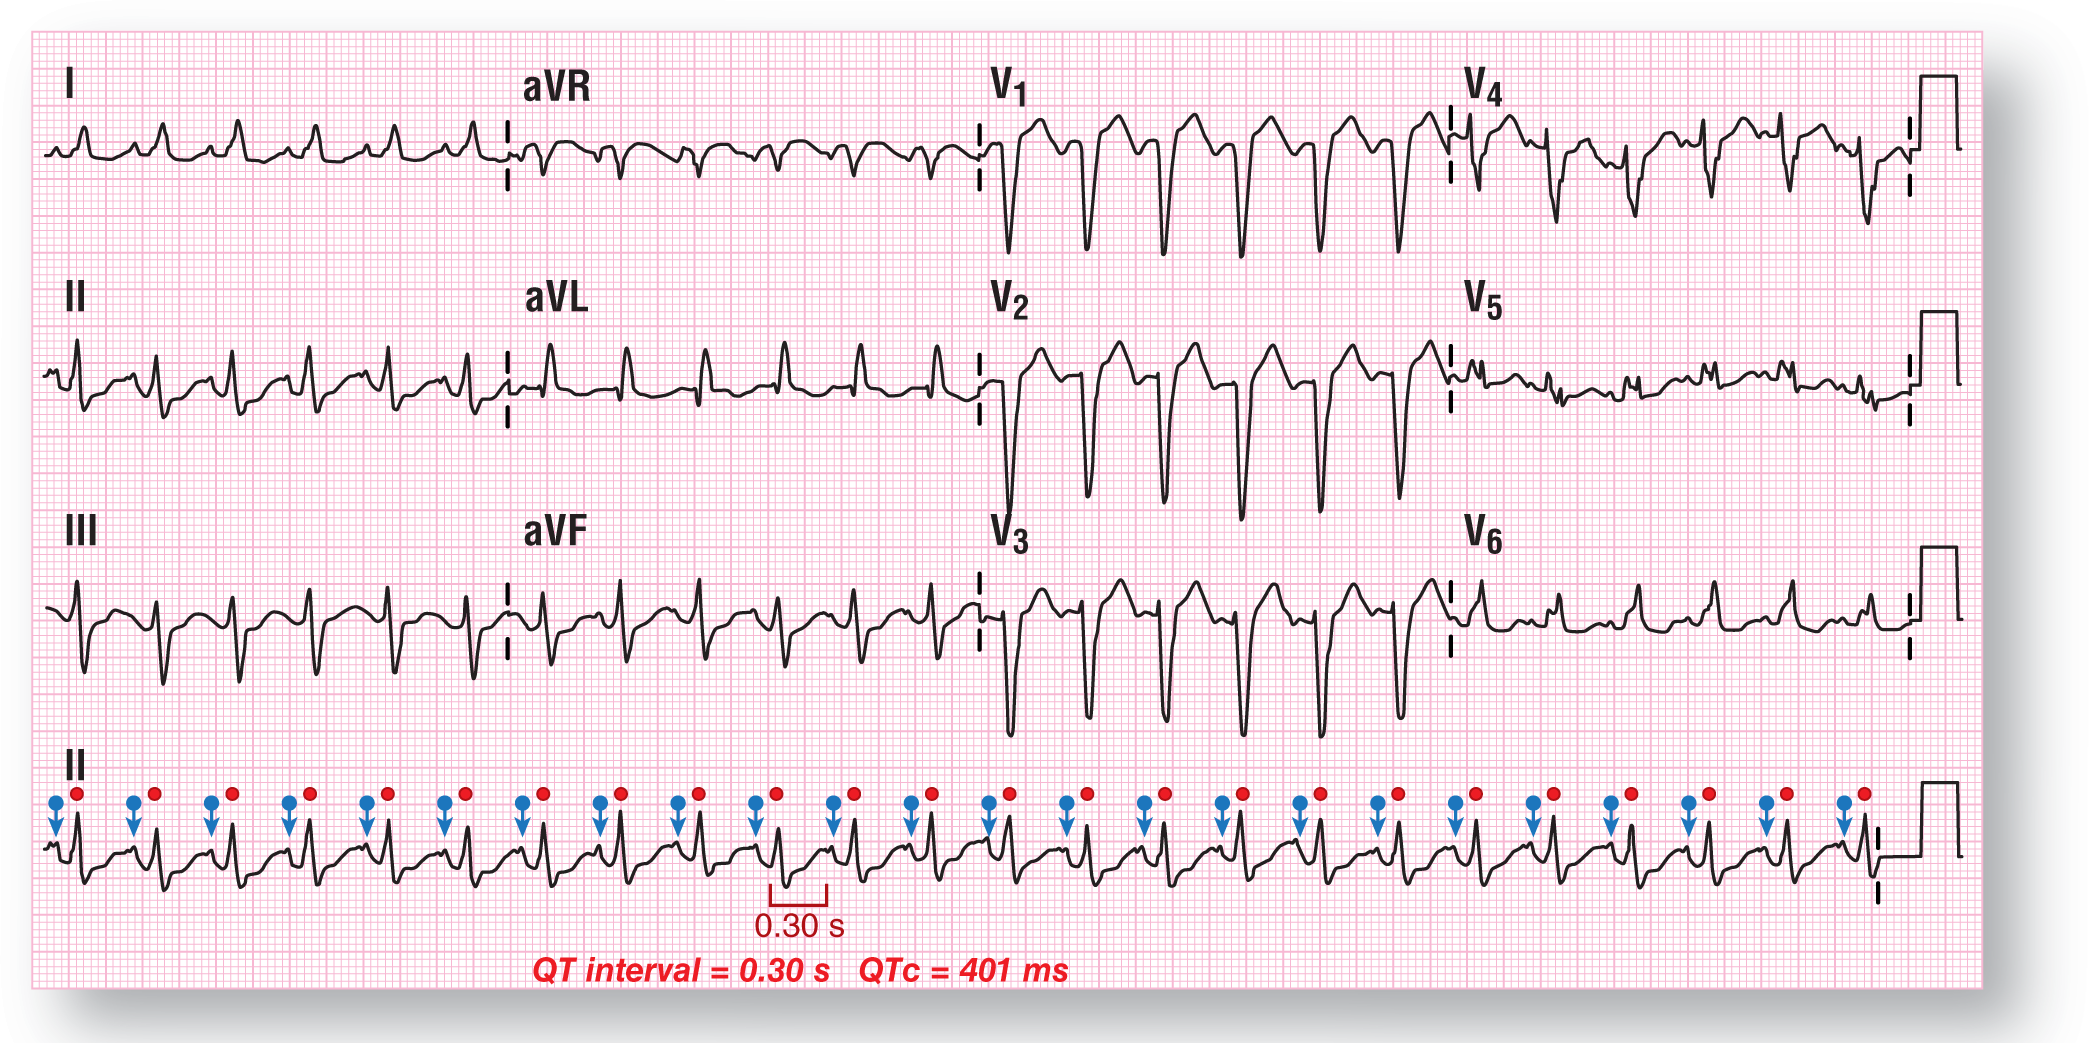
DescriptionNow we turn our attention to the P waves. Are there even any P waves visible on this strip? Yep, they are at the end of the T waves (Figure 37-11). Take a look at Figure 37-12. Once you have isolated the various components of the complexes, you can clearly isolate the timing of the P waves (marked by the blue arrows; the QRS complexes are marked by the red circles). The timing of both are very even and very consistent.

Figure 37-11 The P waves are situated immediately after the T wave. In essence, the P waves are partially buried in the T wave of the preceding wave.
© Jones & Bartlett Learning.

Figure 37-12 The P waves and QRS complexes are marked clearly for you on this strip. Always make sure that you track the various waves from the rhythm strip through the other leads above them. By doing that, you can identify each deflection through the various leads.
From Arrhythmia Recognition: The Art of Interpretation, Second Edition, courtesy of Tomas B. Garcia, MD.
DescriptionLastly, let’s take a look at the morphology of the QRS complexes in leads I and V5-6. Leads 1 and V5-6 are actually monomorphic R waves with a notch at the top. This is a common finding in simple LBBBs.
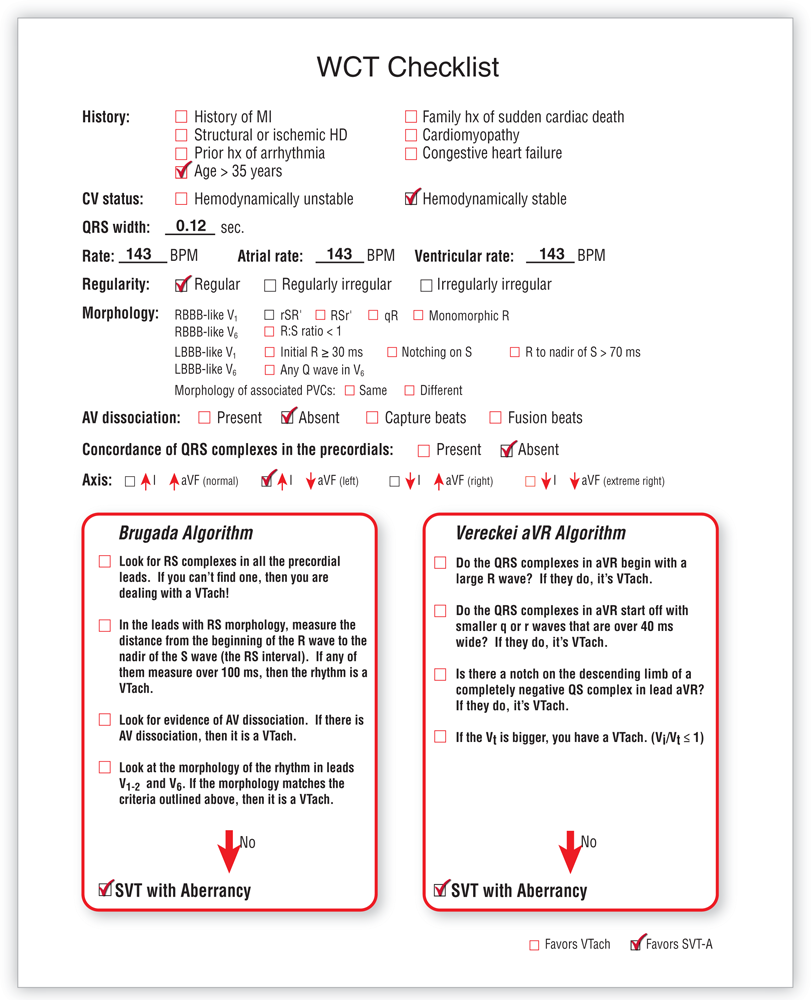
So, the $64,000 question: Is this VTach or an SVT-A? Well, if the rhythm were VTach, it would be a stable one. However, to answer the question appropriately, we have to look at the criteria and algorithms. Let’s turn to our checklist for that (Figure 37-13).

Figure 37-13 WCT checklist for case 3.
© Jones & Bartlett Learning.
DescriptionThe only historical information that we have on the checklist is that the patient is over 35 years old. The patient is hemodynamically stable and has no symptoms of a VTach whatsoever. The QRS complexes measure 0.12 seconds, making this is a bit narrow for an LBBB-like presentation. So, this would point us toward an SVT-A.
The heart rate of 143 BPM needs a list of possible diagnoses to be considered. Let’s start off with the easiest one and the one that, if it were an SVT-A, makes the most sense: sinus tachycardia. There is a P wave before each QRS complex associated with a normal PR interval. This could also be an atrial flutter, but there is no evidence for a second flutter wave. Focal atrial tachycardia would be a possibility if the pacemaker were located high near the sinus node, since the P waves are not inverted. The P-wave location and the P-wave axis also point away from an AVNRT. That’s good enough for now, so let’s move on.
The morphology of the LBBB on the screen does not match an LBBB-like picture in either V1 or V6. This would, once again, favor an SVT-A. The morphology of the associated premature ventricular contractions (PVCs) cannot be assessed because there are no PVCs anywhere. The last thing we want to mention related to morphology on this ECG is that this is a perfect match for an uncomplicated LBBB, which points us toward an SVT-A as well.
The cause of the aberrancy is another issue. We have to think about a preexisting BBB. This possibility seems the most logical one, since we said that this is classic LBBB. Rate-related aberrancy or those caused by the MP3s (metabolic, physiologic, paced rhythm, or pharmacologic causes) would give you a less classic appearance and probably complexes that would be a bit wider. So, most of the evidence appears to point us toward a sinus tachycardia with a preexisting BBB.
There is no evidence at all, either direct or indirect, that we are dealing with an AV dissociation. There is obviously no concordance in the precordial leads either. The axis lies on the borderline between the normal quadrant and the left quadrant. For our purposes, either one is fine since neither is a great indicator of a VTach versus an SVT-A. To be complete, the electrical axis of the heart, if you calculate it completely, is at –10°, isolating it to the left quadrant. All of these factors favor an SVT-A.
The Brugada algorithm is negative for each of the parameters we normally look for. The same is true of the Vereckei aVR algorithm, in which none of the parameters are met either. Both of these findings point to SVT-A as well.
The final answer is that this is a sinus tachycardia at 143 BPM in a patient with a possible preexisting LBBB (SVT-A secondary to a preexisting BBB). Finding an old ECG would definitely be helpful, but the patient denies ever having one done before. The patient would need a cardiology consult and possible admission for the evaluation of the new LBBB since we are not sure when it started. Better to assume the worst and have a live patient than to assume it has been there for a long time and get burned.