
Figure 37-18 ECG 1 for case 5.
From Arrhythmia Recognition: The Art of Interpretation, Second Edition, courtesy of Tomas B. Garcia, MD.
DescriptionHistory
Chief Complaint. Sudden onset of palpitations, shortness of breath, and sweating.
History of Present Illness. 64-year-old man states that for a couple of months prior to this presentation, he was having some increasing shortness of breath, felt some rapid palpitations at times, and was just not able to do as much as he normally did around the house. Today, the patient was shopping in a mall when he suddenly developed rapid, regular palpitations associated with an increase in his shortness of breath, moderate sweating, grade 3 out of 10 chest tightness without radiation, some nausea, and a feeling of needing to vomit. The patient states that the symptom complex was similar to the one he had approximately 4 years ago, stating that “they burned the surface of my heart to get rid of some sort of rhythm problem.” The patient states that he didn’t understand everything they said to him but that he had not had a heart attack at the time. The patient denied any recurrence of symptoms until 2 weeks ago when the symptoms reemerged.
Mall security called fire rescue, who stabilized the patient and brought him to the ED. Paramedics state they found the patient pale, diaphoretic, and in moderate respiratory distress. The patient was sitting in an upright position, not able to find a comfortable position. No cyanosis was noted. Blood pressure was 92/54 mm Hg; heart rate was 120 BPM, regular; and pulses were weak and thready but equal bilaterally. Patient was tachypneic at 24 breaths per minute, with shallow respirations and use of accessory muscles of respiration. Oxygen saturation was 84% on room air. During the initial setup, the patient stated that the palpitations stopped and his hemodynamic presentation improved quickly. He stated, however, that the chest pressure has persisted.
Cardiac Risk Factors.
Social History.
Past Medical History. As stated in the history of present illness, rhythm abnormality was noted 4 years ago. No prior ECGs or rhythm strips were available.
Family History. Patient’s uncle died at age 52 of a heart attack. No family history of sudden cardiac death.
Medications. Not available at this time.
Allergies. None.
Review of Systems.
Patient sleeps normally on one pillow but has been sleeping on three pillows for about a week. Patient denied paroxysmal nocturnal dyspnea, sputum production, fevers, blood in sputum, wheezing, or weight loss.
Physical Examination
General Appearance. Patient is in no acute distress, sitting upright. No pallor or cyanosis is noted. Patient was joking with the nurses and appeared to be in good spirits. Patient’s shirt was noted to be moist with sweat.
Blood Pressure. 118/68 mm Hg. Patient stated that the blood pressure numbers are low for him.
Heart Rate. 60 BPM, regular rate and rhythm, pulses normal bilaterally, equal and symmetrical.
Respiratory Rate. 16 breaths per minute, not using accessory muscles of respiration.
Lungs. Patient’s thorax is symmetrical with normal excursions. Percussion revealed a small amount of dullness at both bases. Breath sounds are decreased in the lung bases bilaterally, and coarse crackles are noted there. No wheezes or rubs are noted.
Oxygen Saturation. 98% on 2 L via nasal cannula.
Cardiac. Patient has no signs of cyanosis or pallor. Clubbing is noted on the fingertips. Jugular venous pressure is elevated at a 45° incline. No cannon A waves are visible. Arterial pulses are weak but equal and symmetrical bilaterally. No palpable thrills or heaves are noted. S1 and S2 are normal, with an S3 present. No murmurs are noted.
Extremities. Grade II pitting edema of bilateral lower extremities is noted. Pulses are normal.
Preliminary Thoughts Based on the History and Physical Exam
During the past episode, the patient’s past medical history was classic for a patient who suffered an arrhythmia with associated complications. The patient is a poor historian, but he clearly states that the physicians at the time said he did not have a heart attack. He was admitted to the hospital, however, for a rhythm disturbance and he had the surface of his heart “burned.” For us to completely understand what was going on, we must translate the information into medicalese. Using our powers of deductive translation, the patient stated he had an arrhythmia requiring a visit to the electrophysiology lab to ablate the inciting focus.
Although it would be nice to have the old chart, none is available at the time. This is not a big loss, however, since you should always formulate your own opinion first, then read the chart. As a matter of fact, one of the top Garcia founding principles is, Don’t get used to performing a chart autopsy before you see a patient! Remember, the person or persons who wrote the chart may have wrong information or may have formulated the wrong diagnoses. Charts can be dangerous, as they commonly perpetuate false information over and over. Remember, your patients don’t need an automaton; they need a knight in shining armor who will fight for them. More on this as this case develops . . .
The patient’s progressively increasing congestive heart failure (CHF) symptomatology with some transient palpitations for the past couple of months, together with his prior history of a rhythm disturbance and ablation, suggest that the symptoms could represent a recurrence of a long-standing incessant tachycardia. The additional stress placed on the heart by the constantly present rapid rates leads to overuse beyond the normal cardiac functioning parameters, leading to failure and CHF-like signs and symptoms.
How does an incessant tachycardia cause heart failure, you ask? Well, think about your car for a second. If your car is turned off, the engine isn’t burning fuel or causing any heat or energy production at all. It can stay like that forever as long as it is lubricated and maintained. Now, suppose you turn on your car and just let your engine idle. When the engine idles, it will usually be running at approximately 600 to 800 revolutions per minute (RPM). If you ran it at 800 RPM, your car would burn fuel, creating energy and slowly but progressively creating more heat, overheating your lubricant and increasing your chances of metal and/or component failure. Pushing on the pedal a bit more, however, will rev up your engine to higher RPMs, say to 2,000+ RPM. What do you think the engine temperature and metal stress will do if you ran your car at that level for an hour or so without cooling it? The short answer is, you’re going to go broke paying your mechanic. The same principles apply to your heart, except your heart may have to work that hard for days, weeks, or even months. Run it at high speed for a long time and it will fail.
The main incessant tachycardias that can lead to CHF include focal atrial tachycardia (especially rapid focal atrial tachycardias with block), permanent junctional reciprocating tachycardia (a childhood form of orthodromic atrioventricular reentry tachycardia [AVRT]), and congenital His bundle tachycardia (which is another childhood tachyarrhythmia). Since our patient is 64 years old, it’s pretty safe to assume that focal atrial tachycardia is at the top of that list. Focal atrial tachycardias and focal atrial tachycardias with block are typically at the tachycardic end of a spectrum of atrial rhythms. The patient can be anywhere along that spectrum for weeks or months, or the event could be transient. Since the patient had 2 weeks of progressive CHF, it seems that his heart has been on overdrive for at least that length of time.
OK, we’re almost done here. We have come up with a great diagnostic possibility and figured out the most probable causative mechanism to account for the patient’s decompensation. We didn’t even need the old chart to give us a solid shove on our way. That would be great except for the little nagging thing that is called your clinical gut. In the words of Carly Simon, “Something’s wrong here and we just can’t deny it.” What have we missed?
Since this is a text for beginners and intermediate students, we have tried to bring you to a deeper understanding, not only about arrhythmia recognition, but also on the mindset of being a clinician and using deductive reasoning. We gave you some clinical pearls, like follow your gut, always look at the “company it keeps,” make a list of possible diagnoses, and put all the information together. Well, your clinical gut is now telling you that you are overlooking the last two items on that list.
Even though the events of today were similar to those that occurred 4 years ago, there was one glowing difference. During the previous episode, the patient’s symptoms all improved when the rhythm was broken. Is that what the patient related today? If you read the paramedic’s notes, they clearly state that the patient’s chest tightness has persisted despite clinical improvement of the hemodynamic status. Could the patient’s symptoms be consistent with an unstable angina presentation that has culminated today with an AMI? Shouldn’t that be included in your differential diagnosis for a 64-year-old patient with progressive CHF-like symptoms who suddenly developed a new episode today of substernal chest tightness, diaphoresis, shortness of breath, palpitations, nausea, and a feeling of the need to vomit?
The patient’s symptoms are all consistent with ischemia either caused by an actual blocked coronary artery or due to relative ischemia secondary to the arrhythmia. Note, however, that almost all of these are subjective symptoms. There is only one physical sign that can be objectively verified on that list: diaphoresis. Diaphoresis, especially one that causes soaked clothes, is a classic sign of an MI probably due to sympathetic discharge. If diaphoresis does occur during an arrhythmia, it usually doesn’t make your clothes soaked. This finding markedly increases the chances that this patient is having a “true” AMI, in addition to or due to an arrhythmic event of unknown duration.
Coronary steal syndrome is a situation in which there is a rerouting of the coronary circulation around an area of obstruction leading to an area of ischemia. Let’s take a closer look at what happens in these cases. Basically, it starts with a condition requiring an increase in blood and oxygen delivery to the heart. Take for example, the relative hypoperfusion that occurs during the tachyarrhythmias when the increased oxygen demand of the myocardium due to the high rates overshadows the actual amount of oxygen delivered.
To add insult to injury, if any artery has a partial obstruction to flow, the resistance of the blood moving through that vessel will be higher than that seen in clean and open vessels. Blood, being a fluid, will always choose to travel through the path of least resistance. In this case, that path is through the clean coronary arteries. The net result is that the tissue perfused by the blocked artery will receive even less blood flow and be even more ischemic, leading to myocardial stunning and, eventually, infarct.
The events at the mall were witnessed and documented by the paramedics, and it is proof of a rhythm disturbance leading to hemodynamic instability. So far, through the history and physical exam, we have been able to narrow our focus down to three main possibilities:
Electrocardiogram 1
The ECG on initial presentation to the ED is shown in Figure 37-18. The ECG is obviously not a WCT since the rate is only 63 BPM. However, there are a few interesting findings on this ECG that you should be able to spot.
Figure 37-18 ECG 1 for case 5.
From Arrhythmia Recognition: The Art of Interpretation, Second Edition, courtesy of Tomas B. Garcia, MD.
DescriptionThe first thing we notice when we look at this ECG is that the QRS complexes are wide. The wide complexes measure 0.14 seconds to be exact. Whenever we come across a wide-complex rhythm, we must decide if we are dealing with an RBBB, an LBBB, or something else (meaning an intraventricular conduction delay). Looking at lead V1, we see positive complexes. Next, we look at leads I and V6 to see if there are any slurred S waves. Both of these criteria are there; this confirms that we are dealing with an RBBB pattern.
The next question to ask yourself relates to concordance of the ST-T waves to the terminal portion of the QRS complex (these are basic ECG interpretation issues and not necessarily arrhythmia issues). This is the best way to determine ischemia/injury/infarct in a BBB pattern. For now, we’ll give you the answer and tell you that leads V1-5 are classic for an anteroseptal infarct with lateral extension in a patient with an underlying RBBB. So, this patient is having an AMI!
Note, as stated previously, the concordance of the components of the QRS-ST-T wave requires a more advanced knowledge of electrocardiography in general. For this, we recommend that you pick up our companion text, 12-Lead ECG: The Art of Interpretation. We know that this is a cheap plug, but we do feel that this is the best text on the market to teach you how to read an ECG from start to finish.
The rhythm present on the ECG is the next thing we need to look at. To help us with that, we turn our attention to the P waves. Notice in Figure 37-18, the P waves are inverted in leads II, III, and aVF. The PR intervals are in the normal range. Could they be retrogradely conducted P waves from a junctional complex? No, because they are too far ahead of the QRS complex to be due to a simple retrograde mechanism. In other words, we are dealing with an ectopic atrial pacemaker. Since the rate is 63 BPM and the P waves are inverted, we are dealing with an ectopic atrial rhythm.
For your convenience, we have marked the ectopic atrial beats with the blue arrows in Figure 37-19. The red arrows represent a morphologic variant found within the QRS complexes themselves. These do not represent buried P waves but are simply “bumps” caused by the forces that create the QRS complexes.
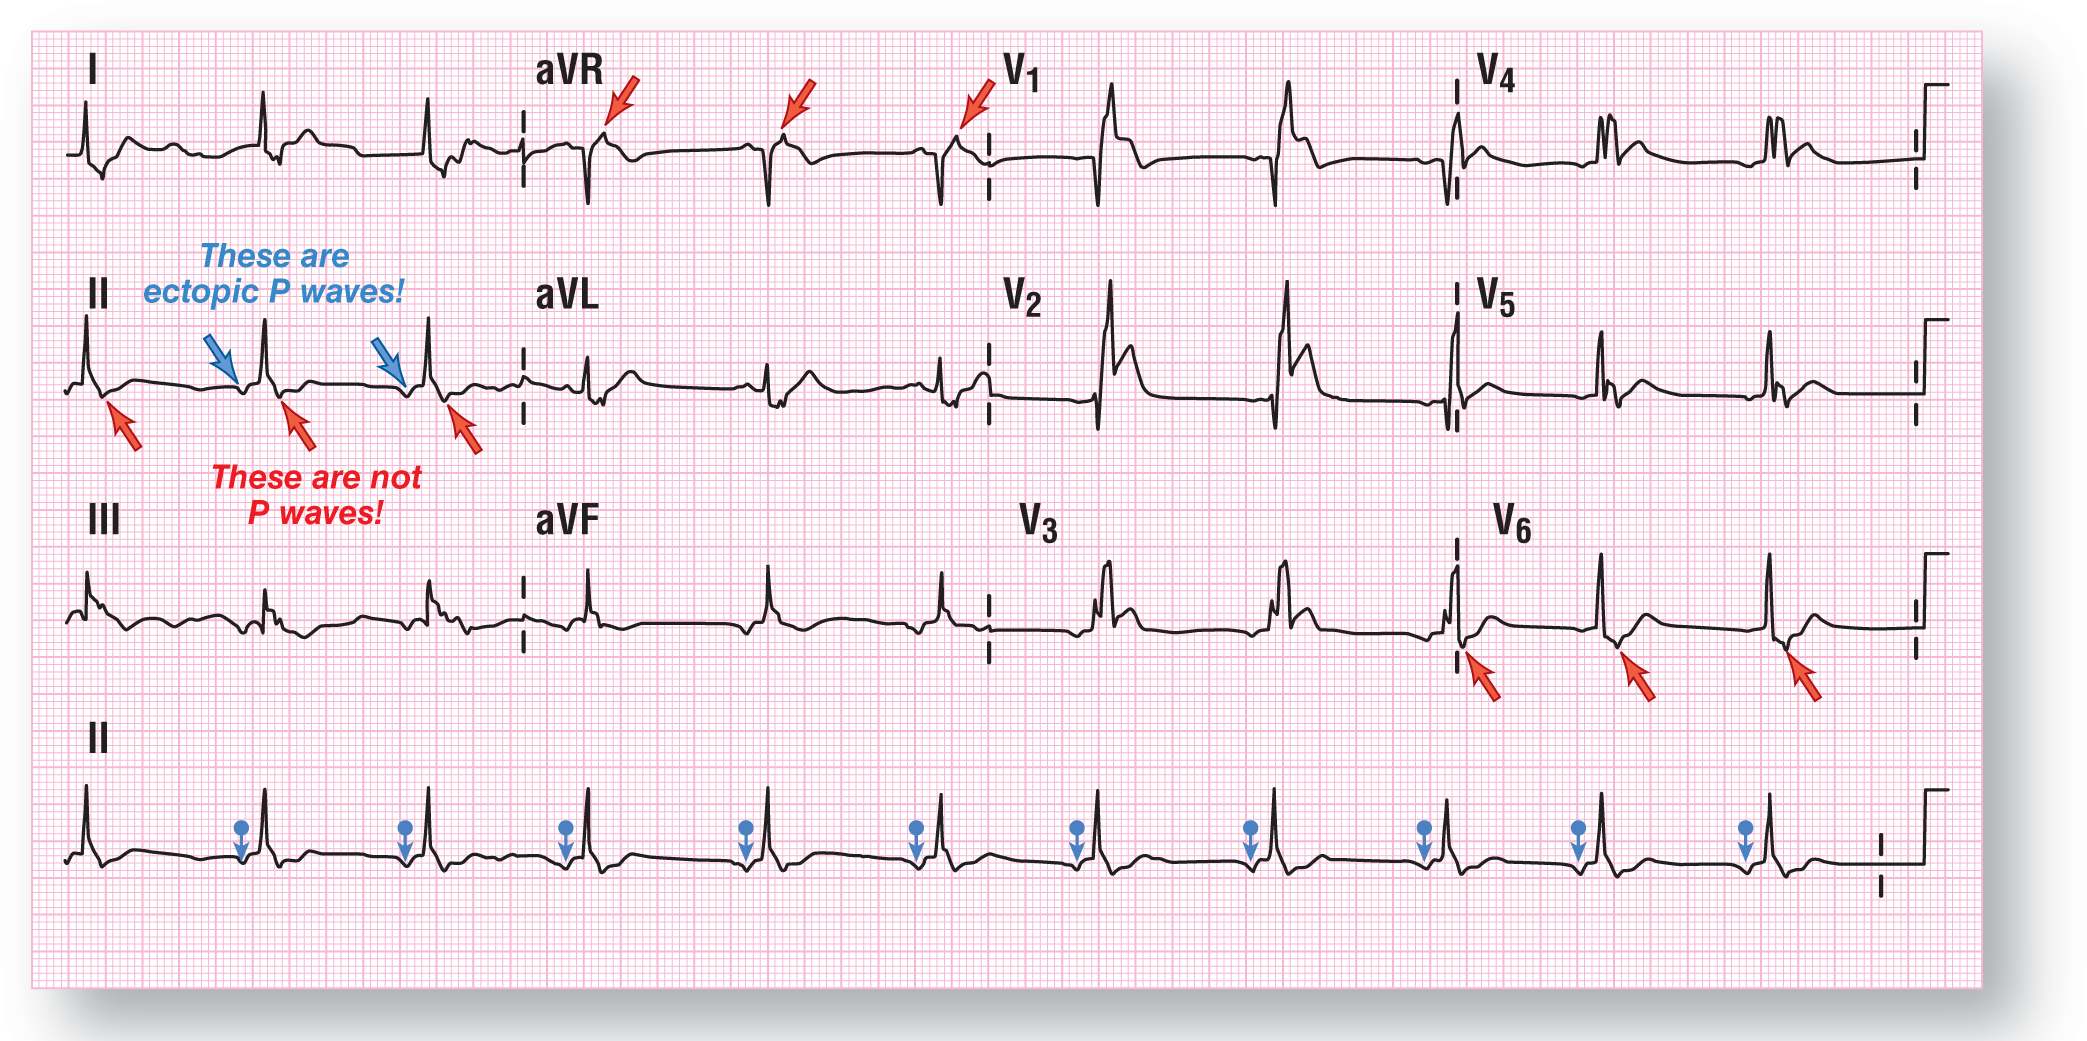
Figure 37-19 The blue arrows point to the inverted P waves of the ectopic atrial rhythm. The red arrows represent a morphologic variant found inside the QRS complexes themselves. These are not buried P waves.
From Arrhythmia Recognition: The Art of Interpretation, Second Edition, courtesy of Tomas B. Garcia, MD.
DescriptionADVANCED
AUTHOR’S NOTE
As an advanced point for advanced interpreters. This ECG does show a markedly shortened QT interval with a QTc of 301 ms by the Fridericia criteria. This finding could represent a short QT syndrome that has an association with sudden cardiac death. Any patient with short QT syndrome should be referred to an electrophysiologist for further evaluation.
Impression After Evaluating ECG 1. ECG 1 has verified that the patient both has an ectopic atrial rhythm and is in the midst of having an AMI. Treatment for the AMI was instituted and the PCI team was called in for emergent intervention to reverse the blockage.
While waiting for the PCI team to arrive, the patient was noted to have a change in the rhythm and he began to complain of palpitations and shortness of breath. The patient remained hemodynamically stable throughout this period, but the heart rate was noted to have increased to approximately 125 BPM.
A repeat ECG was obtained.
Electrocardiogram 2
The patient is presently having a WCT with a QRS width of 0.17 seconds and a ventricular rate of 125 BPM (Figure 37-20). The morphology of the complexes has shifted somewhat, with some more fragmentation of the QRS complexes in various leads. However, the main electrical axis has remained stationary in the normal quadrant. The QRS interval and the QT interval are both highlighted by the blue and green boxes, respectively (Figure 37-21).
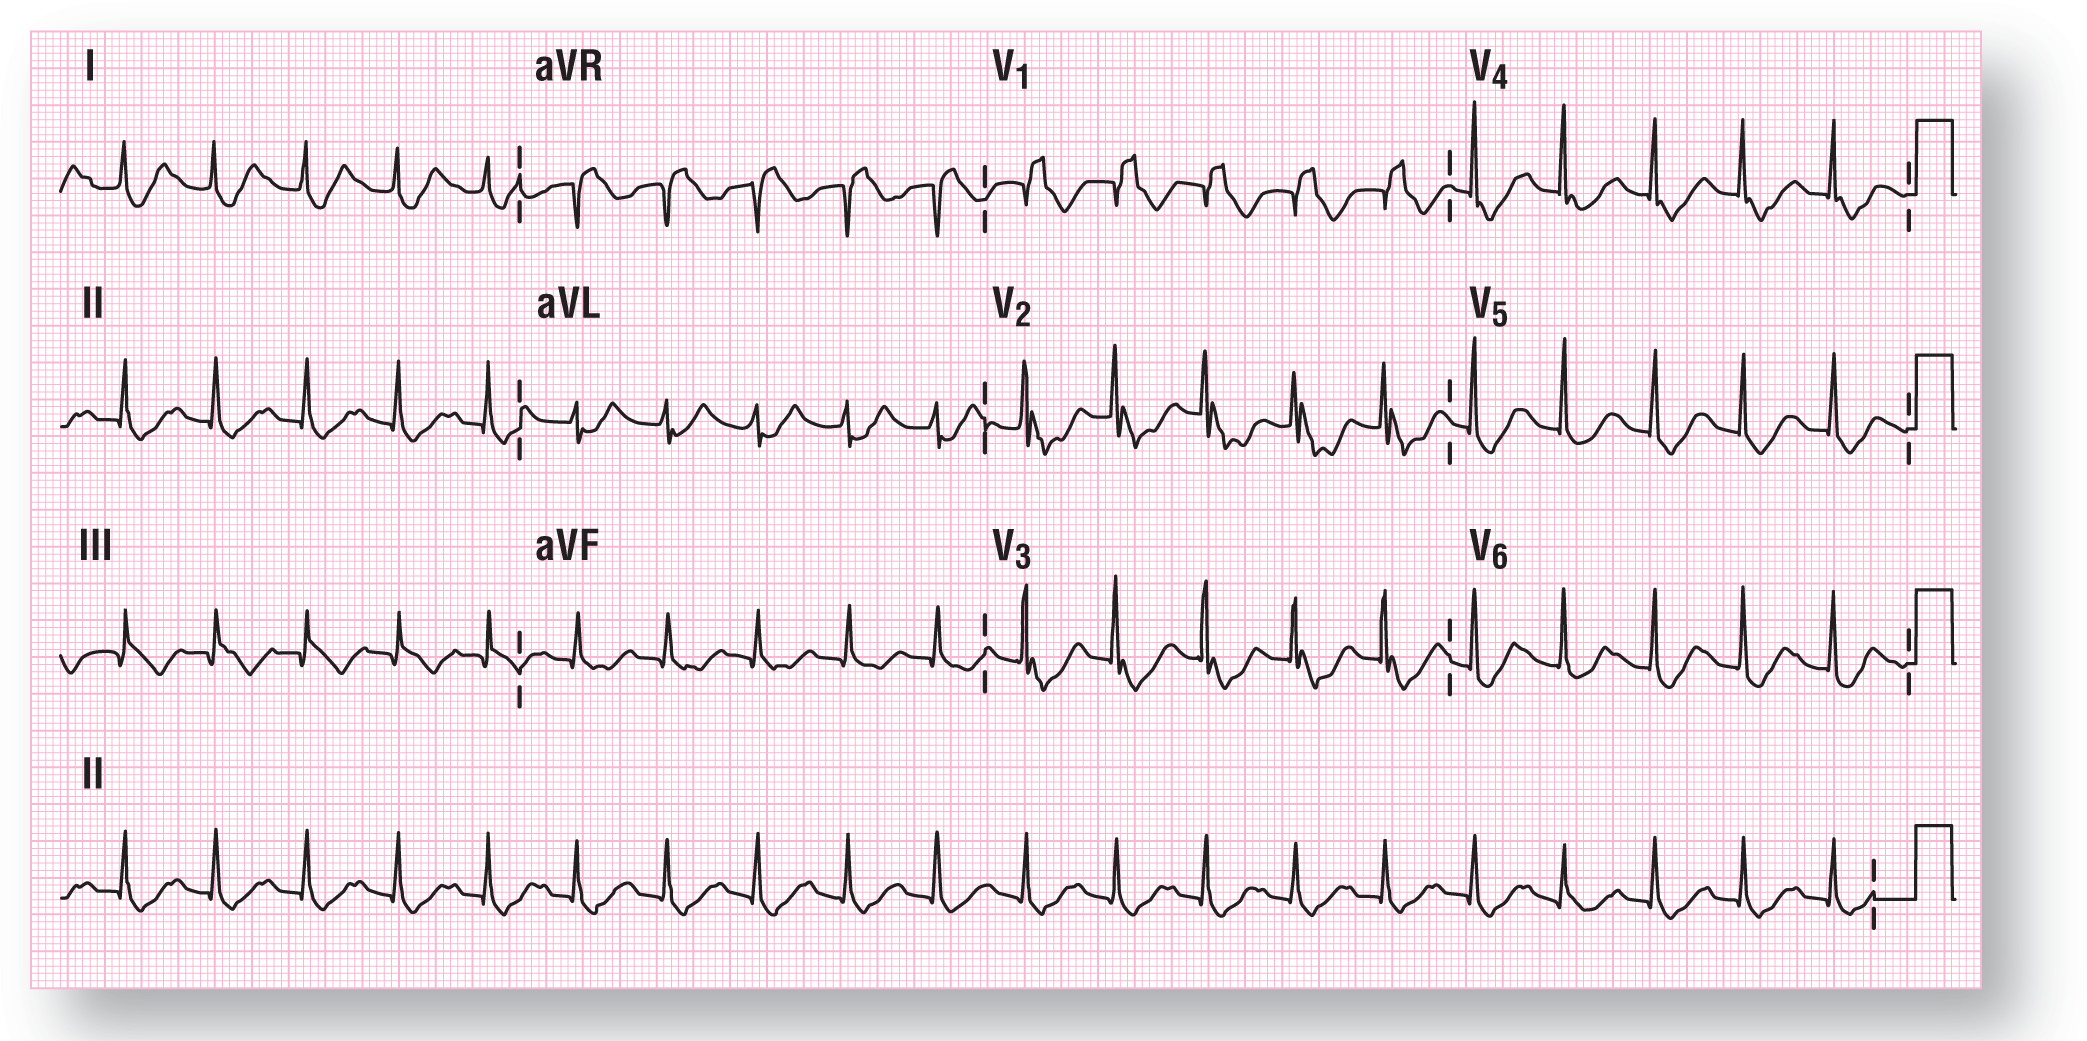
Figure 37-20 ECG 2 for case 5.
From Arrhythmia Recognition: The Art of Interpretation, Second Edition, courtesy of Tomas B. Garcia, MD.
Description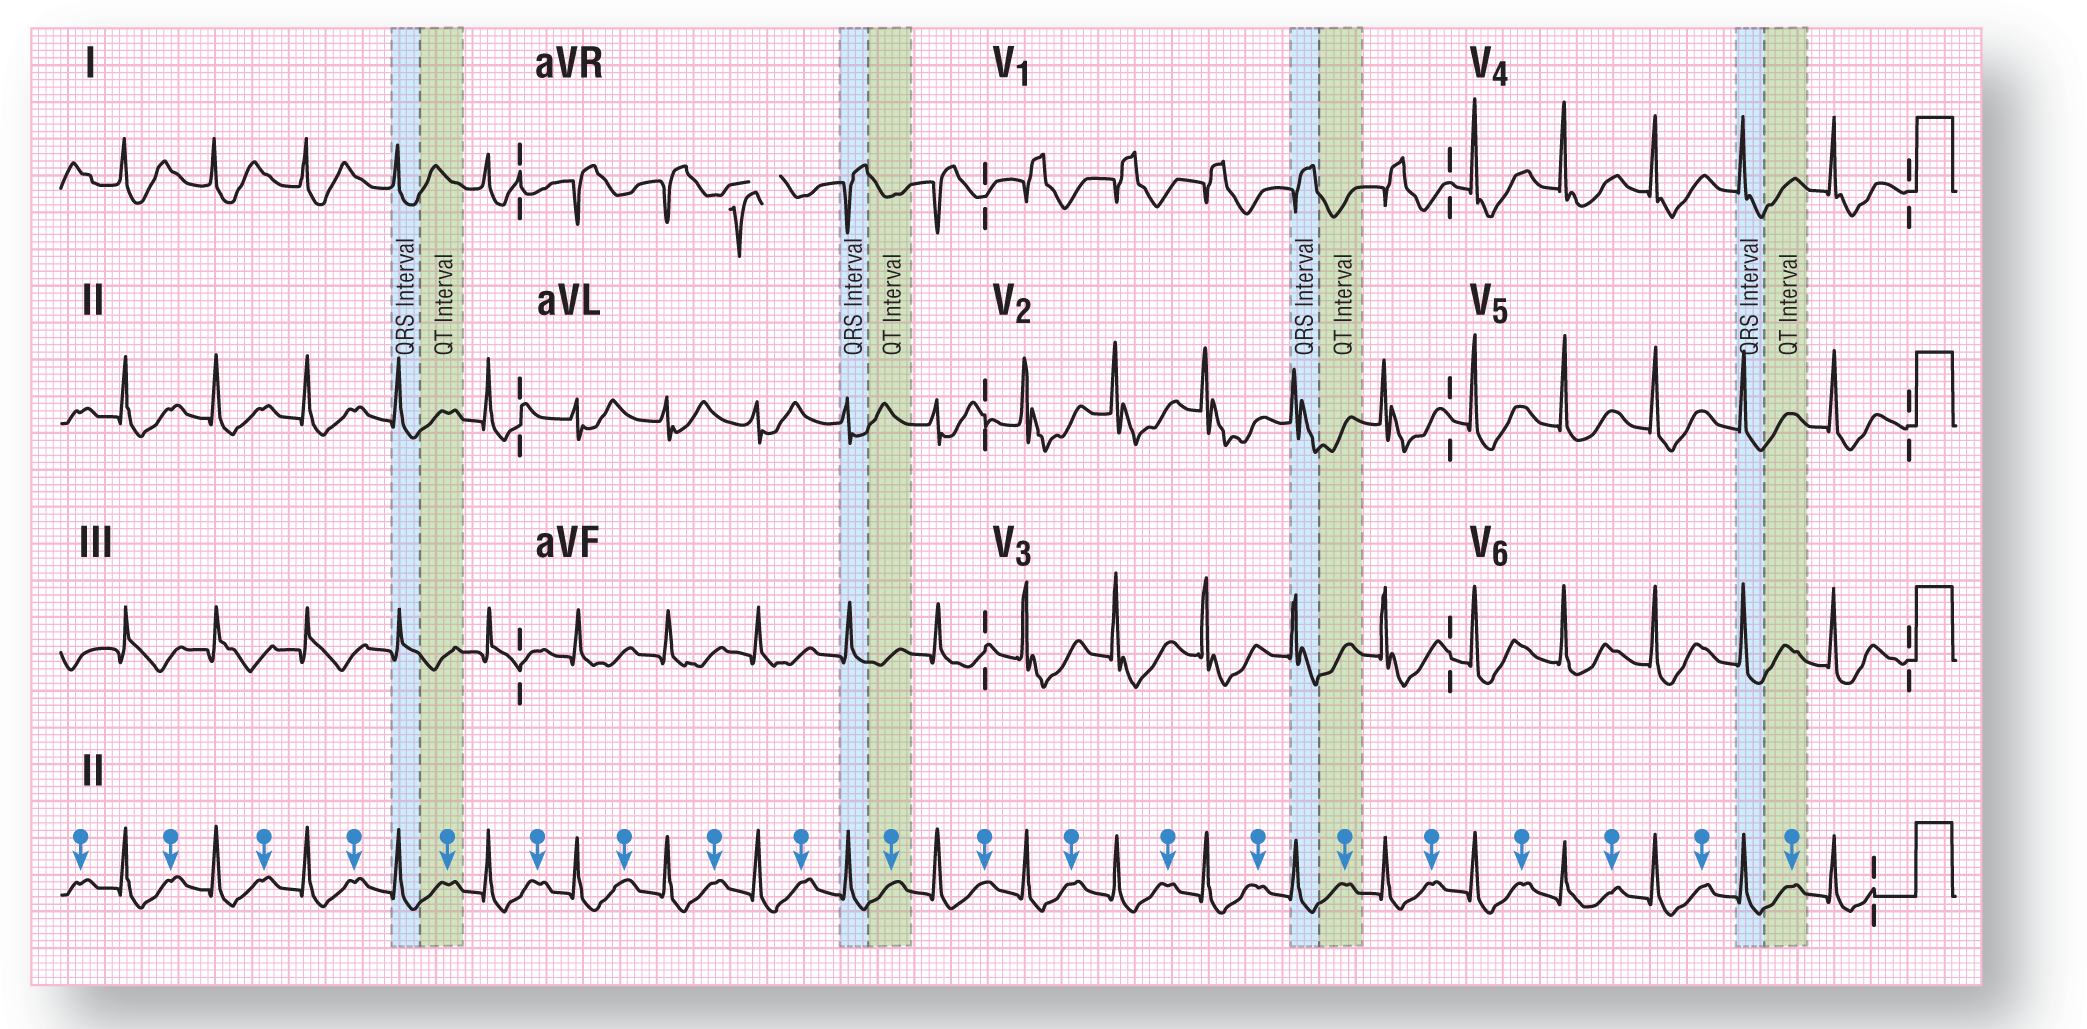
Figure 37-21 The blue arrows identify the inverted P waves buried within the P waves of the preceding complexes. The QRS and QT intervals have been identified as well.
From Arrhythmia Recognition: The Art of Interpretation, Second Edition, courtesy of Tomas B. Garcia, MD.
DescriptionOther than the tachycardia, the biggest change has been in the location of the P waves. They remain inverted but are now clearly seen at the apex of the T waves (see Figure 37-21). The change in rhythm created the longer PR and RP intervals associated with these complexes. Note that the inverted P waves fall almost halfway between the two QRS complexes. So, what is the rhythm?
To be thorough in evaluating the arrhythmia in ECG 2 of case 5, remember that if you are dealing with any arrhythmia and you see a P wave halfway between two QRS complexes, there could be a buried P wave hiding inside the QRS complex between them. This principle is known as Bix’s rule. (We covered this rule in greater detail in the Clinical Pearl box on page 242. We urge you to revisit the page and review the material prior to moving on with this case.) We should always take the time to try to isolate the possibility of any buried P waves on a strip. Let’s do that now.
In Figure 37-22, we see the blue arrows representing the inverted P waves. If we divide the distance between those in half, we see that there is a deflection in the downstroke of the R wave in lead II and others. That deflection comes out of nowhere and is probably reflective of a buried P wave. This makes the atrial rate 250 BPM, and the conduction ratio of the atria to the ventricles is 2:1.

Figure 37-22 Closeup of the lead II rhythm strip showing the obvious inverted P waves on the peaks of the T waves (marked by blue arrows). Using Bix’s rule, we calculate the distance between the obvious T waves and divide that Figure in half (see green arrows). Finally, we look at the spot directly in the middle and note that there is an unexpected deflection in the downstroke of the R wave, which probably indicates a buried P wave (see red arrows).
From Arrhythmia Recognition: The Art of Interpretation, Second Edition, courtesy of Tomas B. Garcia, MD.
An SVT-A can easily occur at 250 BPM with a 2:1 conduction and could be either due to an atrial flutter or an ectopic atrial tachycardia with block. Can we definitively state which one is found in our ECG? Unfortunately, no. On the one hand, as we discussed before, focal atrial tachycardias frequently break down into atrial flutters. On the other hand, the fact that the inverted P waves are clearly visible at the top of the T waves, the buried P waves, the lack of a continuously undulating baseline, and the close morphologic similarities between this ECG and the one in ECG 2 of case 5 all point us in the direction of focal atrial tachycardia with block. However, in most cases when the rates overlap at the 240- to 250-BPM atrial range (like in this case), making a call with 100% certainty on a surface ECG is almost impossible. Electrophysiology studies would definitely be recommended on this patient to evaluate the exact nature of this arrhythmia.
Even though we are strongly leaning toward the diagnosis of an SVT-A secondary to a preexisting BBB, we will take a look at what our checklist can tell us (Figure 37-23). Fill out your checklist and then compare it to ours.

Figure 37-23 WCT checklist for ECG 2 for case 5.
© Jones & Bartlett Learning.
DescriptionThe checklist provides a mixed bag of information on this ECG. There are some things that favor SVT-A and some that favor VTach. However, note that both algorithms are in complete agreement on the answer.
Let’s start off with the history subsection. Five of the seven points favor VTach. In reality, the actual patient history and physical do favor CHF symptoms, but the patient states that he did not notice any peripheral edema in his lower extremities. The chest x-ray and/or an echocardiogram will add some valuable information in any case.
The patient is hemodynamically stable at this time, even though he does have an elevated heart rate and some minimal symptoms. This favors the diagnosis of SVT-A. The rhythm remains regular since the last ECG. A qR wave is identifiable in lead V1, but the q wave is isolated to that one lead. Note that the ST-T wave abnormalities suggestive of an infarct pattern on the first ECG are not present on this one.
The concordant pattern in the precordial leads remains present and unchanged from the previous ECG, favoring the possibility of an underlying VTach. However, there is no direct or indirect evidence of AV dissociation present, which would be much more specific and supportive of that diagnosis. Finally, the electrical axis remains unchanged, as previously mentioned.
Impression after evaluating ECG 2. There has been a rhythm change since ECG 1, with a clearly identifiable WCT. The similarity of the morphology and orientation of the waves throughout the various leads is not dramatic by a long shot. The lack of change in the morphology and the classic appearance of an RBBB definitely are the strongest factors favoring an SVT-A in our opinion. This was verified by both the Brugada and the Vereckei aVR algorithms.
The patient’s hemodynamic status, though a bit more symptomatic, was still hemodynamically stable. Due to the presence of the AMI and the fact that focal atrial tachycardia with block rarely responds to therapeutically applying vagal maneuvers or adenosine IV push, implementation of these measures was not attempted, as they could worsen the situation. However, before additional therapy could be instituted, the patient’s symptoms and the patient’s hemodynamic status worsened dramatically. The monitor showed another shift in the rhythm, and a third ECG was obtained while emergent management was immediately started.
Electrocardiogram 3
This ECG definitely shows a WCT at approximately 188 BPM (Figure 37-24). Once again, there is an RBBB appearance, although it should be called an RBBB-like appearance to be more accurate. The axis of the heart has shifted to the left quadrant, which is a dramatic change from the previous one. The only other statement that you can definitively make is that the rhythm is very regular.

Figure 37-24 ECG 3 for case 5.
From Arrhythmia Recognition: The Art of Interpretation, Second Edition, courtesy of Tomas B. Garcia, MD.
DescriptionAlmost all of the QRS complexes’ morphologic appearance is obliterated and no discernable P waves are clearly evident. The lack of a discernible morphologic appearance of the QRS complexes is consistent with a ventricular flutter pattern. Note that the blurring of the morphology begins to occur around the 200-BPM range, which is similar to the rates seen on this ECG. Due to the lack of any identifiable features, filling out the WCT checklist on this ECG would be worthless.
For the sake of completeness, an argument could be made that the baseline fluctuations right before the QRS complexes in leads II and V1 are actually P waves (inverted or not), but that would be strictly conjecture. Another possibility that we cannot rule out is that we are dealing with an antidromic AVRT. Based on the presentation, however, this possibility remains very unlikely.
In closing, this ECG shows a pattern consistent with a ventricular flutter. The large axis shift greater than 40° also goes along with identifying this rhythm as being a ventricular tachycardia/flutter.
The final sequence of events from start to finish cannot be ascertained with 100% certainty. However, we can make a pretty good educated guess. The patient’s chart verified his story that he had developed a symptomatic macro-reentrant atrial tachycardia approximately 4 years ago that was successfully ablated at the time.
The patient’s history of a couple of months’ progressive deterioration in his cardiac function associated with transient episodes of palpitations were probably caused by a recurrence of his focal atrial tachycardia. Recurrences are not common, but they do occur in these cases. The incessant tachycardia complicated a fairly advanced blockage of his arteries, leading to relative ischemia and further myocardial damage.
The stress of walking through a large mall exacerbated his condition, causing his AMI and his acute presentation today. The AMI in turn was either caused by his arrhythmia or worsened by the arrhythmia, which worsened the hemodynamic status, which worsened the heart, and so forth, and so forth, and so forth. This process continued until the rhythm spontaneously converted, allowing partial recovery of his hemodynamic status. That accounts for the marked and rapid improvement that was witnessed by the paramedics. The AMI, however, continued brewing in the background, causing further deterioration and damage until the sequence repeated itself completely in the ED.
Thankfully, the patient was in the right place at the right time, and he was successfully defibrillated immediately after the onset of the ventricular flutter. The patient initially converted into a sinus bradycardia with subsequent deterioration of that rhythm occurring within minutes, causing him to go back into his ectopic atrial rhythm. The patient was taken to the cath lab, where he was found to have multivessel involvement with complete resolution of the AMI symptoms after stenting. Echocardiogram subsequently showed an ejection fraction of 35% with a regional wall motion abnormality in the anterior wall consistent with an infarct. The patient was subsequently taken to the electrophysiology lab again, and the arrhythmia was successfully treated with ablation therapy.
References
1. Stewart RB, Bardy GH, Greene HL. Wide complex tachycardia: misdiagnosis and outcome after emergent therapy. Ann Intern Med. 1986;104(6):766-771.
2. Steinman RT, Herrera C, Schuger CD, Lehmann MH. Wide QRS tachycardia in the conscious adult. Ventricular tachycardia is the most frequent cause. JAMA. 1989;261(7):1013-1016.
3. Baerman JM, Morady F, DiCarlo LA Jr, de Buitleir M. Differentiation of ventricular tachycardia from supraventricular tachycardia with aberration: value of the clinical history. Ann Emerg Med. 1987;16(1):40-43.
4. Tchou P, Young P, Mahmud R, Denker S, Jazayeri M, Akhtar M. Useful clinical criteria for the diagnosis of ventricular tachycardia. Am J Med. 1988;84(1):53-56.
5. Garner JB, Miller JM. Wide complex tachycardia—ventricular tachycardia or not ventricular tachycardia, that remains the question. Arrhythm Electrophysiol Rev. 2013;2(1):23-29.