Chapter 2
On the Nature of Returns
Occam’s Razor
The preacher Ecclesiastes said, “There is no remembrance of things past; neither shall there be remembrance of things to come.” That philosophy is doubtless sound for investors concerned about the erratic, unpredictable, short-term volatility in the U.S. financial markets. But in developing a long-term investment strategy, remembering the past is essential, because it can help us to understand the forces that drive security prices. When we subject financial realities to reasoned analysis, we gain insights into the sources and patterns of the long-term returns produced by stocks and bonds in the past. Those insights can provide a sound basis for determining the nature of future returns. What is more, they can form the basis for rational discourse about investing in the years ahead.
Sir William of Occam, a fourteenth-century British philosopher, is responsible for the insight that the simpler the explanation, the more likely it is to be correct. This postulate has come to be known as Occam’s Razor, and I have used it in the analytical methodology with which I approach the financial markets. Wielding Sir William’s razor, I have shorn my methodology of all complication, paring the sources of investment return down to three essential components. This analysis takes into account my conviction both that the performance of individual securities is unpredictable, and that the performance of portfolios of securities is unpredictable on any short-term basis. While the long-term performance of portfolios is also unpredictable, a careful examination of the past returns can help establish some probabilities about the prospective parameters of return, offering intelligent investors a basis for rational expectations about future returns.
The application of Occam’s Razor to the financial markets is most appropriate for investors who select broadly diversified mutual funds run at modest cost, and who hold them for the long term. The full market returns presented in this chapter reflect gross returns, but investors as a group inevitably earn less. (Recall the discussion of investment costs in Chapter 1.) So, whatever market returns we expect, we must reduce them by up to two percentage points (or more) to account for those costs.
Because long-term investment returns are conventionally measured by market indexes tracking the broad U.S. stock and bond markets, my analysis has the greatest direct relevance to index funds that follow these same benchmarks. (Index funds are discussed in Chapter 5.) Diversified stock funds that emphasize corporations with large market capitalizations, along with funds investing in high-grade bonds, also fit nicely into this analysis. In both cases, the gap between fund returns and market returns is minimized by those funds that have the lowest costs.
Occam’s Razor and the Stock Market
Our discourse begins with a journey of nearly 200 years’ duration. As we learned in Chapter 1, since 1802, annual real (after-inflation) returns on stocks have settled near an average of 7 percent, though with awesome interim variation—a high of 67 percent in 1862 and a low of -39 percent in 1931. Huge though it may be, that range of 106 percentage points can serve as a powerful reminder of short-term risk in the stock market, even as 7 percent has proved a remarkably consistent standard for the market’s long-term return.
Figure 1.2 showed the returns earned by stocks during this period of nearly two centuries. An investment of $10,000 in stocks early in 1802, growing at an average real rate of 7 percent, would now be worth a cool $5.6 billion in real (inflation-adjusted) dollars. Let’s now consider Professor Siegel’s data over a somewhat shorter time frame, breaking the returns down into 25-year increments.
TEN YEARS LATER
25-Year Returns on Stocks
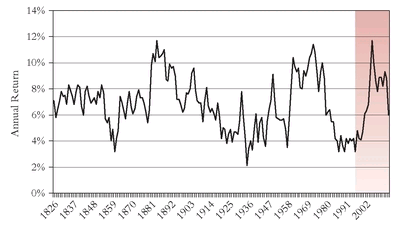
Given the strong markets of the 1980s and 1990s, the 25-year real returns on stocks continued to accelerate. The 11.7 percent annual return for the quarter-century ended in 1999 matched the all-time peak reached in 1882 and was slightly above the previous modern-day high reached in 1967. Then, after the bear market of 2000-2002, the rolling 25-year return fell to 7.8 percent, dropping further to 6 percent for the 25 years through mid- 2009, close to the long-term average of 6.5 percent, but only about one-half of the peak quarter-century.
As time gradually eliminates the ebullience of those earlier bull markets, 25-year returns are virtually certain to decline further. For example, if stock market annual returns aver age, say, 6.5 percent during the next 15 years (an assumption,
not a forecast), in 2024 the 25-year return would fall to about 2 percent annually, a weak return that would be even lower than the earlier valleys of about 3 percent, reached in 1859, 1953, and 1981-1990 (inclusive), and even below the 2.1 per cent level reached in 1931. The data presented in
Figure 2.1 confirm unmistakably that historic patterns repeat themselves over time; however, knowing in advance
when these peaks and valleys will occur is not within our competence.
FIGURE 2.1 Rolling 25-Year Real Stock Returns (1826-2008)
The huge 106-percentage-point range of stock returns from high to low over 196 individual years contracts to a very much narrower range when viewed in increments over 172 overlapping 25-year periods, as
Figure 2.1 shows. In each of those periods, real annual returns on stocks fell within a positive range of 2 percent to 12 percent. (In no 25-year period were the returns negative.) In two-thirds of the cases, annual returns fell within a range of 4.7 percent to 8.7 percent, two percentage points on either side of the norm, establishing the standard deviation of real annual returns at 2 percent.
What explains these returns? Where did they come from? What is their nature? Why do the variations shrink with the passage of time? As it turns out, equity markets have certain seemingly eternal characteristics. As the time frame increases from a single year to a 25-year period, the powerful short-term influence of speculation recedes, and investment returns conform much more closely, if not precisely, to the investment fundamentals: dividend yields and earnings growth. Together, these two elements constitute the driving force for stock returns, and we can trace the impact of those two fundamentals with some considerable accuracy beginning in 1871, the first year of a careful study conducted by the Cowles Commission during the 1930s.
We can use the historical data to answer a simple question:
Why have stocks provided long-term real returns of 7 percent? Answer: Almost entirely because of the rising earnings and dividends of U.S. corporations.
d The sum of real dividend yields and earnings growth generated during 1871-1997, adjusted for inflation, equals 6.7 percent in real terms. In other words, the total long-term real return on stocks derived from dividend yields and earnings is virtually identical to the 7 percent real return actually provided by the stock market itself. All other factors combined have almost inconsequential impact on the returns provided by these two fundamental factors alone.
There were, to be sure, significant variations around this norm. They were caused by the fluctuations in the valuations that investors were willing to pay for $1 of earnings—the price-earnings (P/E) ratio. This speculative factor has often proven powerful enough to add as much as four percentage points annually to the fundamental return, or to reduce it by an equal amount. Over a 25-year period, for example, an increase in the price-earnings ratio from 8 to 20 times will add four percentage points to return; a drop from 20 times to 7 times will do the reverse. The difference between the fundamental and the actual return on stocks, then, is accounted for by the element of speculation—the changing valuation that investors place on common stocks, measured by the relationship between the stock prices and corporate earnings per share.
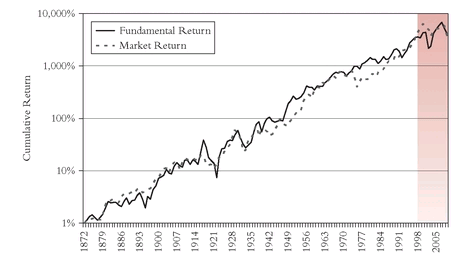
Figure 2.2 makes crystal clear the overpowering role of fundamental returns in determining the actual returns earned on stocks over the long run. In this chart, comparing the cumulative returns generated by the fundamentals and the returns of the stock market during the 1872-2008 period, the lines diverge over and over again, only to return to convergence. These divergences to and fro are explained by changes in the price- earnings ratio, but the fundamentals clearly dominate the relationship.
FIGURE 2.2 Fundamental Return versus Market Return (1872-2008)
TEN YEARS LATER
Investment Returns—Total Stock Market versus Fundamental Return
The dominant role of fundamental returns—the sum of the initial dividend yield and the subsequent rate of earnings growth—in shaping stock market returns was (hardly surprisingly) reaffirmed during the period that began in 1997. While speculation drove the cumulative market return well above the comparable fundamental return (which I also define as investment return) through early 2000, the two figures converged in 2002-2003. Then, in 2009, as the financial crisis that began in 2007 and the subsequent economic recession took hold, dividends were cut by some 20 percent and corporate earnings were crushed. Fundamental returns turned negative, and market returns followed, keeping our two indicators at cumulative levels that were virtually identical by mid-2009: annualized long-term fundamental real return, 6.2 percent; long-term stock market return, 6.1 percent.
The events of the recent era demand that we consider the important distinction between two kinds of corporate earnings: (1) operating earnings, the profits earned by a corporation’s ongoing business activities; and (2) reported earnings, the operating results plus or minus (almost always minus!) any asset write-downs (said to be “nonrecurring”) that account for investment losses; mergers that depleted corporate values; erosion of goodwill; and so forth. This distinction barely existed until the 1980s; in the recent era the distinction reached astonishing levels. Due to the staggering write-downs of failed debt obligations held by our traditional banks and investment banks, 2008 operating earnings for the S&P 500 Index were $49.51; reported earnings were $14.88. From those depressed (and depressing!) levels a strong rebound is virtually assured.
Given the high variability of reported earnings, only our most recent data rely on operating earnings. Despite the fact that reported earnings represent the only valid measure of long-term corporate success, the focus of the Wall Street market strategists remains (for obvious reasons, including embedded optimism!) on the more stable figure, which yields a more consistent measure of price-earnings multiples. So our recent figures tend to overstate earnings and understate price-earnings multiples.
Enter Occam’s Razor
So, courtesy of Occam’s Razor, I advance a simple theory. These three variables determine stock market returns over the long term:
1. The dividend yield at the time of initial investment.
2. The subsequent rate of growth in earnings.
3. The change in the price-earnings ratio during the period of investment.
The total of these three components explains nearly all of the stock market’s returns over extended holding periods. By analyzing the contribution to total return of the three factors, reasoned consideration of future returns can take place. The initial dividend yield is a known quantity. The rate of earnings growth has usually been relatively predictable within fairly narrow parameters. And the change in the price-earnings ratio has proven highly speculative. Total return is simply the sum of these three factors. For example, an initial dividend yield of, say, 3 percent plus a forecasted earnings growth of 7 percent annually over the next 10 years would bring the return to 10 percent. A change in the price- earnings ratio—from, say, 15 times at the beginning of the period to a forecasted 18 times at the end—would add 2 percentage points to that total, bringing the return on stocks to 12 percent. This simple arithmetic is the basis for the historical analysis presented in
Table 2.1.
As I mentioned in Chapter 1, the long-term investor’s main objective is to earn high rates of real returns. Because real returns have been adjusted for inflation, they represent the true growth in the purchasing power of investment dollars. In this analysis, however, I rely on nominal returns. I do so because the most accurate data on dividend yields, earnings growth, and price-earnings ratios are stated in nominal terms. While we know the impact that inflation has had on the total market return, there is no method of apportioning its impact among the three components of return. The spread between the actual returns and the returns calculated with the Occam’s Razor methodology is, of course, the same for both nominal returns and real returns.
The analysis covers the modern stock market era, beginning in 1926. I use the Occam’s Razor model to examine 10-year, rather than 25-year, stock market returns, since I suspect that few investors—however unwisely—expect to demonstrate the patience to think of investing in the quarter-century intervals shown in
Figure 2.1. But even a decade allows us to ignore the wild and often inexplicable short-term factors that drive markets on a daily—and even a yearly—basis.
As
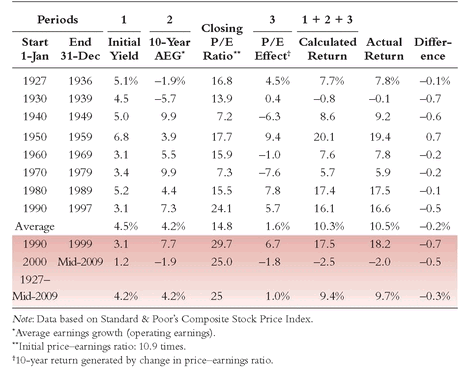
Table 2.1 indicates, the sum of the initial dividend yield, the earnings growth rate, and the change in the price-earnings ratio yields a remarkably accurate approximation of the actual nominal returns provided by stocks in the six full decades and two partial decades from 1926 to the present.
In no case does the variation reach even a single percentage point. From January 1960 to December 1969, for example, the sum of the initial dividend yield (3.1 percent), the decade’s average annual earnings growth (5.5 percent), and the annualized change in the price-earnings ratio (-1.0 percent) came to 7.6 percent, just 0.2 percent shy of the 7.8 percent actually provided by stocks during the decade. For the full period, the calculated stock return of 10.3 percent per year is nearly identical to the actual return of 10.5 percent. The parallelism is crystal clear.
TABLE 2.1 Ten-Year Nominal Stock Market Returns (1927 to Mid-2009)
Investment and Speculation
The Occam’s Razor approach to the components of return echoes the philosophy of John Maynard Keynes, perhaps the most influential economist of the twentieth century. Keynes posited these sources of financial returns:
• Investment (which he called “enterprise”): “the activity of forecasting the prospective yield on the asset over its whole life . . . assuming that the existing state of affairs will continue indefinitely.”
• Speculation: “the activity of forecasting the psychology of the market . . . attaching hopes to a favorable change in the conventional basis of valuation.”
In our Occam’s Razor model, the combination of initial dividend yield and prospective 10-year earnings growth—the two investment fundamentals—is the analog for the Keynesian concept of enterprise—the estimated yield of the asset over its lifetime. The change in price- earnings ratios is the analog for speculation—a change in the basis of valuation, or a barometer of investor sentiment. Investors pay more for earnings when their expectations are high, and less when they lose faith in the future. When stocks are priced at a multiple of 21 times earnings (or higher), the mood is exuberance. At 7 times earnings, the mood approaches despair. After all, the price-earnings ratio simply represents the price paid for a dollar of earnings. But, as the valuation falls from 21 to 7 times earnings, prices fall by 67 percent. If the reverse occurs, prices increase by 200 percent. If there is no change in the price-earnings ratio, the total return on stocks depends almost entirely on the initial dividend yield and the rate of earnings growth.
As
Table 2.1 demonstrates, investment, or enterprise, has prevailed over speculation in the long run. In the eight virtually consecutive decades from 1926 through 1997, the nominal initial dividend yield has averaged 4.5 percent, and earnings growth has averaged 4.2 percent. The sum of these two components is a fundamental stock return of 8.7 percent, slightly less than the 10.5 percent nominal return actually provided by stocks over the same rolling periods. We can chalk up the remaining 1.8 percent to speculation (or, more likely, to the imprecise nature of our analysis).
e In short, the fundamentals of investment—dividends and earnings growth—are the
right things to remember about things past. In the very long run, the role of speculation has proven to be a neutral factor in the shaping of returns. Speculation cannot feed on itself forever. Periods in which speculation has enhanced returns have been followed by periods in which speculation has diminished returns. No matter how compelling—or even predominant—the impact of speculation on return is in the short run, expecting it to repeat itself leads our expectations down the wrong road. Speculation is the
wrong thing to remember as we peer into the future to consider things yet to come.
The Fruits of Knowledge
The point of this analytical exercise is pragmatic. If there are favorable odds of making reasonably accurate long-term projections of investment returns, and if fundamental returns—earnings and dividends—are the dominant force in shaping the long-term returns that actually transpire, would not a strategy focused on those fundamental factors be more likely to be successful than a strategy of speculation for the investor with a long-term time horizon?
Short-term investment strategies—which effectively ignore dividend yield and earnings growth, both of which are virtually inconsequential in a period of weeks or months—have almost nothing to do with investment. But they have a lot to do with speculation; that is, simply guessing at the price that other investors might be willing to pay for a diversified portfolio of stocks or bonds at some future time when we are willing to sell.
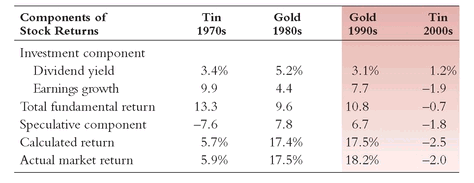
Speculation is typically the only reason for the sometimes astonishing daily, weekly, or monthly swings we witness. But speculation can also play a major role in longer-term periods. In the 1980s, for example, stocks delivered a truly remarkable annual total return of 17.5 percent, virtually all of which was derived from an initial yield of 5.2 percent, earnings growth of 4.4 percent, and an annual valuation increase of 7.8 percent, as the price-earnings multiple more than doubled from 7.3 to 15.5 times. The speculative element outweighed, by a wide margin, each of the fundamental elements, and came close to matching their combined contribution.
TABLE 2.2 A Tin Decade, Two Golden Decades, and Another Tin Decade
Speculative mania can also take a depressing turn. In the 1970s, stocks produced an average return of 5.9 percent, explained almost entirely by the initial yield of 3.4 percent, earnings growth of 9.9 percent, and a valuation decrease at an annual rate of -7.6 percent, as the price-earnings ratio dropped from 15.9 to 7.3 times. The market’s loss of confidence exacted a heavy toll on the bounty generated by investment fundamentals.
If the former extreme was a “Golden Decade,” the latter could be called a “Tin Decade” (see
Table 2.2). It may not be entirely by accident that the total combined return for the two decades came to 11.5 percent. That figure is remarkably close to the fundamental return of 11.4 percent (an average 4.3 percent dividend yield plus average earnings growth of 7.1 percent); the price-earnings ratio fell slightly, from 15.9 percent to 15.5 percent, reducing return by just 0.1 percent annually. Together, the combined returns surely represent the “back to normalcy” nature that financial markets tend to exhibit.
fTEN YEARS LATER
The Fruits of Knowledge
While over the short run (even, as we now know, over periods as lengthy as two decades) speculation can ride in the saddle, over the long run investment returns inevitably control stock market returns. If we look at the Golden Decades of the 1980s and 1990s, not as an isolated event but as part of a continuum bracketed by the Tin Decades of the 1970s and 2000s, the nominal return on stocks for the full period—averaging 7.3 percent annually—was reasonably close to the historical average of 9.0 percent. “The more things change, the more they remain the same.”
During the past decade, we have seen the impact of a low initial dividend yield (just over 1 percent), a sharp decline in earnings growth to a negative level (-2 percent per year), and (as the price-earnings ratio fell from 32 to about 25 currently, using the trailing 12 months’ earnings) a long-overdue reversion toward the mean in speculative return. Although current price-earnings valuations are hardly cheap, the dividend yield (2.6 percent) has more than doubled and projected earnings growth (from these depressed levels) could well exceed long- term norms. So the pessimism that is now so rife may well prove to be overdone.
From the Past to the Future
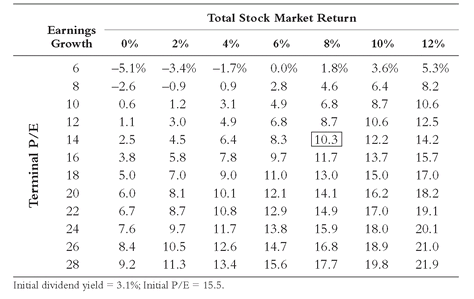
As the 1990s began, I reasoned that these long-term data could help provide a framework of expectations for the coming decade. I knew that the initial dividend yield on stocks on January 1, 1990, was 3.1 percent. I needed only to project the other two variables: earnings growth and the change in the price-earnings ratio for the decade. For help in thinking through these forecasts, I relied on a matrix similar to the one shown in
Table 2.3. For example:
TABLE 2.3 Stock Market Total Return Matrix for the 1990s
TEN YEARS LATER TABLE 2.3 Stock Market Total Return Matrix for the 2010s
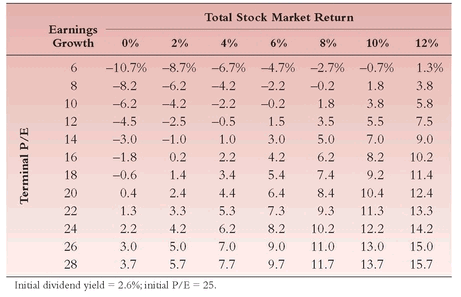
• If the future earnings growth rate were 8 percent, and the price- earnings ratio were to ease downward from 15.5 times to a more traditional 14 times, the total return on stocks would approximate 10.3 percent per year. At the time this matrix was constructed, this earnings growth rate, relative to its past historical rate of 5.8 percent, was aggressive. The price-earnings ratio, while below the then-existing level, was above the historical norm.
• “Too low,” one might say. “The 1990s will be just like the 1980s.” However, to get the remarkable 17 percent return achieved during the 1980s, given the initial dividend yield of about 3.1 percent, would take, among other combinations, a 9 percent earnings growth rate and an increase in the price-earnings multiple to 24 times. This seemed both an aggressive earnings projection and a multiple that had often signaled substantial overvaluation that had ultimately been corrected by a market decline.
• “Too high,” another might say. “I expect 6 percent earnings growth and an earnings multiple of 12 times.” Net result: An annual return of 6.8 percent—about two-thirds of the historical 10.3 percent norm, on assumptions that were far short of catastrophic.
In an article for the
Journal of Portfolio Management, published in 1991, I explained my reasoning:
The point of these examples is that the model sets the framework for a rational discourse on the returns on stocks in the 1990s. It makes it clear that, unless we have unusually optimistic sentiment that results in high price-earnings ratios in 1999 (indeed, why not?), and earnings growth for the decade higher than that of any past decade (again, why not?), stocks will have their work cut out for themselves to exceed returns in the 8 percent to 12 percent range during the 1990s, perhaps averaging 10 percent annually.
1My “why not?’s” now seem almost prophetic. Since the mid-1990s, we have experienced a combination of a remarkable boom in the U.S. economy, unusually robust growth of corporate earnings, and price- earnings ratios that have soared to record highs based on extreme investor optimism that approaches exuberance. Taken together, these factors have so far resulted in stock returns well beyond my initial base expectations, even exceeding my optimistic expectation of 13 percent.
Honing the Razor
Shortly after the 1991 article was published, I decided to put a finer point on my projections. Rather than using a matrix, with a range of different returns under different conditions, I developed a model that would endeavor to provide, in retrospect, the returns that might have been expected in past decades. I knew the dividend yield and the market’s price-earnings ratio at the outset of each decade. Forecasting would be a matter of estimating, retrospectively, what rate of earnings growth might have been expected for each decade, and what final price-earnings ratio might have been expected at the end of each decade.
Creating, in advance, tailor-made forecasts for each variable and each prospective time period would have been an exercise in futility. How could one ever guess what rate of earnings growth might occur, and what value investors would place on earnings a decade hence? I chose to avoid these issues. Instead, I added back the (known) initial yield to the average earnings growth rate that the market had experienced in the past, and I assumed that the terminal price-earnings ratio would equal the market’s past average price-earnings ratio.
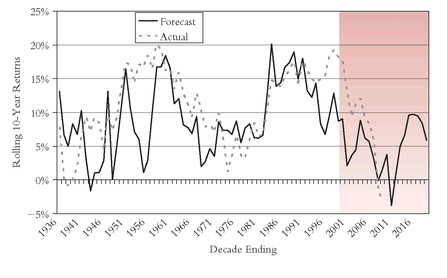
To test this approach, I examined my results over the 53 10-year rolling periods from 1926 to 1989.The results were striking. The general parallelism between the actual returns of the Standard & Poor’s 500 index and the returns forecast by my simple reliance on the past was, with some notable exceptions, quite accurate. Most of the exceptions occurred during the traumatic environment of the 1930s and the dislocation surrounding World War II.
Figure 2.3, updated through 1997, compares the actual returns in each rolling decade with those forecast by the model since 1926. (As
Figure 2.3 reveals, exceptions to the reliability of these forecasts have reappeared during the great bull market of the late 1990s.) In statistical argot, the coefficient of correlation of +0.54 between the projected and the actual results was, if far from perfect, impressive—infinitely better than the 0.00 correlation that would be predicted by mere chance, and indeed more than halfway to the perfect correlation that would be indicated by +1.00, under which each forecast would have hit the mark precisely.
Occam in Action
Backtesting, of course, should always be viewed with skepticism. (“Torture the data until they confess” is the customary way of viewing it.) The real test of my methodology was to be its performance as a forecasting tool. The results have been poor at worst, mixed at best.
FIGURE 2.3 Ten-Year Nominal Stock Market Returns, 1936-2019, Projected
In 1991, I had stated that stocks might reasonably be expected to provide an annual return in the range of 10 percent during the 1990s. Later, in a second article for the
Journal of Portfolio Management,
2 I offered a more precise projection using history as my guide. Based on an initial dividend yield of 3.1 percent, plus assumed earnings growth of 6.6 percent per year (the average rate of the prior 30 years), the analysis called for an
investment return of 9.7 percent per year during the 1990s. As to the
speculative return, a decline in the price-earnings ratio from the then-current level of 15.5 times to its 30-year historical average of 14.1 times would reduce this return by -1.0 percent per year. The result: A stock market return of 8.7 percent, a bit below my earlier ballpark projection.
I presented my findings as variations on the theory of rational expectations that might be useful as a rudimentary forecasting tool. After careful examination of all 53 decade-long periods since 1926, the results of the model had been reasonably accurate in one-third of those periods, measurably better in one-third of the periods, and quite poor only in the remaining one-third of the periods. I described these variations as a healthy reminder that equity markets have exhibited wildly aberrant behavior from time to time. Ever mindful of the fallibility of forecasting, I then warned—prophetically, as it turned out—that “it would be unwise to apply this new forecasting tool without considering the possibility that precisely such wild aberrations lie directly before us. Surely stranger things have happened.”
TEN YEARS LATER
From the Past to the Future
While my own (heavily qualified) projection of annual stock returns in the range of 8 percent to 10 percent in the 1990s was far too conservative, I providentially allowed for the (to me) unlikely possibility that “the 1990s will be just like the 1980s . . . a remarkable 17 percent return” born of a 3.1 percent dividend yield, 9 percent earnings growth, and a rise in the P/E multiple to 24 times. As it happened, earnings were to grow at a rate of almost 8 percent, and the P/E didn’t stop at 24 times. It rose to 33 times, and the market’s total return came to 18 percent.
Yet, finally, time was on my side. My caution that equity markets would continue to exhibit wildly aberrant behavior came true in spades. The remarkable 18 percent return of the 1990s was followed by a negative return of 2 percent during the first decade of the new millennium. Result: a two-decade aver age return of 7.8 percent, close to the lower end of the 8- to 10-percent range I had projected 20 years earlier. I take this outcome as a strong reaffirmation of my Occam’s Razor methodology, and a caution that while projecting returns over a relatively short time frame is virtually impossible, in the long run time and fundamentals usually tell.
The Envelope, Please
My analysis of stock returns was right twice, but only in a most perverse sense. Halfway to the finish line, the forecast was exactly on the mark. My projection had called for a 10-year rate of total return on equities of 8.7 percent. Astonishing as it may seem, for the first half of the decade (1990-1994), the actual rate of return was 8.7 percent. The long-term investment fundamentals on which I based my thesis dominated the forces of speculation that have often had a major impact on short-term returns. Nonetheless, in a third article in the
Journal of Portfolio Management in 1995,
3 when I reviewed that remarkably accurate forecast, I acknowledged that luck, pure and simple, played a role in the virtually exact correspondence of the forecast and actual returns.
Alas, my 1991 comment that strange things might happen was soon to be right on the mark, too. Wild aberrations did lie directly before us. In fact, they would strike the stock market during the second half of the decade. As proof that forecasting returns is a fallible and humbling profession, stocks took off as 1995 began, and, in an amazing sequence that lasted more than three years, returns averaged 31 percent annually. By the end of 1998, reality bore little relation to my earlier projection (in the 10 percent range). With only 12 months remaining in the decade, stocks had provided returns averaging 18 percent. Even if stocks were to decline by as much as 20 percent during the final year of the decade, the return would still average 13.5 percent, slightly higher than my optimistic forecast, early in the decade, of 13.0 percent (based on 9 percent earnings growth rate and a terminal price-earnings ratio of 17 times).
What Happened after 1994?
During the second half of the 1990s, the market’s robust returns reflected two extraordinary developments. First, two years after the decade began, earnings began to grow at a rate that was more than double the historical 6.9 percent earnings growth of stocks since 1926. From their depressed level in 1991, corporate earnings leaped upward, increasing at an annual rate of 16.6 percent through 1997. Interestingly, however, from the start of the decade in January 1990, the growth rate proved to be 7.3 percent, only a bit above my historically derived forecast of 6.6 percent. With the initial dividend yield of 3.1 percent, my forecast of investment—or fundamental—return was 9.7 percent, a fairly accurate initial projection compared to the actual figure of 10.4 percent.
Second, however, reflecting the extraordinary resurgence in corporate earnings, the speculative element of stock prices leaped to the fore. From the start of 1990 to mid-1998, the stock market’s price-earnings ratio ballooned from 15.5 times earnings to 27 times earnings—a level that had been exceeded only once since 1926. This huge expansion in the multiple—in sharp contrast to the slight contraction of the historical norm of 14.1 times that I had calculated—accounted for almost the entire difference between my projection and the market’s actual return so far. Such a multiple expansion, virtually impossible to forecast, added fully 6.7 percentage points annually to the fundamental return of 10.4 percent, bringing the total stock market return to 17.1 percent annually over the decade so far, just 0.7 percentage points shy of the stock market’s actual 17.8 percent return.
With the clarity of hindsight, my initial forecast, based on a reversion of the price-earnings ratio to the historical norm, proved an exercise in humility. It also confirmed what I have so often said to investors about investing: Don’t think you know more than the market. Nobody does. Put another way, in volatile and uncertain financial markets, rationality provides only a reasonable range of expectations, and only over a long time horizon at that. (Further, as I write this chapter, the decade has not yet reached its conclusion and may yet hold surprises for investors.) By definition, a rational model is powerless to forecast stock market bubbles built on “irrational exuberance”—if indeed a bubble is what we are experiencing in the late 1990s, and if Federal Reserve Board Chairman Alan Greenspan’s 1996 warning about stock prices finally holds true. Only in retrospect will we learn the verdict of history.
Occam’s Razor and the Bond Market
Occam’s Razor has proven more useful in setting a framework for future returns in the bond market than in the stock market, albeit in a very different fashion. My simple methodology is a far cry from the bond market models engineered by econometricians on Wall Street, but it seems at least equally useful in considering future bond returns.
My analysis of bond returns begins with an examination of the same post-1926 era we used for stock returns. The 62-year nominal return on the long-term U.S. Treasury bond has averaged 5.2 percent, an odd combination of returns averaging a puny 3.1 percent from 1926 through 1979, and an extraordinary 11.8 percent thereafter. However, past returns on bonds (unlike past returns on stocks) are devoid of meaning when forecasting future returns. Sadly, almost no lesson of past history is relevant, except the wrong lesson: Never buy bonds!
Fortunately, however, the simple explanation is the correct one, and it further reinforces the Occam’s Razor concept. The initial interest rate at the start of a given decade is by far the preponderant force governing subsequent returns. According to
Table 2.4, which shows the interest rate on long-term U.S. Treasury bonds at the start of each decade, it is a remarkably efficient, if imperfect, indicator of future returns. It is efficient because the entry yield is a known quantity, just as it is for stocks. However, the initial interest rate on long-term bonds far surpasses the other two factors that come into play: the reinvestment rate (that is, the rate at which the interest coupons compound) and the terminal (or end-of-period) bond yield.
TABLE 2.4 Ten-Year Nominal Bond Market Returns—Long-Term U.S. Government Bonds (1927-2008)
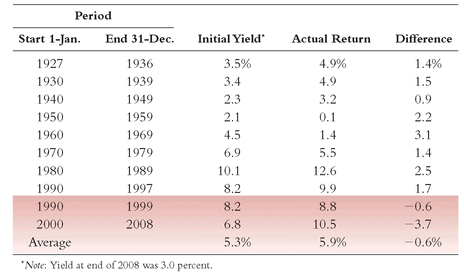
These variables fit neatly into the Keynesian dual formulation of returns. I liken the current interest rate to Keynes’s first element—investment, or enterprise—for the interest coupon on a long-term Treasury bond is surely a precise statement of the prospective yield on the asset over its whole life, assuming that the existing state of affairs (i.e., the interest coupon) will continue indefinitely. The average yield during the period, which establishes the reinvestment rate of the interest coupons, and the yield on the bond 10 years later correspond to the second element, speculation, or attaching hopes to a favorable change in the conventional basis of valuation. That is, a change in the general level of interest rates will lead to an increase or decrease in the bond’s market value during the interim period before it reaches maturity. (If a U.S. Treasury bond is held until maturity, however, it will be redeemed by the federal government for its face value.)
The reinvestment rate is highly important in forecasting bond returns, simply because interest comprises by far the dominant proportion of bond returns over the long run, when the rate at which interest is reinvested may rival the terminal yield in importance. However, changes in interest rates tend to have a countervailing effect on bond prices and bond reinvestment rates: a higher yield lowers interim values before maturity, but raises the rate at which the interest is reinvested. (A lower yield does the reverse.) As a result, the initial interest rate remains the critical variable in forecasting the subsequent 10-year returns on bonds. This single factor has a very strong correlation (+.93) with the returns subsequently earned by bonds. It is even stronger than the impressive +.54 correlation between the total of the dividend yield, past earnings growth, and the average price-earnings ratio used in the Occam’s Razor model to forecast subsequent returns on stocks. (As noted in Chapter 1, zero-coupon U.S. Treasury bonds eliminate both maturity risk and reinvestment risk for investors holding them to maturity, although in the interim, their prices are extremely volatile.)
In the 1991 article in the
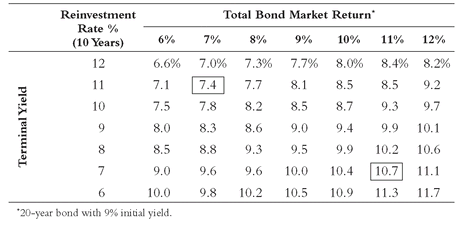
Journal of Portfolio Management in which I forecast bond returns, I relied not on history but on a simple matrix using all three factors: the initial yield of the long-term U.S. Treasury bond, a series of different reinvestment rate assumptions, and a series of terminal interest rates at the end of the decade. I used this matrix toward the same purpose as the stock return matrix: to create a framework of expectations for returns from bonds in the future. (See
Table 2.5.)
Assuming an initial interest rate of 9 percent, the matrix showed that if the terminal interest rate soared to 11 percent a decade later, and if the average reinvestment rate were 7 percent, bonds would provide a return as low as 7.4 percent. However, the return would rise to 10.7 percent if the reverse were true: if terminal yield dropped to 7 percent and the reinvestment rate rose to 11 percent. Interestingly, even if these two almost self-contradictory scenarios were to ensue, the range of future returns—from 7.4 percent to 10.7 percent—would not be extraordinarily wide.
TABLE 2.5 Bond Market Total Return Matrix for the 1990s
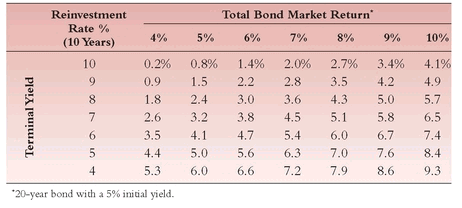
TEN YEARS LATER TABLE 2.5 Bond Market Total Return Matrix for the 2010s
As the 1990s began, I relied on Occam’s Razor to offer some guidance in projecting bond market returns over the coming decade. Looking at a long-term historical norm of 5.2 percent for annual bond returns and a return of 12.6 percent during the 1980s, I opined that performance comparable to that of the 1980s was probably unrealistic; a repeat of the long-term norm seemed almost inconceivable. Perhaps the best central reference point for the Treasury bond would be its current yield to maturity of 8.2 percent, with annual returns possibly ranging between the highs reached in the 1980s and the midrange (5.5 percent) levels of the 1970s.
In the spirit of Occam, I considered only the initial interest rate, making no attempt to estimate the reinvestment rate or the terminal yield. By 1994, with half the decade on the books, bonds had returned 8.3 percent, closely in line with my 8.2 percent forecast. Indeed, the forecasted bond return coincided with the actual return almost as closely as the stock return. During the first half of the 1990s, Occam’s Razor had led to two remarkably accurate forecasts.
Then, during 1995, interest rates tumbled and bonds took off. The annual rate of return rose to 10.4 percent, slightly better than my optimistic forecast. Given the lower reinvestment rate engendered by the sharp drop in interest rates through mid -1998, however, the rate of return has already fallen to 9.9 percent and, with the reinvestment rate now at 5¼ percent, will likely continue to fall during the remainder of the decade. Assuming that interest rates remain near current levels, the decade-long return should come in at about 9 percent—close to the 8.3 percent projected, and well within the expected range.
Precision and Perversity
As to the first half of the 1990s, after giving luck, pure and simple, credit for the precision of my forecasts of stock and bond returns, my 1995 article in the Journal of Portfolio Management noted that the luck was that the returns happened to represent solely investment fundamentals, without apparent speculation, perhaps a rare coincidence. I added that it remained to be seen whether the decade would reaffirm my findings. As it now appears, the decade will come very close to my bond forecast, but do precisely the reverse for my stock forecast, largely because the market, perversely enough, raised stock valuations to unprecedented levels.
Whether the powerful 1992-1998 recovery of corporate America from its abysmal earnings performance during the previous five years will continue—or whether it has been magnified in the stock market by a bout of speculative mania—remains to be seen. But some commentators, including the London-based editors of the Economist, argue that “America is experiencing a serious asset-bubble.” Speculative mania, the Economist noted in April 1998, had coincided with rapid growth in the money supply, fueling an inflation in asset prices—stock prices, in particular.
The mere use of the word bubble by a distinguished publication was sufficient to set the financial community on edge. A New York Times editorial, headlined “The Economic Bubble Theory,” denied that any bubble existed, except the one created by the economists, “who, try as they might, cannot seem to find a bubble worth worrying about.” The Wall Street Journal then chimed in with “Let’s Burst the Bubble Theory,” describing it as “extreme paranoia about imaginary future disasters.”
Later in the year, however, the idea that we were in fact experiencing a market bubble spread further. Morgan Stanley Dean Witter headlined its Economics bulletin: “The Great American Bubble,” and a New Yorker article entitled “Pricking the Bubble” quoted Nobel economist and monetary historian Milton Friedman as agreeing: “Both the market of 1929 and the market today are bubbles . . . I suspect there is even more of a bubble today.” Whatever the case, surely no one can disagree that, as the Economist reported, “there is no room for doubt that on standard time-tested measures, prices are way out of line.” This is a difficult time to peer into the future.
Stock Returns in the Coming Decade
Despite the considerable challenge of doing so, let’s see what Occam’s Razor might suggest from 1999 forward. Given what we know of stocks in the past, the relative consistency of the fundamental elements of return—dividend yields and earnings growth—and the volatility of the speculative element—the ratio of stock prices to earnings—the Occam’s Razor methodology suggests that we’ re at a high level of stock prices at the end of 1998. Here are the key elements:
• Dividend yields are at an all-time low of 1.4 percent, compared to a post-1926 average of 4.3 percent.
• Earnings growth is slowing from its heady 1992-1997 run (16.6 percent per year).
• Earnings growth in 1998 is expected to be around 5 percent, below the norm of 6.6 percent since the end of World War II.
• Stocks are priced at an all-time high of 27 times earnings, unarguably far removed from their historical norm of 14 times earnings.
Against this stock market backdrop, we are enjoying an economy operating at full employment and with little excess capacity, suggesting that the economic growth that brought us here may be difficult to repeat. But, looking toward the decade ahead, even if we suppose that earnings will increase at their historical rate of 6.6 percent or will even go as high as 10 percent (hardly bearish scenarios), stocks would provide a fundamental return of between 8.0 percent and 11.4 percent. If the price-earnings ratio were to hold at 27, that pure investment return would be equal to the market’s actual return in the next 10 years—a far cry from the past few years of 30-plus percent annual gains.
It is worth noting, however, that a sustained price-earnings ratio of 27 would demand a wholesale revision of our traditional approach to risk in the stock market. Even if the new norm were as high as 20 times earnings, nominal stock returns in the first decade of the new century would be reduced by three percentage points below the fundamental range of 8 percent to 11 percent, to a range of 5 percent to 8 percent. (There is, of course, always the possibility that a new, higher mean for both earnings growth and price-earnings ratios is now being established, a possibility that I discuss in Chapter 10.)
However, some vocal market mavens believe that we have thrown off the old shackles on the profitability of corporate America. These true believers are convinced that, having been liberated by a painful restructuring during the 1990s, the information technology revolution, and the boom in global trade, U.S. corporations will rule the world. In this brave new era, a price-earnings ratio of 20 or more, supported by robust profit growth, will be the norm, not a euphoric exception.
My innate sense of caution argues otherwise, but it is possible that we are beginning to enjoy the benefits of at least some increase in the sustained rate of long-term corporate earnings growth. (Again, I recall my own frequent advice to investors: Never forget that
anything can happen in the stock market.) If, in fact, the modern norm of 6.6 percent earnings growth has moved upward to a new and higher norm of, say, 8 percent, then a higher price-earnings ratio could be justified—say, up to 20 times earnings versus the historic norm of 14 times earnings. However, even these increases, hardly of trivial dimension, would not be sufficient to create future returns that would support the current level of stock prices at a price-earnings ratio of 27 times earnings.
gTEN YEARS LATER
Stock Returns in the Coming Decade
Now that the decade that began at year-end 1999 is drawing to a close, it’s clear that the caution I expressed a decade ago was justified. Rather than the unprecedented 17-plus per cent annual return of the two preceding decades, I suggested that annual returns on stocks in the first decade of the new millennium could be as low as 5 percent. But as both earnings growth and price-earnings multiples declined sharply, the return turned out to be much worse than that—about -2 percent per year.
While I obviously erred, I feel good about having taken the lonely position that the days of wine and roses, as it were, were at an end, and even better about the fact that “my innate sense of caution” warned against believing that “we have thrown off the old shackles on . . . corporate America” and my profound skepticism that “future returns . . . would support the current level of stock prices.”
Bond Returns in the Coming Decade
There is much optimism in the bond market, too, though it is less pronounced than in the stock market. With the long-term U.S. Treasury bond yielding about 5¼ percent, interest rates have fallen to levels not seen since the early 1970s. Because inflation seems subdued, however, bonds still offer, by historical standards, a relatively generous real return. Based on the recent bond yield, the Occam’s Razor methodology suggests a fairly narrow range of future returns:
• With normal assumptions (that is, interest rates in a yield range of 5 percent to 9 percent), bonds should provide a return of 5-plus percent, give or take a percentage point or so, during the coming decade.
• Under extreme conditions (rates of 4 percent to 10 percent), the best case, an 8.6 percent total return, would contrast with a worst case of 3.1 percent.
• In these extreme cases, the sensitivity of total return to the terminal yield would be about double its sensitivity to the reinvestment rate. Thus, the tricky question of what the bond yield will be a decade hence makes traditional forecasting especially challenging.
It is not my intent to argue that interest rates may not go to 4 percent and remain there (although it does seem unlikely), nor that rates may not go to 10 percent (perhaps even less likely) and remain there, at least for a time. Rather, I want to make the elemental point that, when we know the current interest coupon, we know most of what we need to know to forecast bond returns over the coming decade. Then, we can engage in rational discourse about our other assumptions: At what rates will the coupons be reinvested? What will be the terminal yield?
TEN YEARS LATER
Bond Returns in the Coming Decade
Since the sources of their returns can change sharply, projected stock returns are subject to painful error. Although the initial dividend yield is a known factor, earnings growth is subject to significant variation even over decade-long periods, and price- earnings ratios are extremely difficult to predict, based as they are on investor hope, greed, and fear. Emotion, unsurprisingly, is more difficult to predict than reason.
But the source of return on bonds has but one powerful determinant, and one that is known in advance: the current interest rate. Thus, when a decade-plus ago I forecast a 5¼-plus percent return on the long-term U.S. Treasury bond, it was based on its yield in late 1998, a modest 5¼ percent. The actual return on the bond for the following ten years turned out to be 6.2 percent, a nice fit of expectation with the ensuing reality.
So it is with some remarkable confidence that with the yield on the long-term Treasury bond at 4.5 percent in mid- 2009, I expect a bond return within a range of say, 4 percent to 6 percent during the coming decade. Of course, any dramatic change in interest rates could shape that number lower or higher—say, 3 percent to 7 percent—but that remains to be seen. However, even a range of that width presents a useful standard in shaping investment strategy.
Back to the Future
I make no apology for Occam’s Razor nor for the simplicity of my three-step concept of evaluating returns, even as I realize, quoting Renoir: “Nothing is as disconcerting as simplicity.” To which I might add: nothing is as futile as expecting past returns to be slavishly translated into future returns on a linear basis. Too many of the complex academic investment strategies and forecasting methodologies appearing in the financial journals are entirely retrospective and, often, entirely dependent on the particular period chosen. Some of them approach witchcraft. The simplicity postulated by Occam’s Razor can help cut through much of the confusion that clutters investment theory. It presents a simple and rational picture of future possibilities, based largely on the lessons we can learn from the study of past returns and our view of the elements of future returns. Occam’s Razor will not tell us what future returns will be, but it will tell us what the elements of stock and bond returns must be to provide us with any rate of return we wish to assume.
You are free to disagree with my conclusions, particularly because, to reiterate, we
know that anything can happen in the financial markets. And it usually does! There is no reason for slavish adherence to even a rational forecasting methodology, for markets are not always rational. Judgment is not only permitted, but encouraged. But the thrust of the theoretical exercise we have now completed is that disagreement must be fact-founded and data-based, not merely intuitive. Going through the Occam’s Razor exercise should help investors make intelligent decisions about where to invest their assets. If we focus on the fundamentals of investment and ignore the dross of speculation, we come to the same conclusion reached by Warren Buffett, quoting Benjamin Graham’s
The Intelligent Investor:
In the short run, the stock market is a voting machine; in the long run, it is a weighing machine.
4
How Important Is It to Forecast Future Returns?
There is no way for investors to avoid thinking about the future course of the financial markets. In this chapter, I have tried, above all, to put into perspective the forces that drive market returns. They are worth knowing and understanding. But we must face the reality that, even if rational analysis of the relationship between investment fundamentals and speculation in investing gives us favorable odds (and no more than that) of accurately forecasting market returns, the game may not be worth the candle for the long-term investor. After all, we would be foolish to take our investment portfolios to the betting window and wager everything on a single race, even if the odds were 8 out of 10, to say nothing of 5½ out of 10, in our favor.
Peter Bernstein and Robert Arnott reflected on this question in a recent article in the
Journal of Portfolio Management: “Bull Market? Bear Market? Should You Really Care?” They concluded that “for most long-term investors, bull markets are not nearly as beneficial, and bear markets not nearly as damaging as most investors seem to think.” They noted, correctly, that “a bull market raises the asset value, but delivers a proportionate
reduction in the prospective real yields that the portfolio can deliver from that point forward, while a bear market does the reverse, reducing portfolio value, which is largely offset by an
increase in prospective yields, other things being equal.”
5 This being the case, what we would ideally like to see is a bull market late in the lives of our portfolios, and a bear market during the early years of accumulating them. But that’s a bit of timing beyond our control.
Those who believe that the market’s incredible momentum will be sustained, that the huge sustained purchases of stocks by individual investors will not slacken, and that we are indeed in a new era of global growth will hold the line in their equity allocation—or perhaps even increase it. But those who believe—as I do—that fundamentals such as earnings and dividends matter, and that, in the fullness of time, some semblance of historic norms will prevail, should consider at least some modest leaning against the powerful wind that is driving the high returns in this great bull market. And those who believe that another Great Crash lies around the corner must consider an even larger reduction of their equity exposures. Irrespective of what the future holds, however, it seems to me that equities should remain the investment of choice for the long-term investor—the dominant component of a well - balanced asset allocation program.
So, invest with intelligence and common sense; engage in an enlightened and rational discourse when considering the future; always have some significant portion of your assets both in stocks and in bonds; be sparing about precipitate and extreme changes in these proportions. And be skeptical about every prognostication you are given, including mine. If you have set an intelligent route toward capital accumulation, stay the course—no matter what.
With a bow to Occam’s Razor and the role of simple concepts, I hope I have given you a better understanding of what is fundamental and what is transitory—what is investment and what is speculation—to help you come to a rational expectation of the range of returns that both stocks and bonds can provide over the long term. Now, we can get down to the most basic element of long-term investment strategy: the allocation of our investments between stocks and bonds.
TEN YEARS LATER
The Nature of Returns
My clear conclusion in the first edition—“that fundamentals such as earnings and dividends matter, and that, in the fullness of time, some semblance of historic norms will prevail”—led me to recommend “at least some modest leaning against the powerful wind that is driving the high returns in this great bull market” that would soon come to an end, or “an even larger reduction of . . . equity exposures.” As we now know, that advice was, if not perfect, at least directionally correct.
But even the calamitous events of the recent era do nothing to alter the basic principles that I expressed a decade ago. The sources of equity returns remain: (1) investment (or fundamental) return, consisting of the initial dividend yield plus the subsequent rate of annual earnings growth, plus or minus (2) speculative return, the annualized impact of the percentage change in the price that investors are willing to pay for $1 of earnings (the P/E ratio). In the long run, stock returns are driven by investment return, and speculative return—so important (and unpredictable) in the short run—fades away. Yes, it’s simple stuff, but wasn’t that what William of Occam was telling us?
