Chapter 3
On Asset Allocation
The Riddle of Performance Attribution
Asset allocation is no more complicated than Chance’s lessons about the garden. We invest with faith in the financial markets, dividing our portfolios among distinct asset classes that blossom and wither in different seasons of the economic cycle. Following the simple logic of diversification, we seek to maximize our participation in the market’s seasons of plenty, while ensuring that we survive its seasons of want.
For nearly all investors, the principal asset classes of choice boil down to common stocks (for maximum total return), bonds (for reasonable income), and cash reserves (for stability of principal). Each differs in risk: stocks are the most volatile, bonds are less so, and the nominal value of cash reserves is inviolable.
From the Talmud to Modern Portfolio Theory
In the past 25 years, we have come to frame the simple logic of diversification in terms of a rigorous statistical model developed by finance academics: modern portfolio theory. Investors almost universally accept this theory, which is based on developing investment portfolios that seek returns that optimize the investor’s willingness to assume risk. Risk, in turn, is defined in terms of short-term fluctuations in expected value.
In its most comprehensive form, modern portfolio theory dictates that portfolio composition should include
all liquid asset classes—not only U.S. stocks, bonds, and cash reserves, but international investments, short positions, foreign exchange, and various curios (gold, for example) from the financial marketplace. Such a range may be theoretically attractive, but the basic concept need not be so complex. Indeed, more than 14 centuries ago, the Talmud prescribed this simple asset allocation strategy: “A man should always keep his wealth in three forms: one third in real estate, another in merchandise, and the remainder in liquid assets.”
1 My advice is not much different from what is recommended in that ancient body of Jewish tradition and law.
Rather than real estate and merchandise, however, my focus is on the marketable securities for an investment portfolio: stocks and bonds. For simplicity’s sake, I omit cash reserves such as money market funds from the equation. Because they tend to deliver very modest returns, such reserves should be considered as savings for short-term and emergency needs, not as investment for long-term capital accumulation. For investors, short-term bonds are a superior alternative to money market funds. Short-term bonds are relatively insensitive to interest rate fluctuations; long-term bonds are hugely sensitive. Most of the examples presented in this book are based on intermediate-term and long-term bonds.
Like the Talmud’s asset allocation advice, my guidelines are simple: as a crude starting point, two-thirds in stocks, one-third in bonds. From the day I began my career in this business, I was imbued by my mentor, the late Walter L. Morgan, an industry pioneer and the founder of the Wellington Fund, with the philosophy of portfolio balance. Balance optimizes returns from the stock market in order to reach investment goals such as the accumulation of assets for retirement, but it holds the risk of loss to tolerable levels by ownership of some bonds, too. Despite (or perhaps because of ) the long bull market in stocks that has made balanced investing seem old-fashioned and stodgy to some advisers, I continue to advocate a balanced policy today—with more enthusiasm than ever.
My guidelines also respect what I call the four dimensions of investing: (1) return, (2) risk, (3) cost, and (4) time. When you select your portfolio’s long-term allocation to stocks and bonds, you must make a decision about the real returns you can expect to earn and the risks to which your portfolio will be exposed. You must also consider the costs of investing that you will incur. Costs will tend to reduce your return and/or increase the risks you must take. Think of return, risk, and cost as the three spatial dimensions—the length, breadth, and width—of a cube. Then think of time as the temporal fourth dimension that interplays with each of the other three. For instance, if your time horizon is long, you can afford to take more risk than if your horizon is short, and vice versa.
Risk to the Fore
So far, I’ve described risk mostly in academic terms: standard deviation, or the volatility of monthly or annual returns (described in Chapter 1). In truth, however, risk is something far more difficult to quantify. It relates to how much you can afford to lose without excessive damage to your pocketbook or your psyche.
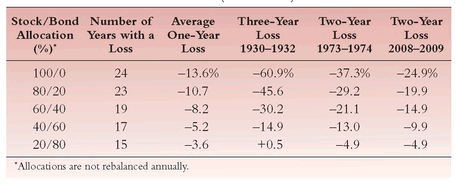
Table 3.1 offers some historical perspective on the frequency and severity of loss that investors with various allocations to stocks and bonds have suffered since 1926, the first year in which the definitive statistics on our modern stock market became available. During this period, the stock market has provided a negative return about once every three and a half years. The average loss in these years of decline has been 12 percent. The table also shows the extent to which this average decline has been muted by various holdings of bonds, ranging from 20 percent to 80 percent. For example, with a typical conservative balance of 60 percent stocks and 40 percent bonds, there would have been not 20 loss years, but 16—one every four years—and the decline would have averaged some 8 percent, or fully one-third less.
Perhaps the three-year market decline from 1929 through 1932 can give us a worst-case scenario. Then, an all-stock portfolio tumbled a staggering -61 percent. However, bonds actually rose by 16 percent, and an allocation of 40 percent bonds and 60 percent stocks, left untouched in the three years of collapse, lost 30 percent—only half as much. Forty years later, during 1973-1974, we experienced the second most calamitous market of the past 67 years. (Interestingly enough, this two-year period is the stock market’s most recent major market decline—a full quarter-century ago.) In that comparatively brief span, a portfolio invested only in equities, much like the allocations advocated by the current bull market’s most ebullient cheerleaders, would have shed -37 percent of its value (including dividends). Again, a 40 percent bond position would have moderated the decline. While a 21 percent short-term loss of capital is hardly inconsequential, it would have been only slightly more than one-half of the 37 percent loss reflected in the all-stock portfolio.
TEN YEARS LATER TABLE 3.1 Risk and Allocation (1926-2009)
Risk through the Seasons
Could these examples suggest that bonds are a better investment than stocks? Some investors, chastened by the stock market’s 1973-1974 collapse, might well have reached that conclusion. For the long-term investor, however, it would have been tragic to do so. For in the 23 years that followed, stocks provided an annual return of 16.6 percent, compared to just 10 percent for bonds. A portfolio that began with a 40 percent bond/60 percent stock allocation and was left untouched would have enjoyed a return of 14.6 percent. (At the end of the period, its stock allocation would have grown to 86 percent.)
TEN YEARS LATER
Risk and Allocation
Just as I warned about the possibility that the stock market decline of 37 percent during the two-year period 1973-1974 could represent a worst-case scenario, recent events appear to have borne out my caution. In fact, in 2007-2008, the market dropped by a remarkably similar 33 percent. That risk would have been reduced by a portfolio’s allocation to bonds; a 20/80 stock/bond allocation would have resulted in a return of -6.5 percent, again reasonably similar to the -4.9 percent negative return during that previous crash. (As
Table 3.1 shows, port folios with other allocations would also have had returns that paralleled those of the 1973-1974 case.) What comes next, of course, remains to be seen.
To be sure, during the two-year period 2008-2009, the market crash and subsequent rebound provided yet another worst- case scenario. The two-year cumulative return on stocks (through September 2009) totaled—25 percent, while the value of a 60/40 stock/bond portfolio would have declined by just 11 percent.
Bonds are best used as a source of regular income and as a moderating influence on a stock portfolio, not as an alternative to stocks. Remember, the goal of the long-term investor is not to preserve capital in the short run, but to earn real, inflation-adjusted, long-term returns. The stock market can dole out extremely heavy short-term losses, but, as we saw in Chapter 1, stocks have provided higher long-term real returns than bonds nearly all of the time—indeed, in 95 percent of all 25-year periods and 80 percent of all 10-year periods since 1802.
Real bond returns have been variable, but they have settled near a long-term average of 3.5 percent—half the 7 percent real return generated by stocks. In other words, stocks have delivered more than twice as much growth in purchasing power as bonds. As shown earlier, compounding that superficially small margin over the years makes a world of difference. Although stocks are extremely volatile in the short run, the long-term investor cannot afford not to take those risks.
And do not forget that even as return grows dramatically over time, so risk diminishes dramatically over time. As
Figure 1.3 in Chapter 1 illustrated, the volatility of stock returns quickly falls as the holding period lengthens. The one-year standard deviation on stocks drops from 18.1 percent to 2.0 percent over 25 years, but most of that drop has taken place by the end of just 10 years, when the standard deviation reaches 4.4 percent.
Benefiting from Balance
The greatest benefit of a balanced investment program is that it makes risk more palatable. An allocation to bonds moderates the short-term volatility of stocks, giving the risk-averse long-term investor the courage and confidence to sustain a heavy allocation to equities. Choose a balance of stocks and bonds according to your unique circumstances—your investment objectives, your time horizon, your level of comfort with risk, and your financial resources.
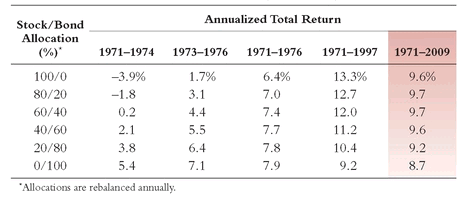
Table 3.2 shows the returns you would have earned under the various allocations shown above had you (a) held your stocks for the two years
before and during the 1973 -1974 decline; (b) held your stocks for the two years during and
after; and (c) held your stocks for all
six years, including the span of the decline. (The figures assume that at the end of each year in the periods displayed, after divergent stock and bond market performances had altered the initial allocation, the portfolios were rebalanced to their original proportions.)
Here is Chance writ large: even without summer, the prior spring and ensuing autumn were enough to provide positive returns in almost all of the portfolio allocations. Only the two most aggressive portfolios, with stock allocations equal to 100 percent and 80 percent of assets respectively, sustained losses, but only in the 1971-1974 period. Because the periods examined surround a ferocious bear market, the portfolios with the largest allocations to bonds did best in each of the three periods. In fact, a portfolio invested only in bonds would have done best of all.
TABLE 3.2 Risk, Time, and Allocation (1971-2009)
Look at the same allocations over time, however, and the data make a strong argument for heavy long-term investment in stocks. In the 27 years after 1970, return increased in direct proportion to a portfolio’s stock allocation. As shown in
Table 3.2, a portfolio with 80 percent of its assets in stocks and 20 percent in bonds earned an annual return of 12.7 percent. A portfolio with the opposite proportion—20 percent stocks, 80 percent bonds—returned 10.4 percent. Over the entire period, a $10,000 investment in the stock-heavy portfolio would have grown to $252,300, or $107,700 more than the $144,600 of capital accumulated in the bond-heavy portfolio. The greater the allocation to stocks, the greater the average long-term returns. Despite punishing winters, as in the early 1970s, the market’s seasons eventually change; spring comes, and then summer. A well-balanced portfolio is best positioned to benefit.
Striking Your Own Balance
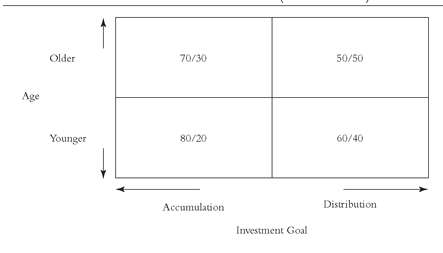
How can you determine an appropriate balance for your own needs? I continue to advocate the simple model represented in
Figure 3.1: a four-quadrant matrix with suggested allocations for older and younger investors who are in different stages of their investment life cycles. The model assumes that, over long time periods, stocks will outperform bonds, as they have since 1802. It also assumes that stock returns will be less predictable, as demonstrated by a higher standard deviation of returns. These assumptions are consistent with the historical record.
FIGURE 3.1 Basic Asset Allocation Model (Stocks/Bonds)
TEN YEARS LATER
Risk, Time, and Allocation
Despite the serious bear markets of 2000-2002 and 2007-2009, annualized returns on stocks since 1971 remained strong (9.6 percent per year), albeit well below their extraordinarily fine annual return of 13.3 percent during the earlier 1971-1997 period. (Note that the starting dates remained the same.) But we must remember that the period began with bond yields in the 9 percent range, so bond returns for the period were virtually identical to stock returns. Thus, the annual returns on portfolios with the various stock/bond allocations were also virtually uniform, ranging from just 8.7 percent to 9.7 percent.
It is unusual—but hardly unprecedented—for bond returns to be so competitive with stock returns. But when such a small equity premium exists, balanced fund investors do relatively well, in this case benefiting from both solid stock returns and bond returns far above history’s norm.
The main points of the matrix are based on common sense. During the accumulation phase of your personal investment cycle, when you are building assets, you are putting aside money that you would otherwise spend. (It’s never easy, but always essential.) You invest your capital, and you reinvest your dividends and your capital gains distributions. Because you have no immediate need for these assets, you can put your capital at greater risk in pursuit of higher return. As a younger investor, you might allocate as much as 80 percent or more of your portfolio to stocks, with the remainder in bonds. As the later years of your accumulation phase begin, you are older and you have less time to recoup any decline in the value of your portfolio. At that point, you might limit your stock exposure to no more than 70 percent.
During the distribution phase of your investment cycle—when you enjoy the fruits of the accumulation phase—you depend on a relatively fixed pool of capital to generate income for your needs. You are withdrawing the income generated by your investments, and you cannot afford a substantial short-term loss. At the start of the distribution phase, you might reduce your stock allocation to 60 percent or so. As you age, you might want to cut it to 50 percent. Even then, earning adequate income presents a challenge. In the latter part of 1998, with blue-chip stocks yielding about 1.4 percent and U.S. Treasury bonds yielding about 5.4 percent, a 50/50 balanced market portfolio was providing a yield of 3.3 percent. Given the average operating costs of the typical stock and bond fund, a similar mutual fund portfolio would yield only 2.0 percent—a reduction of almost 40 percent in your income. This simple calculation reinforces the giant impact of fund costs. The selection of funds in your asset allocation underlines why I repeatedly stress the vital role of fund costs in your investment decision-making process.
As you develop your strategic asset allocation, modify the model’s broad guidelines to account for your own financial circumstances, your age, your objectives, and your appetite for risk. It would not be imprudent for a highly risk-tolerant young investor (25 years old or so), who is just beginning to invest for retirement, to allocate everything to stocks, provided that the investor has confidence that regular investments could be made through thick and thin. In the distribution phase, a highly risk-averse older investor who has substantial means could cut the stock allocation to as low as 30 percent. A key factor in that decision is the relationship between the dollars to be invested and the capital already accumulated. A young investor just beginning with, say, a $150 monthly contribution to an individual retirement account (IRA) (or corporate defined-contribution pension or thrift plan) has time as an ally and has very little to risk at the outset. An older investor, in contrast, must consider both the opportunity for return and the hazard of risk on a far larger and more crucial amount of capital. The time is already upon us when a $1,000,000-plus accumulation in a tax-deferred plan is the standard for an investor who has enjoyed a reasonably rewarding career during 40 years in the workforce.
Age, Assets, and Asset Allocation—Mixed Reviews
That the combination of age and asset level provides a sensible proxy for risk level seems almost self-evident. A young person who is just beginning to accumulate capital, with a small amount at stake, is able to take considerable risk, seek maximum advantage from equity returns, and rely on time to iron out volatile short-term returns. An older person who has accumulated large assets has less time to recover possible losses and thus should seek greater certainty, lower risk, and sustained income return even at the expense of a lower capital return.
There are countervailing arguments. If you are young and scraping along, why take any equity risk? If you are old and have adequate retirement income, why not continue to emphasize equities and bequeath the largest possible estate to your heirs? Does not the younger investor, then, have a short-term time horizon and the older investor a time horizon that is almost infinite?
There are other facts of life, too. How much debt do you have? Is your cash flow positive or negative? Is your income rising or falling? What about college education for your children? How much can you expect from fixed-dollar pension benefits (including Social Security)? Are you an aggressive risk taker or a cautious conservator?
Academics raise the issue of human capital versus financial capital, too. The present value of the future labor of the young wage earner dwarfs the importance of investing. “I am the big gest asset in my portfolio,” as it were. Would not individuals do better to manage their own lives in a way that maximizes their huge human capital potential rather than to focus on the relatively smaller amount of financial capital they will likely accumulate? Aren’t the value of human capital and the value of the stock market both heavily influenced by the growth of the U.S. economy and thus apt to be highly correlated?
These are tough questions all, and worthy of your careful consideration. But using age and asset level as a rule of thumb in establishing an asset allocation baseline seems to me a wise starting point for most—granted, not all—investors, whose infinite variety of circumstances belies pat solutions. Asset allocation is not a panacea. It is a reasoned—if imperfect—approach to the inevitable uncertainty of the financial markets.
TEN YEARS LATER
Striking Your Own Allocation Balance
During the recent era, the basic principle of reducing your equity portion as you age and increasing commensurately your bond portion has been reaffirmed—and then some! The stock market crash of 2007-2009 played havoc with all-equity portfolios, but bonds, providing a positive return, did their expected job at moderating that risk.
Long before the crash, I had fine-tuned my rule-of-thumb asset allocation model, centered at 50/50 for older investors in (Continued) the distribution phase of their investment plan. Rather, I recommended—as a crude starting point—that an investor’s bond position should equal his or her age. An investor age 65, then, would consider the propriety of a 65/35 bond/stock allocation.
Clearly, such a rule must be adjusted to reflect an investor’s objectives, risk tolerance, and overall financial position. (For example, pension and Social Security payments would be considered bondlike investments.) But the point is that as we age, we usually have (1) more wealth to protect, (2) less time to recoup severe losses, (3) greater need for investment income, and (4) perhaps an increased nervousness as markets jump around. All four of those factors clearly suggest more bonds as we age.
Fine-Tuning Your Balance
Once you have determined a strategic long-term asset allocation, you must decide whether this balance will be relatively fixed or dynamic. There are two principal options. You can (1) keep your strategic ratio fixed, periodically buying and selling stocks and bonds to restore your portfolio to its original allocation, or (2) set an initial allocation and then let your investment profits ride. In the latter case, your initial allocation will gradually evolve to reflect the relative performance of stocks and bonds.
With the first option—the fixed allocation ratio—you will need to rebalance your portfolio from time to time. If strong stock markets transform your original allocation of 60 percent stocks and 40 percent bonds to a mix of 70 percent stocks and 30 percent bonds, you may need to sell stocks and invest the proceeds in bonds. This is easily done in a tax-deferred retirement account, where portfolio adjustments entail no tax liability. For taxable accounts, however, a sale of securities today is all too likely to trigger adverse tax consequences. If your holdings are primarily in a taxable account, a wiser course of action would be to redirect future contributions to bonds and gradually restore your portfolio to its original proportions. The advantage of a fixed-ratio strategy is that you automatically lock in your gains and reduce your equity exposure as equity prices increase. Correspondingly, you would increase your equity holdings (with the proceeds of bond sales, or by redirecting new investments) as stocks decline in value, which reduces your equity exposure; this would keep your original balance between risk and reward relatively constant. Many investors will find greater peace of mind with a stable balance of stocks and bonds—a strategy that is counterintuitive but may prove productive—than with taking no action and allowing risk exposure to rise in tandem with the stock market—a strategy that is intuitive but may prove counterproductive.
If you choose to let your original asset allocation ride, you will, in effect, be following a policy of benign neglect. After you have determined an initial allocation, your risk and reward balance will dance to the rhythms of the financial markets. What started as 60 percent stocks and 40 percent bonds might eventually become 75 percent or more in stocks and 25 percent or less in bonds. As a recent example, an investor in a 50/50 stock/bond program before the current bull market began in 1982 would, 16-plus years later, be 76 percent invested in stocks and 24 percent in bonds.
There is a third option, but only for bold and self-confident investors. It does not abandon the “stay the course” principle, but it allows for a midcourse correction if stormy weather threatens on the horizon. If rational forecasts indicate that one asset class offers a considerably better investment opportunity than another, you might shift a modest percentage of your assets from the class judged less attractive to the class judged more attractive. This policy is referred to as tactical asset allocation. It is an opportunistic, transitory, aggressive policy that—if skill, insight, and luck are with you—may result in marginally better long-term returns than either a fixed-ratio approach or benign neglect.
It’s grand to possess skill and insight, though all of us tend to overrate our abilities in both areas. But luck, too, plays a role. Many investors are right, but at the wrong time. It does no good to be too early or too late. Tactical asset allocation, if the strategy is used at all, should therefore be used only at the margin. That is, if your optimal strategic allocation is 65 percent stocks, limit any change to no more than 15 percentage points (50 to 80 percent stocks), and implement the change gradually. The prospect of having the skill, insight, and luck to eliminate your stock position overnight and restore it when the time is right is, in my view, patently absurd. Cautious tactical allocation may have a lure for the bold. Full-blown tactical allocation lures only the fool.
What might dictate moderate shifts in tactical asset allocation? One example: concern that stocks are substantially overvalued relative to bonds. Then, investors with conviction, courage, and discipline might benefit from a bow toward caution. I say “bow,” not “capitulation.” In an inevitably uncertain world, the reduction should not exceed 15 percentage points in your equity position. If you have 65 percent of your portfolio in equities, retain at least 50 percent; if 50 percent, at least 35 percent, and so on. A little caution may represent simple prudence, and, if you are relatively risk-averse, may enable you to sleep better, a blessing that is hardly trivial. One doesn’t have to have investment experience to recognize the wisdom in this saying, from a remarkably parallel field: “There are old pilots and there are bold pilots, but there are no old bold pilots.”
A Third Dimension
An ideal asset allocation incorporates the two most obvious dimensions of investing: risk and return. Investment costs represent a more subtle but equally critical third dimension of investing. The idea that cost rivals asset allocation in importance is not widely shared in the mutual fund industry. After all, with stocks having earned nearly 20 percent annually in the long bull market, and 30 percent annually in recent years, and with bonds yielding only about 5½ percent currently, asset allocation has dwarfed cost in importance. Costs rarely amount to much more than a few percentage points per year. So, industry lore has it that asset allocation must be given the highest priority. By ignoring the impact of costs, the industry implicitly argues that cost doesn’t matter. Industry lore is wrong.
A rigorous academic study, published in 1986, seemed to confirm the lore, however. In the
Financial Analysts Journal, authors Brinson, Hood, and Beebower reported: “Investment
policy (the allocation of assets) dominates investment
strategy (market timing and security selection), explaining on average 93.6 percent of the variation in total [pension] plan returns.”
2 This statement may well be the seminal citation on the subject of asset allocation. It is surely the most quoted.
The authors went on to say: “Although investment strategy can result in significant returns, these are dwarfed by the return contribution from investment policy—the selection of asset classes and their normal weights.” In other words, the return contribution from asset allocation dwarfs the other elements.
This finding for the 10 years through 1983 was reaffirmed for the 10 years through 1987 by Brinson, Singer, and Beebower in 1991, in a follow-up article published in the
Financial Analysts Journal.3 In the period ending in 1987, the impact of asset allocation was calculated at 91.5 percent, an inconsequential change.
Financial Scripture
When properly understood, the conclusion is, I think, beyond challenge. Unfortunately, however, it has been subject to considerable misunderstanding. It is often cited as meaning that asset allocation accounts for the differences in the annual rates of return earned by pension funds, rather than the quarterly variations of returns. I must confess that, at the outset, I made that same error by stating that the allocation of assets among stocks, bonds, and cash “has accounted for an astonishing 94 percent of the differences in total returns achieved by institutionally managed pension funds.” Happily, I qualified that shorthand summary by coming up with what is surely the correct conclusion: “Long-term fund investors might profit by concentrating more on the allocation of investments between stock and bond funds, and less on the question of what particular stock and bond funds to hold.” Although I stand by that conclusion today, I would surely add: “. . . as long as cost is held constant and low.” In other words, make your selections from among the lower-cost funds.
William Jahnke, a 1997 winner of the Graham & Dodd award for an outstanding article published in the
Financial Analysts Journal, exposed this widespread misinterpretation.
4 He noted that although asset allocation may explain 93.6 percent of the variation in quarterly portfolio returns, modest variations in short-term returns mean almost nothing to most investors. Using the original study’s data, Jahnke concluded that investment policy—a pension plan’s normal allocation to stocks, bonds, and reserves—explained only 14.6 percent of the differences in long-term total returns. Jahnke then offered his powerful conclusion: “For many individual investors, cost is the most important determinant of portfolio performance, not asset allocation policy, market timing, or security selection.”
5I find myself, perhaps uncharacteristically, with both feet planted firmly on the middle ground. Asset allocation is critically important; but cost is critically important, too. When compared to these two issues, all the other factors that go into investing in a diversified portfolio of high-grade stocks and bonds pale into insignificance.
How Costs Change the Perspective
The Brinson/Hood/Beebower study (hereinafter, BHB) did not account for advisory fees and administrative and custody costs. In fairness, there was probably no need to do so. Given the nature of the study—its focus was primarily on quarterly variations rather than on cumulative annualized returns—and the nature of institutional pension plans in which there are fairly moderate variations in advisory fees (fees are set at competitive levels within narrow ranges—probably from 0.4 percent to 0.8 percent of assets annually), cost would likely have had little impact on the conclusions.
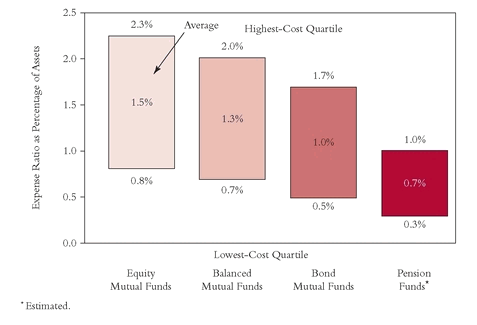
Costs in the mutual fund industry are a different matter. They vary widely and are generally much higher than those paid by pension funds. Equity fund expense ratios average 1.5 percent annually and range from 0.2 percent to 2.2 percent or more. Balanced funds today carry average expenses of 1.4 percent, and range from 0.2 percent to 1.8 percent or more. Bond funds range from 0.2 percent to 1.5 percent or more. (See
Figure 3.2.) These wide variations in costs among mutual funds only marginally affect their quarterly returns, but they have a great impact on the differences in long-term returns. Mountains of data strongly affirm that the cost of investing goes hand in hand with asset allocation as the key determinant of long-term returns. The bottom line:
Costs matter.TEN YEARS LATER
Expense Ratios
The expense ratio profiles for equity funds, balanced funds, bond funds, and pension funds are basically little changed from where they stood a decade ago. In each group, the highest-cost quartile of funds carries expense ratios averaging over 1 percentage point more than those in the lowest-cost quartile—compounded over the long term, a huge savings. (As I’ll later explain, how ever, expense ratios are by no means the only costs that fund investors incur.)
TEN YEARS LATER FIGURE 3.2 Portfolio Expense Ratios
In analyzing the role of costs, I chose balanced mutual funds because their asset allocation patterns are similar to those of the pension funds studied by BHB—usually, about 60 percent to 65 percent in common stocks. The results, based on the 10 years ended December 31, 1997, clearly reaffirmed the basic finding of BHB: the impact of asset allocation dwarfs the impact of market timing and stock selection. In fact, 84.9 percent of the variation in the quarterly returns of the balanced funds was explained by asset allocation, a figure closely akin to the pension fund result. The similarity was striking, as the comparison of results in
Table 3.3 reveals.
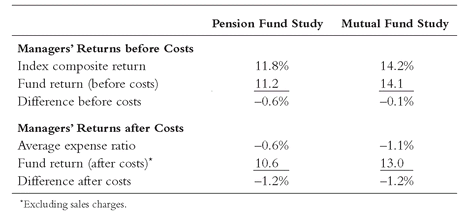
Turning from variations in return to total return, both the pension plans and the mutual funds displayed returns before expenses that fell slightly short of the returns of the market index benchmarks. For the pension study, BHB used a market benchmark comprising the Standard & Poor’s 500 index for stocks, the Lehman Government/Corporate Bond Index for bonds in the first study and then the Salomon Broad Investment Grade Bond Index for bonds in the second study, and U.S. Treasury bills for cash. For the balanced mutual fund study, we used similar benchmarks: the Standard & Poor’s 500 index for stocks, the Lehman Intermediate-Term Corporate Bond Index for bonds, and U.S. Treasury bills for cash. (In neither the BHB study nor our study did the results vary significantly if the all-market Wilshire 5000 Equity Index was used instead of the S&P 500.)
What we are witnessing (as has been reaffirmed over what seems like time immemorial) is the failure of active managers,
on average, to outperform appropriate market indexes, even before costs are deducted. It didn’t matter whether the managers were advising pension funds or mutual funds. In neither case were they particularly successful. (See
Table 3.4.)
TABLE 3.4 Performance of Managers of Mutual Funds and Pension Funds
The failure of active managers to add value by outpacing passive market indexes largely reflects undistinguished individual stock selection (or, if you will, highly efficient markets). The actual subtraction of value is likely caused by portfolio transaction costs (which surely exist, although they can’t be quantified with precision). Together, these two factors doubtless played a heavy role in the shortfalls experienced by both the pension funds and the mutual funds relative to the unmanaged index portfolios.
When we take operating expense ratios into account, however, the failure of the managers becomes self-evident.
h Table 3.4 also presents the after-cost results of our study. Note that the total shortfall in return was 1.2 percent annually in both cases, a reduction of about 8 percent in the market index return. Expenses accounted for 92 percent of the mutual fund shortfall. What is more, since the decade covered by the study, the expense ratio of the average balanced fund has risen from 1.1 percent to 1.4 percent, an ominous sign that future shortfalls are apt to be even larger.
As it turns out, there is a fairly systematic relationship between the costs and net returns of the balanced funds in our sample. Indeed, when costs are eliminated from consideration, the gross returns of the second, third, and fourth quartiles are nearly identical at about 14.0 percent for 1987-1997 and 7.0 percent for 1994-2009. The results are illustrated in
Table 3.5. Not surprisingly,
in each quartile, lower costs ineluctably lead to higher returns.TABLE 3.5 Balanced Funds: Returns versus Costs
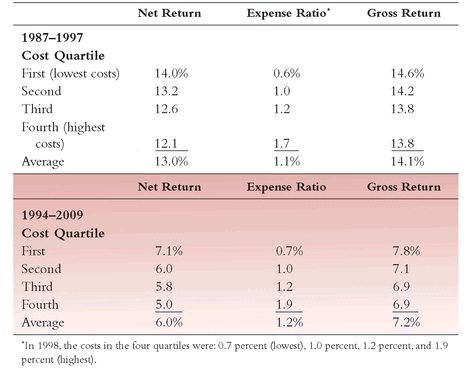
The icing on the cake is that the lowest-cost groups also achieved superior returns while taking no more risk than the balanced fund averages. Differences in asset allocation policy among these balanced funds (four of the funds carried significantly higher proportions of common stocks than the group average) accounted for some moderately significant differences in total return. But when risk (measured by standard deviation) was taken into account, only the lowest-quartile expense groups distinguished themselves with outstanding risk-adjusted returns. Specifically for 1987 -1997, the average risk-adjusted return (using the Sharpe ratio
i) of the lowest-expense quartile was 15 percent
above average while the risk-adjusted returns of the three quartiles with higher expenses were all 4 percent
below the average of the group. (The average Sharpe ratio for the funds in the lowest-cost quartile was 0.94; each of the three higher-cost quartiles averaged about 0.79.) This relationship drives home the “costs matter” thesis with powerful force.
The conclusion of this study of balanced mutual funds, then, demands the addition of this important caveat (in italics) to the BHB statement: “Although investment strategy can result in significant returns, these are dwarfed by the return contribution from investment policy, and the total return is severely impacted by costs.”
This conclusion is derived not only from the limited evidence provided by this study of balanced mutual funds, but also in an exhaustive study of the returns of all 741 domestic equity mutual funds in operation from 1991 to 1996. When fund investment styles (growth versus value) and market capitalization (large versus small) are taken into account, funds in the lowest-cost quartile outpaced funds in the highest-cost quartile with remarkable consistency, as we’ll show in Chapter 6. We see the same broad impact repeated in bond funds, discussed in detail in Chapter 7.
TEN YEARS LATER
Balanced Fund Costs and Returns
Updating the data on costs and returns of balanced funds of a decade ago, and extending the period to 15 years confirms the earlier conclusions with near perfection. As expenses go up, returns go down, quartile by quartile. The advantage in return earned by the funds in the low-cost quartile was 1.9 percent per year in the previous period, and 2.1 percent in the recent period. And the same peculiar (but enjoyable) pattern emerges in both: the lowest-cost funds not only have the highest net returns (as we would expect) but the highest gross returns, even before costs are deducted. (Again, the second period paralleled the first—the low-cost funds earned a pre-expense annual return advantage of 0.9 percent in the recent period, almost identical to the 0.8 percent advantage in the former.) It’s not clear just why this should be, but it is a pattern that further enhances the simple, low-cost strategy: “Do your fishing in the low-cost pond!”
Low Costs Magnify Fund Returns
Further, for whatever reason, low costs systematically magnified the gross return advantage earned by the top-quartile funds, giving them an even larger edge. Randomness seems an unlikely explanation; perhaps the higher-cost funds reached for extra income yield or lower - grade securities to offset their excess expenses, but the implicit extra risk came home to roost. In any event, for the balanced funds, every 10 basis points of lower expenses accounted, on average, for 17 basis points of enhanced net return. Leverage, if such it were, almost doubled the negative impact of higher cost.
To give some context to what this mathematics means, consider this example: A 10 percent net return on a high-cost fund would translate, not merely into an 11.1 percent return for a balanced fund with a 1.1 percent expense ratio advantage (high-cost balanced funds with expense ratios averaging 1.7 percent; low-cost funds, 0.6 percent), but into an 11.9 percent total return.
That would be a 19 percent enhancement of the 10 percent annual return of the high-cost fund. When compounded over 10 years, the advantage is huge; over 25 years, it soars; and over 50 years, the advantage is truly stratospheric—a 2½-fold increase in value, from $1.174 million to $2.764 million (see
Table 3.6). As I have noted, 50 years is no more than an investment lifetime for investors who begin to invest in a 401(k) tax-deferred savings plan at age 25 and are living off the fruits of their accumulation at age 75. The figures in the table speak for themselves.
With the powerful impact of costs—and the favorable leverage that has accompanied it—we can now turn to the implications of costs for asset allocation policy, focusing on the relationship between long-term stock returns and bond returns.
TABLE 3.6 Cumulative Impact of Costs on a $10,000 Investment
| Years | High Cost 10.0% Return | Low Cost 11.9% Return |
|---|
| 10 | $ 25,900 | $ 30,800 |
| 25 | 108,300 | 166,200 |
| 50 | 1,173,900 | 2,763,800 |
Three Perspectives on the Impact of Cost
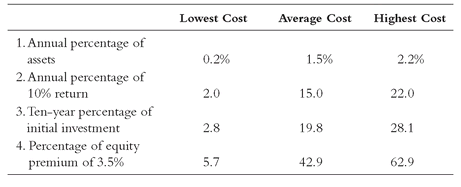
The customary perspective for investors is to consider fund expenses as a percentage of assets—in the mutual fund field, the stated expense ratio. These ratios range from 0.2 percent of assets annually for the lowest-cost equity funds (often, as it happens, market index funds) to 1.5 percent for the average equity fund and 2.2 percent for highest-cost equity funds (those in the top quartile in terms of expense ratio). Even the highest of these figures, however, tends to trivialize the impact of cost for the uninitiated. An investor might ask: “Does a percentage point or so really matter?”
A second perspective shows that it matters a great deal: Consider expenses as the percentage of an initial investment consumed over a 10-year holding period. Here, the range would be only 2.8 percent for the lowest-cost funds, 19.8 percent for the average fund, and a healthy (or unhealthy!) 28.1 percent for the highest-cost funds. Converting these percentages into dollars may lend even more impact to this perspective. An 0.2 percent annual cost on an initial investment of $10,000 (assuming that the investment appreciated at 5 percent annually) would cost the investor only $280 over 10 years. But at 2.2 percent, the 10 - year cost would be $2,810. That’s real money. As you can imagine, the mutual fund industry is not particularly smitten by this perspective, for it brings the cost issue into sharp relief.
Costs can also be thought of from a third perspective—as a percentage of the expected annual return on equities. Using the same examples—expense ratios of 0.2 percent, 1.5 percent, and 2.2 percent—and assuming long-term market returns of 10 percent, costs would consume 2 percent, 15 percent, and 22 percent of annual return, reducing the net return earned by investors to 9.8 percent, 8.5 percent, and 7.8 percent, respectively. This drain is substantial, though it is seldom referenced by fund promoters. However, it is a stark fact of investment experience.
And a Fourth Perspective
There is also yet a fourth perspective on cost: cost as a percentage of the equity risk premium. It provides the most striking perspective of all. To assess the impact of cost on the equity risk premium, let’s take a simple example. Assume that the expected return on long-term U.S. Treasury bonds is 6 percent and the expected return on stocks is 8.5 percent. The risk premium would be 2.5 percent. Taking an extreme example, if equities carried a risk premium of 2.5 percent over long-term U.S. Treasury bonds, and if an equity fund carried a high total cost of 2.5 percent (say, an expense ratio of 2 percent and transaction costs of 0.5 percent), the investors would be indifferent in making the choice. Theory would say that the long-term returns of the two investments over time would be identical. There would be no premium for assuming the extra risk. Cost would have consumed 100 percent of the equity risk premium.
Viewed in this light, all of the costs in investing—advisory fees, other fund expenses,
and transaction costs—bite into the risk premium. The difference is simply a matter of
degree, although at the highest cost levels it is arguably a difference in
kind because it changes the very character of the returns.
Table 3.7 shows the percentage of the risk premium consumed by mutual fund expenses at various risk-premium levels. For simplicity, transaction costs, which could add another 0.1 percent to 1.0 percent to the cost impact of the expense ratios, are ignored in the table, giving the funds the benefit of a very large doubt.
TABLE 3.7 Percentage of Equity Risk Premium Consumed by Expenses
The Equity Risk Premium
The equity risk premium is, simply stated, the extra return required by investors to compensate them for taking the extra risk of owning common stocks rather than risk-free U.S. Treasury bonds. The premium can be calculated either in retrospect (i.e., the spread between the two returns over a given past period) or prospectively (the difference between the expected future returns of each).
Judging from the levels of today’s stock and bond markets, a 2 to 3 percent risk premium might be a reasonably cautious guess for the coming decade. Indeed, many respected investment advisers (a few are noted in Appendix I) have placed the probable number at less than 2 percent.
Asset Allocation and Cost
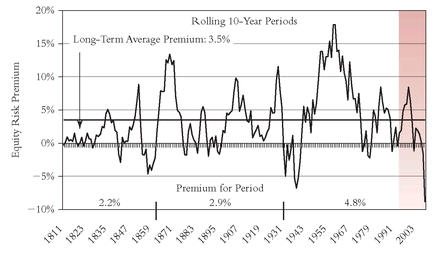
The average equity risk premium over history (since 1802) has been 3.5 percent. As
Figure 3.3 shows, this premium has ranged between zero and 5 percent in about 50 percent of all periods, consistently exceeding that upper bound
only during the 10-year periods ending between 1947 and 1970. Since no one can be certain about future premiums, I will rely on this 3.5 percent average during the rest of my analysis. Let’s imagine that you are an investor who is confronting the real world of mutual funds today, and you examine what happens when you come to make your asset allocation decision. For the purpose of argument, let’s assume you expect to maintain a stock-bond ratio of 65 percent/35 percent, and you want to determine the implications of cost on your decision. Further, let’s assume a long-term return of 10 percent on stocks and 6.5 percent on long-term Treasurys, and a risk premium of 3.5 percent. You decide to hold a Treasury bond for the bond allocation. For the equity allocation, your choice is between a fund in the lowest-cost range (0.2 percent) and a fund in the highest-cost quartile (an expense ratio of 2.2 percent). The low-cost program provides a return of 8.6 percent; the high-cost program, a return of 7.3 percent (see
Table 3.8).
FIGURE 3.3 Equity Risk Premium versus Long-Term U.S. Treasury Bonds (1802-2009)
TABLE 3.8 Cost, Returns, and Asset Allocation
| Annualized Return |
|---|
| Low-Cost Fund | High-Cost Fund |
|---|
| Equity allocation | 9.8% | 7.8% |
| Bond allocation | 6.5 | 6.5 |
| 65/35 Composite | 8.6% | 8.5% |
That 1.3 percent spread in assumed return—with risk held constant—is a meaningful difference. The low-cost program would build an assumed investment of $10,000 to $22,800 in 10 years and to $78,700 in 25 years (taxes excluded). The respective results for the high-cost program would be $20,200 and $58,200, with the latter figure representing a staggering $20,500 shortfall for the long-term investor over 25 years—more than twice the amount of the initial investment.
But now let’s look at the situation slightly differently, from the standpoint of risk premium. Assume you accept the basic premises I’ve used—a 10 percent return on stocks and a 3.5 percent equity risk premium—and you are investing with the hope and the objective of receiving a long-term return of 7.5 percent. Question: What allocation would you make, given a choice between a low-cost equity fund and a high-cost equity fund? Answer: If you select the low-cost program, your required ratio would be 30 percent stocks and 70 percent bonds. But if you select the high-cost program, your ratio would be 75 percent stocks and 25 percent bonds. To say the least, the difference in risk exposure is dramatic. In fact, you would have to raise your risk expo sure by 2½ times to earn the same return in the high-cost portfolio.
TEN YEARS LATER
The Equity Risk Premium
During the 1980s and 1990s, the average risk premium earned by stocks over long-term U.S. Treasury bonds remained close to the long-term norm of 3.5 percent. But after surging to about 7½ percent, the equity risk premium went into a tail- spin, turning to negative by 1.5 percent in the decade ended in 2007, with stocks returning 3.4 percent and bonds returning 4.9 percent. By 2008, it had reached an all-time low negative of -8.8 percent (stocks -3.1 percent, bonds 5.7 percent). So of course the seemingly impossible can always happen. But with stocks returning perhaps 7 percent to 10 percent in the coming decade, and Treasury bond yields at about 4.5 percent, we can look forward again with the hope (and, I think, the expectation) that the risk premium will return to positive territory.
Put another way, you could reduce your exposure to the risk of the stock market by 45 percentage points—a reduction of 60 percent—by the simple expedient of choosing the low-cost fund. This example obviously assumes that other factors are held constant—in effect, that costs make a systematic difference in long-term performances. It also assumes what we have learned from long years of experience: no single top-performing fund can be selected in advance. However, experience tells us that the top-performing group of funds can be selected in advance, simply by relying on low cost as the criterion.
We may know history’s appraisal of the equity premium in the past, but we
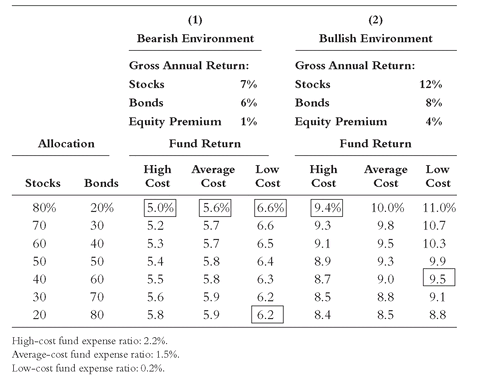
never can be certain of what equity premium will prevail in the future. Let’s consider the implications of two future environments, one bearish and the other bullish: (1) an equity return of 7 percent and a bond return of 6 percent, resulting in a risk premium of 1 percent; and (2) an equity return of 12 percent and a bond return of 8 percent, resulting in a risk premium of 4 percent. (See
Table 3.9.) In case (1), the low-cost stock fund consumes 20 percent of the 1 percent risk premium, compared to 220 percent (!) for the high-cost fund. (Please recall that fully 25 percent of stock funds in the industry have costs averaging 2.2 percent.) In case (2), expenses of the low-cost fund would consume 5 percent of the 4 percent risk premium; the high-cost fund would consume 55 percent.
In sum, if you accept my premises and my forecast ranges, fairly obvious choices can be made, as reflected in
Table 3.9, showing returns achieved by high-, average-, and low-cost portfolios at various allocations. For example, in case (1), the bearish environment, an investor could choose an 80 percent
bond portfolio and earn 6.2 percent, a higher return than the 5.0 percent net return on a portfolio 80 percent invested in higher-cost
stock funds. In case (2), the bullish environment, an investor choosing a low-cost 40/60 stock/bond portfolio could expect a return of 9.5 percent, even larger than the 9.4 percent return on a portfolio with twice as much in stocks (high-cost 80/20). That is, the investor could earn a higher return despite a 50 percent reduction in equity exposure, simply by taking costs into account. Higher return
can be earned hand in hand with the assumption of lower risk.
Is It Cost or Asset Allocation?
Table 3.10 summarizes these four perspectives on the impact of costs on asset allocation. They clearly reaffirm our earlier amendment of the BHB conclusion: “Although investment strategy can result in significant returns, these are dwarfed by the return contribution from investment policy,
and the total return is severely impacted by costs. ”They also illustrate that Jahnke makes a point worth considering when he goes even further: “For many individual investors, cost is the most important determinant of portfolio performance.”
As you consider the issue of asset allocation and determine your own asset allocation strategy, consider the choices that are available:
1.
Annual costs as a percentage of assets managed. (This is the conventional measure.) You can pay an expense ratio of 0.2 percent of assets or one at 2.2 percent of assets. The choice is yours.
2. Annual costs as a percentage of the total equity return. You can relinquish from 2 percent to 22 percent of your annual return. The choice is yours.
3. Cumulative costs as a percentage of the initial capital. You can pay from 2.8 percent to 28.1 percent of initial capital over a period of a decade (from $280 to $2,810 on a $10,000 investment). The choice is yours.
4. Annual costs as a percentage of the equity risk premium. This is an important new concept. You can relinquish from 5.7 percent to 63 percent of the historical premium norm. Again, the choice is yours.
These key alternatives will heavily influence your asset allocation decisions and subsequent investment performance. You need only realize that costs truly matter. This concept must take its proper place as a high priority, not merely an afterthought, as investors decide on the proper strategic asset allocation for their investment portfolios. For there proves to be a simple solution to the riddle of performance attribution.
Is performance determined by asset allocation or by cost? Common sense gives us the answer to that question, and the data reaffirm it: Both.
TEN YEARS LATER
Asset Allocation
Even after having my principles tested in the crucible of a rot ten decade for stocks, there’s hardly an idea—or even a word—that I would change in my recommendations in establishing an appropriate allocation of assets in investor portfolios. But I believe that I was far too cautious in my estimates of mutual fund costs. My error was relying solely on a fund’s expense ratio to calculate the impact of costs.
In fact, the average expense ratio of 1.5 percent is only part of the story. Most actively-managed equity funds also incur hidden portfolio turnover costs, perhaps averaging an additional 0.5 to 0.8 percent per year. In addition, I failed to take into account the impact of sales loads charged by most funds. A 5 percent front-end load, amortized over five years, costs 1 percent a year; over 10 years, it costs 0.5 percent a year. So a central all-in cost figure could easily come to 2½ percent annually. In
Table 3.10, the middle example would then read 2.5 percent of assets; 25 percent (!) of a 10 percent return, 53 percent of the initial investment, and an astonishing 71 percent of an assumed 3.5 percent equity premium.
Yes, if your goal is to minimize the portion of risky assets in your portfolio to produce the most efficient risk-adjusted return, low costs are essential. What is the point, after all, of relinquishing nearly three-quarters of an equity premium that exists to compensate you for the risks you are assuming? Original case reaffirmed: minimizing investment costs is part and parcel with minimizing portfolio risk.


