Chapter 7
On Bonds
Treadmill to Oblivion?
Bond mutual funds can fill a useful role. They make it possible for investors to gain the extraordinary value of broad diversification over as many as 100 bonds (or more), reducing risk without an attendant sacrifice in gross return. Bond funds are professionally managed, and most emphasize high-quality, investment-grade bonds in their portfolios. Many offer a particular range of maturities, from short (one to three years) to long (10 to 20 years or more), with gradations in between, enabling investors to balance their income requirements with their tolerance for risk. Bond funds provide considerable flexibility to investors by facilitating purchases and liquidations of shares in small amounts. Some bond funds offer these important advantages at reasonable cost. Most, however, do not. Partly as a result, the once-flourishing bond fund segment of the mutual fund industry has lost much of its attraction for investors.
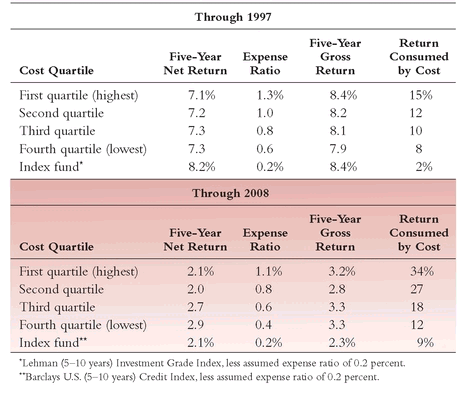
The rise and decline of the bond fund empire is one of the most captivating, yet untold, chapters in the annals of the mutual fund industry. That story reminds us that the mutual fund principles of diversification and management—as valid today as they have ever been—cannot provide acceptable returns to investors when they are offset by excessive cost encumbrances. It also provides a picture of the complacency and overreaching characteristic of many managers of fixed-income funds.
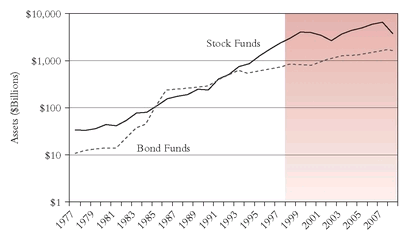
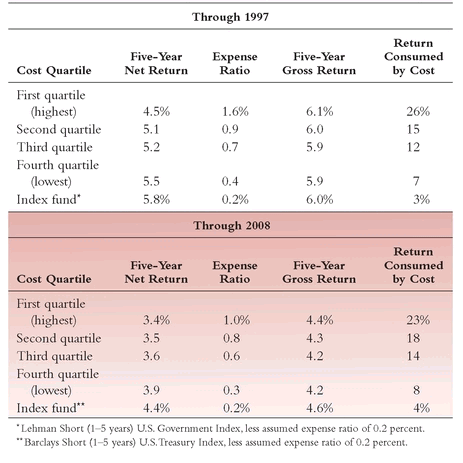
Surprising as it may seem, as recently as 1993, bond funds—then with assets of $760 billion compared to $749 billion in stock funds and $565.3 billion in money market funds—were the largest component of the mutual fund industry. In fact, they had reached their peak relative importance seven years earlier, in 1986, when bond fund assets of $260 billion were 60 percent larger than the $160 billion invested in equity funds.
Since 1986, we have seen a powerful resumption of both of the long post-1982 bull markets. In the booming stock market, fund investors have enjoyed record returns (17.7 percent per year). A very good bond market also brought generous returns to bond fund investors (8.6 percent), but those returns paled in comparison with the returns achieved by stock funds. Partly—but only partly—as a result, bond fund assets of $1 trillion as 1998 began made an equally pale comparison with the $2.4 trillion in assets of equity fund—bond fund assets were now some 60 percent smaller than equity fund assets.
TEN YEARS LATER
Bond Funds
During the past decade, bond funds have been the tortoise of the fund industry, their assets creeping upward year after year, and rising on balance from $700 billion at the start of 1998 to $1.8 trillion in 2009. Stock funds have been the hare, with assets soaring from $2.4 trillion to $6.5 trillion, only to tumble to a 2009 total of $4.0 trillion.
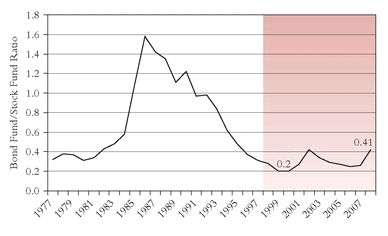
So bond funds are now equal to 45 percent of stock fund assets, half again the 30 percent figure of a decade ago. As I noted then, “once the equity market environment turns more sober, future bond fund returns may well prove to be more competitive with stock fund returns.” Both predictions, as it turned out, were remarkable understatements of what’s happened since.
But the relative performance of the stock and bond markets was only one of two major causes of the huge decline in the relative importance of the once-dominant bond fund component of the industry. The other factor is this: As a group, bond funds have failed to provide investors with adequate returns relative to those achieved in the bond market itself.
Figure 7.1A shows the booming stock fund assets and the slowing of bond fund growth. The dramatic rise and decline in the importance of bond funds relative to equity funds are shown in
Figure 7.1B. Once the equity market environment turns more sober, future bond fund returns may well prove to be more competitive with stock fund returns. But, unless the bond fund industry changes its ways and gives shareholders a fair shake, bond funds will be on a treadmill to oblivion.
FIGURE 7.1B Bond Fund Assets Relative to Stock Fund Assets
Misery Loves Company
I am not
quite alone in my concern about today’s bond funds as a group. My apprehension is shared by no less an investment professional than Peter Lynch, best known as the brilliant equity investor who served as portfolio manager of Magellan Fund during the 1970s and 1980s. He publicly shared, in a 1990 interview with
Barron’s, my positive conviction about the merits of stock index funds, and he has also echoed my misgivings about bond funds. “Their purpose in life eludes me,” he says, adding:
Bond funds [have been] consistently outperformed by individual bonds, sometimes by as much as 2 percent a year . . . [doing] worse the longer the funds were held. The benefits of expert management were exceeded by the expenses that were extracted from the funds to support the experts.
1In his opinion: “Since one U.S. Treasury bond or Ginnie Mae certificate is the same as the next, there is little a manager of one of these funds can do to distinguish himself from competitors.”
But the Magellan Fund manager, I think, overstates the case. Bond funds do serve a purpose. Unlike bonds themselves, they usually maintain relatively fixed maturities, enabling an investor to choose a suitable maturity (long-, intermediate-, or short-term) and have it remain relatively constant over time. And there are some competent professional bond fund managers that stand out, although, sadly, only a very small fraction among them make their services available at costs that justify the portfolio management skills they offer.
Nonetheless, Peter Lynch revealed a simple investment truism: In highly efficient market segments comprising commodity-like securities, it is extremely difficult for even the most brilliant money managers to garner a significant margin of advantage—before the deduction of costs. It follows, then, that it is virtually impossible for them to avoid providing returns to the shareholders of the funds they manage—after the deduction of fund costs—that match market returns. When costs are excessive, the shortfall in return is excessive, too.
What Is a “Commodity”?
I use the term commodity-like to define investment classes in which individual securities follow closely related patterns of return. The classic example would be long-term U.S. Treasury bonds. Each issue is backed by the full faith and credit of the U.S. government; each has a long-term maturity; and each has a similar duration. A change in the level of interest rates affects each one in a similar pattern. Investment-grade short-term corporate bonds also share common characteristics and return patterns. Widely diversified packages of Ginnie Mae securities—issued by the Government National Mortgage Association (GNMA), and backed by loans, mortgages, and a U.S. Treasury guarantee—also have parallel characteristics. Each of these examples fits the definition of “commodity-like” that typifies the various types of bonds.
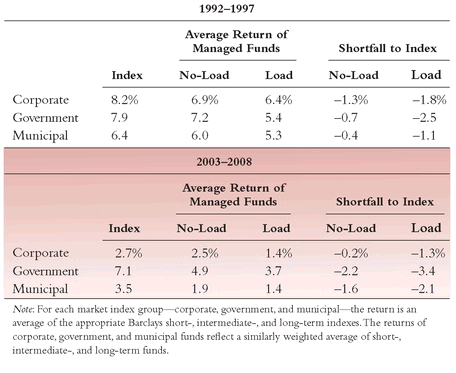
Fund expenses exert a powerful influence on bond fund returns. Over a recent five-year period, for example, the return of an average corporate bond
fund lagged the return of the corporate bond
market by an average of 1.5 percent per year. Strikingly, this disparity from market returns contains within itself a second important disparity. That average gap of 1.5 percent consisted of a 1.3 percentage point shortfall for the no-load bond funds, and a 1.8 percentage point shortfall for the much larger group that charges sales loads (front-end loads or hidden annual 12b-1 fees). The same pattern is apparent in the government bond and municipal bond arenas (see
Table 7.1).
Facing the situation that this differential cost structure exemplifies, Peter Lynch presents the sales charge issue in this way: “Another mystifying aspect of bond fund mania [and, I would agree, when he wrote his 1993 book,
Beating the Street, it was almost a mania] is why people are willing to pay a . . . sales charge, a.k.a. load, to get into bond funds.” He is not
really mystified, however, for that question quickly led him to “Peter’s Principle #5: There’s no point in paying Yo-Yo Ma to play the radio.”
2 Once again, we agree. Yet, apparently without challenge from fund directors, or managers, or even investors, fully three of every five bond funds get away with charging a sales load. Indeed, three-quarters of the assets of all bond funds are owned by shareholders who have paid a sales load as the price of admission to a game that, as a rule, is not worth playing.
TABLE 7.1 Returns of Bond Funds versus Bond Indexes
TEN YEARS LATER
Managed Bond Funds
During the decade ended mid-2009, bond returns were indeed strong. Among intermediate-term bonds, corporates earned an annual return of 6.3 percent, Treasurys 5.7 percent, and municipals 5.3 percent. After compounding, cumulative returns came to some 81 percent, 71 percent, and 66 percent, respectively, leaving the cumulative -14 percent returns of the stock market in the proverbial dust. While during the past five years the returns of Treasurys were even higher than in the previous edition, the returns of corporates and municipals were lower, as higher interest rates depressed the value of existing bonds.
Given these generally lower returns, the impact of costs has been even more dramatic. As shown in
Table 7.1, man aged bond funds carrying sales loads have earned far less than no-load bond funds in each category, and
roughly one-half of the returns of the comparable bond index. That is precisely the same pattern—albeit more extreme—that was described here a decade ago. So the continued dominance of bond funds carrying sales loads vis-à-vis their no-load peers remains a testament to the unwisdom of investors, the scandalous pecuniary incentives of bond fund salespeople and bond fund managers, and the shocking lassitude of bond fund directors.
A Flagrant Example
Let me cite just one example of the impact of costs on returns in that most efficient of all bond markets: short-term government bonds. The funds in this category carry an annual expense ratio handicap of 1.03 percent. Expense ratios range from as low as 0.69 percent for the average no-load fund to 1.49 percent for the average load fund (and their expense ratios do not even include the initial sales charges). Just to make the point clear, imagine this: for the average no-load bond fund, cost would consume 13 percent of the recent 5.0 percent yield on the U.S. Treasury 2½-year note; for the average load fund, it would consume 29 percent. That penalty could fairly be described as confiscatory.
Assuming a 5.0 percent yield for the Treasury note, the net return of a fund with a 1.5 percent cost would be 3.5 percent. Raising that 3.5 percent to 5.0 percent would require the manager to earn an extra 1.5 percentage points—that is, an enhancement of more than 40 percent! What do you think are the chances that a mutual fund manager could select a portfolio of short-term Treasury notes that would somehow add nearly 40 percent to the return of a short-term Treasury portfolio—that is, enough to overcome the cost handicap and merely match the market’s return? If you were to argue that the chances are 1 in 10,000 (I doubt they are that good!), my next question would be: What chance would you have of identifying that manager in advance? It doesn’t seem like a bet worth making. Yet high-cost short-term government bond funds, some of which carry sales loads, are rife in the industry.
And it gets worse. Some funds, desperate to provide market yields, make a practice of purchasing Treasury notes at a premium and then publishing a yield—and actually paying a dividend—that fails to amortize that premium. (In fairness, the funds are also required to report an “SEC yield” that is net of amortized premiums.) Result: higher income now, but a guaranteed capital loss later when the bonds, purchased at a premium, mature at par value. For a horrible example, consider that shareholders of one fund—which had more than $1 billion in assets—experienced a decline in net asset value from $10.19 per share in 1991 to $8.62 as 1998 began—a capital loss of 15 percent for a “safe” investment in U.S. government-guaranteed short-term paper.
These negative examples of what is happening in the bond fund arena set the stage for a comprehensive examination of the role of costs—expense ratios and sales charges—in shaping returns. All bond funds are not created equal. Bond index funds differ from actively managed funds. Low-cost funds differ from high-cost funds. Different managers have different skill levels. In all, some bond funds give investors the right to overpay; others (a much smaller number) give investors the right to a fair shake. The principal conclusion may be obvious: Cost matters.
How Much Does Cost Matter?
To determine just how much cost matters, let’s examine the extent to which cost undermines returns in four large, diverse groups of bond funds, in each of which policies are based on clearly defined maturities and portfolios are invested largely in high-quality issues. The four largest bond fund segments are: (1) long-term municipal bonds; (2) short-term U.S. government bonds; (3) intermediate-term U.S. government bonds (including GNMAs); and (4) intermediate-term general (largely, investment-grade corporate) bonds. In all, 448 funds—representing bond fund groups that account for about 60 percent of all bond fund assets in the Morningstar list—are included in our study, clearly a representative sample.
The results are consistent and uniform. In three of these four segments, the low-cost quartile outpaced the high-cost quartile by an amount very closely equivalent to the difference in expense ratios; that is, each quartile had about the same gross return, and costs accounted for substantially all of the return differences. In the fourth case, returns in the low-cost quartile ran only slightly above returns in the high-cost quartile, but the high-cost funds held portfolios that were significantly riskier in every respect. In each case, the measurement of risk was based on three factors:
1.
Duration,
o a better measure than average maturity when evaluating a fund’s sensitivity to interest rate risk.
2. Volatility, a measure of the variations in a bond fund’s monthly returns relative to the average taxable or tax-exempt bond fund.
3. Portfolio quality, using ratings by Standard & Poor’s Ratings Services. Investment-grade bonds are rated from AAA (highest) to BBB (lowest).
In general, the lowest-cost group had the lowest duration, the lowest volatility, and the highest quality. The lowest-cost group had not only the highest returns, but also the lowest risks. Bond fund investors simply cannot afford to ignore that message.
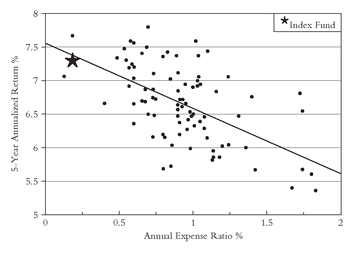
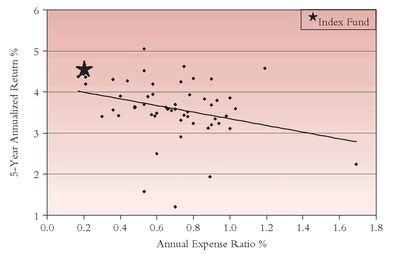
Long-Term Municipal Bonds
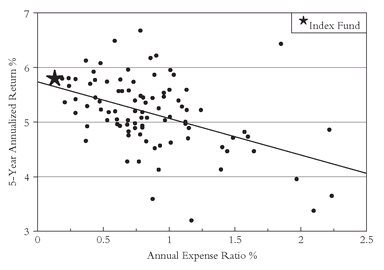
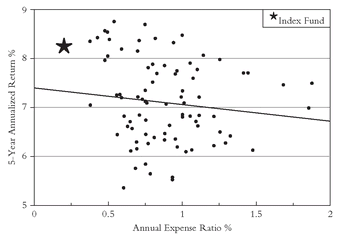
First, consider high-quality long-term municipal bonds. I began with a look at the entire set of funds in this group, using five-year returns as reported by
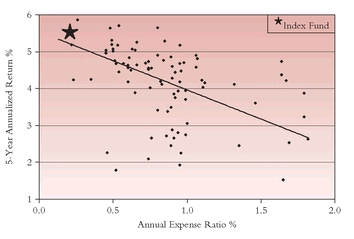
Morningstar Mutual Funds. There are 92 funds in this group. The scatter diagram in
Figure 7.2 presents, for each fund, the annual rate of return (vertical axis) and the annual expense ratio (horizontal axis). For purposes of illustration, I also show the results of a hypothetical municipal bond index fund, although it would be difficult to replicate, reducing the return by assumed annual costs of 0.2 percent.
The obvious conclusion: Returns go down as costs go up. It’s as simple as that. In fact, as the trend line on
Figure 7.2 shows, each percentage point reduction in costs, on average, increased returns by 1.04 percentage points. Perhaps the managers of the high-cost funds weren’t quite as smart as the managers of the low-cost funds. But we can be sure that cost is a prime determinant of the relative returns of long-term municipal bond funds.
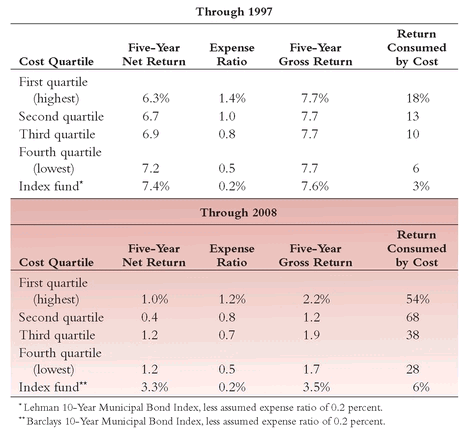
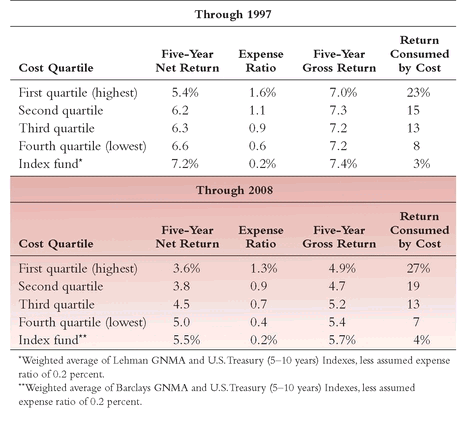
Dividing the funds into four quartiles, ranging from the highest-cost to the lowest-cost funds, we see a direct relationship between low cost and high return (
Table 7.2). Expenses in the low-cost quartile were 0.9 percentage points
lower than in the high-cost quartile, and returns were 0.9 percentage points
higher. Equally obvious is the fact that, in both high-cost and low-cost funds, the
gross returns earned by the funds were actually the same (7.7 percent). The advantage provided by the lowest-cost managers lay in the fact that they consumed the smallest percentage of the returns available in the long-term tax-exempt bond market—6 percent, versus 18 percent for the high-cost managers. The expenses of the low-cost hypothetical index fund consumed only a tiny fraction (3 percent) of return, an efficiency that can hardly be found wanting.
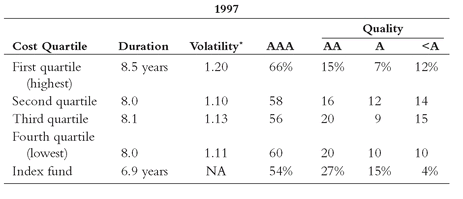
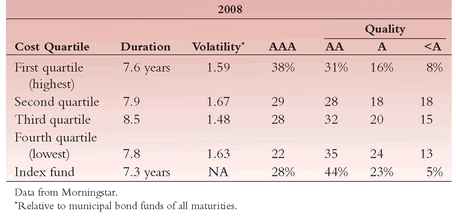
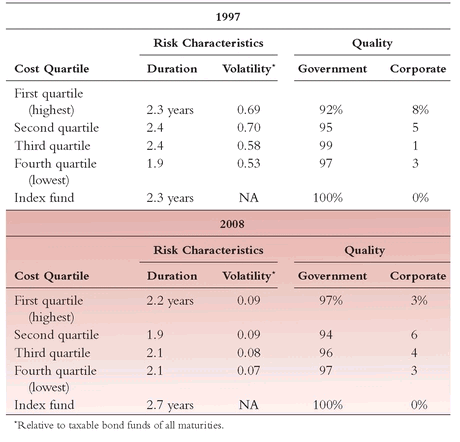
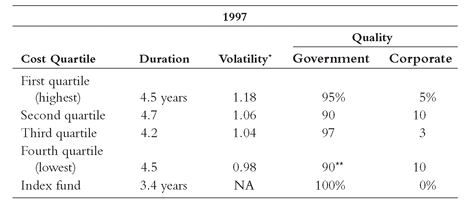
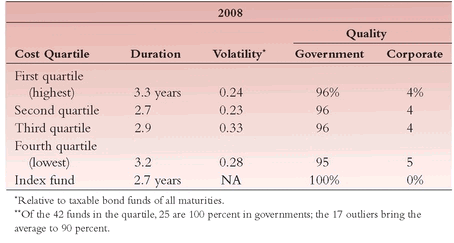
How about the possibility that differences in volatility, in quality, or in duration played a role? The differences in duration and volatility that exist among the regular long-term municipal bond funds
favor the lowest-cost funds, but the difference is slight. And, as
Table 7.3 shows, their portfolios also have the smallest position in the lowest-grade bonds. The clear conclusion: With risk almost a constant, the winning return in long-term municipal bond funds is achieved by the group with the lowest costs.
FIGURE 7.2 Long-Term Municipal Bond Funds (Five-Year Performance through 12/31/97)
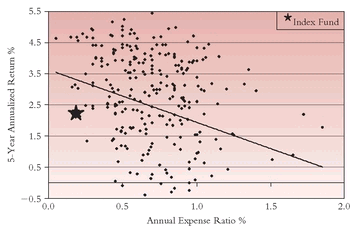
TEN YEARS LATER FIGURE 7.2 Long-Term Municipal Bond Funds (Five-Year Performance through 12/31/08)
Despite earning a higher net return than any of the quartiles, the index fund carried, by a wide margin, the lowest risk. Its volatility rating was not available, but its duration was the shortest; its portfolio quality, with only 4 percent below A-rated, was among the highest, and its return, as shown in
Figure 7.2, was outstanding.
TABLE 7.2 High-Quality Long-Term Municipal Bond Funds: Returns and Costs
TABLE 7.3 High-Quality Long-Term Municipal Bond Funds: Risk Characteristics
TEN YEARS LATER
Long-Term Municipals
While returns on long-term municipal bonds were much lower during the past five years than the five-year period covered in the previous edition, the role of costs was even more powerful. Then, each percentage point drop in costs led to an increase of 1.0 percentage point in return; now, that same cost reduction led to an extra return of fully 1.3 percentage points. Once again, the hypothetical bond index fund was at the top of the return scale and the bottom of the cost scale. (See
Figure 7.2.) While the volatility of long-term municipal funds had risen and investment quality was slightly reduced (but remained high), portfolio durations were little changed. Simple low costs accounted for most of the difference in the net returns eventually earned by investors.
Short-Term U.S. Government Bond Funds
For our second example, we’ll move all the way down the maturity spectrum to short-term funds, with U.S. government bond funds as our example. Returns and costs for the entire group (100 funds) are displayed in
Figure 7.3.
We reach the same conclusion: Returns go up as costs go down. The trend line shows that each 1.0 percentage point reduction in costs increased returns by 0.9 percent. There are some good reasons why it turns out to be a little less than a full point; we’ll get to those after we sort out the funds by cost quartile (
Table 7.4). Note that an index fund—which would be easy to create in this market segment—would again be a powerful competitor.
Note that the lowest-cost funds provided a gross return of 5.9 percent, or, after a 0.4 percent expense ratio, a net return of 5.5 percent. The high-cost funds earned a bit more (6.1 percent), but, after a heavy 1.6 percent expense, delivered only 4.5 percent to investors—more than a full percentage point less.
Here again, we see a direct relationship between low cost and high return. The question comes down to this: Which would you rather have, managers who pick short-term government bonds for you and take 26 percent of what they earn, or managers who pick the same bonds and take 7 percent of the return for their efforts? In short, would you rather earn 93 percent or 74 percent of the market return?
As it turns out, return is not the only issue here. We might expect that other things would be equal in such a generic asset class as short - term government bonds. But let’s at least examine the possibility of inequalities in risk characteristics, including duration, volatility, and quality, as shown in
Table 7.5.
Here, we learn something worth knowing: The low-cost fund group not only delivers the highest returns but it also assumes the lowest risks, measured both by duration and price volatility. (The index fund duration is the same as that for all funds as a group.) Because the funds are in the short-term U.S. government category, nearly all holdings are in U.S. government bonds, and credit quality is excellent throughout, although only the index fund holds 100 percent governments. The slight lowering of risk as cost declines helps to explain why each point of reduction in cost accounts for slightly less than a full point of higher return. It also suggests that high-cost managers assume higher risks in a futile attempt to provide competitive yields.
FIGURE 7.3 Short-Term Government Bond Funds (Five-Year Performance through 12/31/97)
TEN YEARS LATER FIGURE 7.3 Short-Term Government Bond Funds (Five-Year Performance through 12/31/08)
TABLE 7.4 Short-Term U.S. Government Bond Funds: Returns and Costs
Low-cost short-term government bond funds—and the very low-cost index fund—let you have your cake and eat it, too. They provide the highest returns, hand in hand with the lowest risks, truly a winning combination.
TABLE 7.5 Short-Term U.S. Government Bond Funds: Risk Characteristics
TEN YEARS LATER
Short-Term Government Bond Funds
Returns on short-term U.S. Treasury bonds also fell in the recent period, albeit, with their short duration, substantially less than the decline experienced by long-term municipal funds. But the sloping line in
Figure 7.3 tells much the same story: Each 1.0 percentage point drop in expense ratio led, on average, to an increase of 0.8 percentage points in annual return. (In the previous chart, the increase was 0.9 percentage points.) The hypothetical index fund—after assumed costs of 0.2 percent—again led the performance derby. Virtually all of the Treasury funds maintained similar (high) quality, but the lowest- cost quartile demonstrated the lowest volatility risk, among the lowest
gross returns, and the highest
net returns. Higher reward, paradoxically, was accompanied by lower risk.
Intermediate-Term U.S. Government and GNMA Funds
Now let’s move from long and short maturities to intermediates. Perhaps the best test of our thesis is the relationship between costs and returns among intermediate-term U.S. government and GNMA funds. (Both have demonstrated very similar returns over time, and Morningstar—properly, I think—includes both in a single 169-fund category.) By now, this pattern of cost and return is familiar, but let’s look at it again in
Figure 7.4.
In this case, with each percentage point reduction in cost, return rises by 1.10 percent, a similar pattern to what we’ve seen in long-term and short-term bond funds. It hammers home the validity of the central thesis: In bond funds of
all maturities, cost and return are inextricably interlinked.
Table 7.6 reflects our thesis once again. The low-cost quartile earns about the same gross return (7.2 percent) as the three others, but delivers a net return (6.6 percent) that is 10 percent higher. And the index fund once again distinguishes itself, earning among the highest returns of any of the funds.
Quartile by quartile, then, we see substantially similar gross returns, but a large gap remains in net returns, substantially all of which is engendered by cost. If there are differences in risk, they too are quickly resolved in favor of the lowest-cost funds (see
Table 7.7).
Average durations of the higher-cost funds are about the same as the low-cost intermediate-term government fund group in total, but it turns out that the low-cost funds carry about 20 percent lower volatility than their higher-cost peers. The index fund duration is more than 20 percent lower. Portfolio composition is fairly uniform. So, with duration, volatility, and portfolio quality all in the same ballpark, cost carries the day, dollar for dollar. The index fund once again distinguishes itself not only with a strong relative return, but with a low relative risk.
FIGURE 7.4 Intermediate-Term Government Bond Funds (Five-Year Performance through 12/31/97)
TEN YEARS LATER FIGURE 7.4 Intermediate-Term Government Bond Funds (Five-Year Performance through 12/31/08)
TABLE 7.6 Intermediate-Term U.S. Government and GNMA Funds: Returns and Costs
TABLE 7.7 Intermediate-Term U.S. Government and GNMA Funds: Risk Characteristics
TEN YEARS LATER
Intermediate-Term Government Bond Funds
Once again, the message was consistent: Low cost was the dominant factor in producing high return. In the previous edition,
Figure 7.4 showed that each 1.0 percentage point drop in costs resulted, on average, in a 1.1 percent rise in return. This time, a similar drop in costs resulted in an even higher 1.6 percentage point increase in return. Another pattern was also consistent: The hypothetical intermediate-term bond index fund, by a wide margin, led in net returns.
In terms of volatility, deviation, and quality, there were again few significant differences among the funds. But with expense ratios averaging just 0.4 percent per year, the lowest-cost quartile of funds produced a return nearly 40 percent above the average return of the funds in the highest-cost quartile.
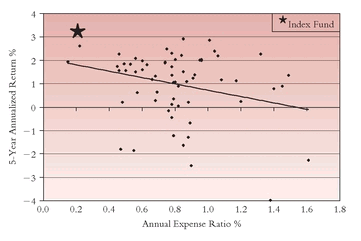
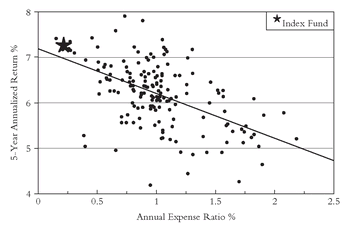
Intermediate-Term Corporate Bond Funds
One more example sends the same message, but sends it in a different language and hammers home the point. In the intermediate-term corporate bond fund category, net returns are fairly constant irrespective of costs, though the lower-cost funds still tend to deliver slightly higher returns to investors. The index fund again proves to be a singularly excellent performer, making its mark high atop the group. Its low costs enable it to provide higher returns, and it holds only investment-grade corporate bonds, none of which carry a rating below BBB.
FIGURE 7.5 Intermediate-Term Corporate Bond Funds (Five-Year Performance through 12/31/97)
TEN YEARS LATER FIGURE 7.5 Intermediate-Term Corporate Bond Funds (Five-Year Performance through 12/31/08)
As you can see in
Figure 7.5, the slope of the return/cost line runs downward, but not as steeply as in our previous examples. The slope shows that each 1.0 percentage point reduction in cost provides a 0.3 percent increase in return.
This same pattern becomes clear when we examine the four cost quartiles in
Table 7.8. The lowest-cost group provided a market return advantage of 0.2 percent—7.3 percent versus 7.1 percent—over the highest-cost group, although its cost advantage was a much more substantial 0.7 percent—0.6 percent versus 1.3 percent.
TABLE 7.8 Intermediate-Term Corporate Bond Funds: Returns and Costs
TABLE 7.9 Intermediate-Term Corporate Bond Funds: Risk Characteristics
How have these high-cost managers been able to offset most of their large-cost handicap? Was it because their high fees somehow endowed them with greater management skills? Or did they reach out for higher yields by assuming higher risks?
Table 7.9 provides a clear answer to that question: They took more risks.
As
Table 7.9 makes clear, with each higher level of cost—without a single exception—the managers assumed higher risk. They seem to have been determined to provide competitive returns, and, given their higher costs, they had no recourse but to assume higher risks. This apparent relationship, as far as I know, has remained undisclosed. But it is there, in the form of higher duration, higher price volatility, and lower portfolio quality: a striking difference between the lowest-cost portfolios (83 percent in governments and A-rated corporates, and 9 percent in below-BBB bonds) and the highest-cost portfolios (only 57 percent in governments and investment grades and 19 percent in below-BBBs). The same direct dollar-for-dollar trade-off between return and cost that we’ve seen before has been supplanted in part by a reverse trade-off between risk and cost. It is in corporate bond funds that the trade-off is at its most obvious. Nonetheless, lower-cost funds, despite assuming far lower risks, garner slightly larger returns.
What the data reveal about the corporate bond index fund is rather striking. As you would expect, part of its value-added is low cost, but it also gains from a moderately long duration (5.4 years versus 4.9 years for the managed funds), and a credit risk that may be a bit higher (no government bonds, but no bonds below BBB either). In fact, the corporate bond group, as defined, includes hybrid corporate-government funds, and the index fund wins, not only because of low cost, but also through the higher returns it amasses by living up to its definitional purity as a truly corporate bond fund.
TEN YEARS LATER
Intermediate-Term Corporate Bond Funds
When we turn to the updated final illustration in
Figure 7.5, we are no longer surprised to see that intermediate-term corporate bond funds demonstrate the very same downward-sloping line that characterized the other bond categories—both in the recent period and in the earlier period. While in the prior period each 1.0 percentage point drop in expense ratio resulted in a 0.3 percentage point increase in annual return, in the recent period that same expense decline was accompanied
(Continued) by a remarkable increase in annual return of fully 1.7 percentage points.
Interestingly, these differences in return are not explained by differences in investment quality or duration. (All cost quartiles held largely investment-grade portfolios, although the lowest-cost group held more bonds rated A or better and fewer bonds rated less than BBB.) But in this rare case, the hypothetical bond index fund produced a return lower than the active funds, largely due to (1) a significantly longer duration (6.2 years versus an average of about four years), leaving it more exposed to the rise in interest rates, and (2) the discrepancy between the index composition—which is made up entirely of corporate bonds—and that of the average fund—which holds 16 percent of its portfolio in government bonds. Governments provided returns that were far above the returns of the corporate sector in the final two years of the period.
What about Management Skill?
Our analysis of the relationship between bond fund cost and returns seems rather conclusive: Cost matters. But cost is not the
only ingredient that shapes returns. If it were, the first three scatter diagrams presented in this chapter would not have such a varied pattern. In fact, the dispersion around the trend line can be measured at an average R-squared
p of less than 0.36. (An R-squared of 1.00 would place every fund right on the line, meaning that cost explained not 36 percent but 100 percent of return.) The return of a bond index fund compared to a bond index would be explained almost entirely by the costs it incurs, plus an element of market-matching skill by its managers. The low cost of the bond index fund (assumed to be 0.2 percent) largely explains its superiority over managed funds.
Although both duration risk and volatility risk contribute to the dispersion of returns, management ability is also a material force in shaping returns. And there are indeed some skilled professional managers at work in bond funds. The best of them are competent, experienced, and wise in the ways in which the fixed-income markets work. Their funds may or may not be operated under disciplined portfolio guidelines relating to quality and maturity, and only investors can decide which type of strategy they prefer. But each fund should clearly describe its strategy for all to see. Beyond strategy, some portion of the record—as in all aspects of investing—will be based on skill and some portion on luck. The two are not easy to separate, nor is enduring skill easy to identify in advance. Past returns earned as a result of management ability provide little, if any, assurance about the future.
What course, then, should the investor follow? Common sense would dictate making bond fund selections primarily from among funds in the lowest-cost quartile, the better to maximize the chances of enjoying returns above segment norms and of avoiding at least the highest-cost quartile. Bond index funds would be exceptional options, but few such funds exist. (Given that their benefits go almost entirely to fund shareholders rather than fund managers, there is little monetary incentive for managers to offer them.) Nonetheless, it will always be possible—and always challenging—to garner an advantage by owning a fund that provides both skilled management and low cost. The investor who is able to accentuate the positive and eliminate the negative in this way will be rewarded.
Sales Charges Exacerbate the Cost Issue
Before I examine the issue of awareness of bond fund shareholders about the trade-off between return and cost (and, to some degree, risk), I should note that the comparisons just presented ignore the outright sales charges that are payable when investors purchase shares, or when they redeem shares within five years of purchase. (However, hidden 12b-1 sales charges, where applicable, are included in the expense ratios I’ve shown.) Thus, my analysis gives a benefit of enormous doubt to funds that charge the traditional front-end and the newer back-end sales charges.
Ironic as it may seem, funds that charge sales commissions dominate the high-cost groups, and no-load funds dominate the low-cost groups. For example, among the 21 intermediate-term corporate bond funds in the highest-cost quartile, 17 entail front-end sales charges for investors, and none is pure no-load. Among the 22 funds in the lowest-cost quartile, on the other hand, only four entail front-end sales charges, and 18 are pure no-load. Industry data ignore the impact of these charges, but investors ignore them at their peril.
But they do ignore them. In the industry’s two principal distribution channels, no-load bond fund assets of $165 billion are dwarfed by the $482 billion in assets of broker-distributed high-cost bond funds carrying sales charges (including $122 billion of assets managed by the brokerage firms themselves). Two things are apparent about the brokerage firms that manage bond funds: (1) they charge high management fees, and (2) despite what would seem an insurmountable expense hardship for their clients, they are able to levy sales charges on them, too. From the point of view of the clients, that has proven to be a very expensive combination.
A dispassionate observer of the passing parade of contradictions within these giant national brokerage firms would be mystified. On the
third floor of their buildings (let’s call it the institutional trading floor), their bond traders are bickering over a tick (in the parlance of the trade, a tick is

of a percentage point on a $1,000 bond, or about 31 cents). The traders are prepared to commit mayhem for 1
⁄16 (two ticks), and to take out swords and pistols, ready to kill, for 1/8 (four ticks). Yet, on the
first floor of the same building (call it the retail sales floor), their account executives seem able to utterly ignore the baneful impact of 32 ticks (one full percentage point)—or even 50 ticks (1.6 percentage points)—that are laid on their customers year after year. It may make a lot of sense for the sellers, but it makes no sense for the buyers.
Fee Dollars Are Real Money
Broker-managed funds are not alone in charging high prices. Despite their profound impact on returns, fees have run amok throughout the bond fund arena. Even large funds with fee rates below industry norms are paying fee dollars to their advisers in amounts that are truly astonishing—they amount to, using current parlance, “real money.” For example, one of the largest GNMA funds (with assets of $8 billion) paid its investment manager $44 million in 1997, although the fund has achieved returns that fail to even match the returns of an unmanaged index of GNMA securities. (The fund also pays 12b -1 fees of $9 million and administrative expenses of $10 million.) How much of that $44 million fee could the manager be spending on management? If we assume there are two portfolio managers, one or two credit researchers (after all, the credit quality of GNMAs is guaranteed by the U.S. Treasury), several bond traders, and a certain amount of occupancy and overhead costs, perhaps the aggregate cost could reach $5 million. (However, an even larger GNMA fund, with higher returns, as it happens, pays its investment adviser just $1 million.) Where does the other $39 million of the fee go? The only obvious place is the pocket of the fund manager. Why shouldn’t some of it go into the pockets of fund shareholders in the form of lower fees, thereby providing them with a portion of the staggering economies of scale that fund management involves?
One can only wonder what defenses are available against overreaching when advisers in the highest-cost quartile of bond funds are consuming some 20 percent of fund returns, leaving only 80 percent for shareholders, who have, after all, ponied up 100 percent of the fund’s capital. These shareholders are not receiving a fair return on their investment. Even worse, the percentage of benefits received by shareholders
declines with the passage of time. Yet those who buy and sell funds ignore the cumulative impact of high costs in commodity-like segments of the bond market that provide relatively modest returns. Currently, bonds yield about 6 percent on average; even a 1 percent cost reduces that return to a 5 percent yield for fund shareholders, a reduction of 17 percent.
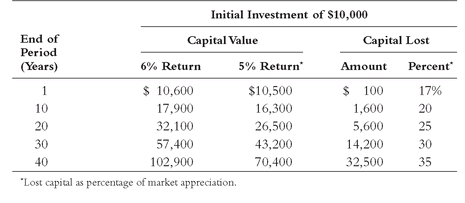
Table 7.10 shows the impact of that difference on a $10,000 initial investment over time. The reduction in final value engendered by a cost of 1 percent rises to 20 percent over a decade, and to a truly confiscatory 35 percent after four decades. Ignorance of this cumulative cost may be intellectual bliss. But it is financial devastation.
TABLE 7.10 How Costs Consume Bond Fund Returns over Time
TEN YEARS LATER
The Impact of Fees
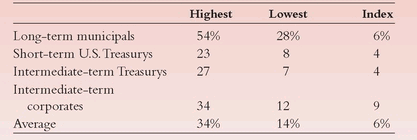
With the lower bond returns of the past five years, the confiscation of investors’ assets by excessive fees reached huge proportions. This table tells the story:
Share of Total Return Consumed by Expenses Cost per Quartile
The choice is yours. Rely on the highest-cost bond funds, and expect to lose 34 percent of your return to fund managers. Or rely on bond funds with the lowest costs, and expect to relinquish only 14 percent. Or, even better, use bond index funds, whose low costs consumed only 6 percent of expenses, leaving 94 percent of the return for you.
How to Avoid Excessive Costs
Certain defenses, although too few in number, exist for avoiding the fee overreaching that is suggested by the return-risk-cost trade-off in the bond fund arena. Those same trade-offs exist for equity funds, but they tend to have a larger impact on the lower returns that have characterized bonds over time. Unfortunately, few of the defenses seem to be working. The National Association of Securities Dealers (NASD), the self-regulatory organization that oversees brokerage firms and fund distributors, imposes a requirement of suitability for brokers in their choice of investments for their clients. But when low-cost options exist in the bond fund arena, how can a fund that consumes 20 percent or more of the market returns be suitable? The Securities and Exchange Commission (SEC) requires full disclosure. However, the financial fact that higher returns (or lower risks) are associated hand in hand with lower costs is not mentioned, let alone fully disclosed, to investors in bond fund prospectuses.
qIf stricter disclosure does not come to pass, enabling investors to make these judgments, and if fund directors do not place the interests of shareholders ahead of the interests of fund advisers and reduce fund fees, then how are shareholders to protect themselves? Rely on common sense. Read the prospectuses carefully. If they are not clear or forthcoming, demand answers. Carefully consider risk, defined by volatility, duration, and portfolio quality. And, above all, seek well-managed bond funds that are available at low cost.
Low-cost bond fund options do exist today. But there are not very many. Only one of every 20 bond funds in the Morningstar five-year database has an expense ratio below 0.5 percent, which I regard as the upper limit of a fair cost. These funds consistently rank in the high range of returns among the top-quartile performers. Why aren’t there more low-cost options? When will investors demand them and advisers supply them? Why aren’t there more bond index funds? The grand total, as far as I can tell, is 20—an astonishing total in light of the data presented here. That paucity is appalling in commodity-type market segments where fund cost is a critical determinant of returns to shareholders, and where an index fund can be run for 20 basis points or less. Why can’t the industry resolve these critical anomalies—clean up the mess, if you will—that have been created by these exorbitant fees?
Bond fund investors should no longer suffer excessive costs. They deserve substantial reductions in fees and loads from the vast majority of funds that are charging fees that become more confiscatory with the passage of time. The preceding table illustrates the treadmill that leads to ever more inadequate bond fund returns, and finally approaches oblivion for the incremental return on the investor’s capital. Continued failure to provide adequate returns will surely lead to the fall of the near $1 trillion bond fund empire, itself a treadmill to oblivion that would represent some form of poetic justice. But I would rather see a treadmill that leads to the oblivion of exorbitant sales charges and excessive management fees. If that happens, the valuable investment characteristics of bond funds could emerge, and the bond funds segment of the mutual fund industry could be restored to the favor it deserves in the marketplace.
I hope that regulatory and self-governance mechanisms will finally work. But, failing that outcome, it is up to investors to eschew high - cost bond funds when they make their selections, to desert high-cost bonds if they own any, and to seek out well-managed bond funds operating at low cost, and bond index funds that track high-quality bond market indexes. Finally, the future of the bond fund industry is up to bond fund investors.
TEN YEARS LATER
Bond Funds in the Coming Decade
In mid-2009, yields on long-term municipal bonds averaged 5.1 percent—very close to the 5.3 level of a decade ago. Yields on short-term Treasurys and on intermediate-term Treasurys have tumbled—to less than 1.0 percent and 2.8 percent, respectively. And yields on intermediate-term investment-grade corporates, then 6.9 percent, have fallen to 5.4 percent. Since the current yields of longer-term bonds are fine signals of their future returns, you must carefully consider the arithmetic that shows what portion of the future returns will likely go to the investor, and what proportion is consumed by the manager.
Don’t forget to take into account the grossly negative value proposition involved in buying bond funds with sales loads. While there may be managers of stock funds that can overcome this cost burden, bond fund managers are inevitably conspicuous by their absence from even that small group. This message is clear, convincing, and enduring.
I should note a relatively new addition to the bond menu. In 1997, the U.S. Treasury began to offer “inflation-protected” bonds, in which the interest paid rises in tandem with the increase in the consumer price index (CPI). Inflation-protected bonds are available in maturities ranging from 5 to 30 years. Currently, the 10-year yield of 1.7 percent on the inflation-protected bond is about one-half the 3.4 percent yield on the regular 10-year Treasury, meaning that market participants expect inflation to average 1.7 percent over the next decade. If inflation is lower, the regular bond is the better bet; if inflation is higher (and it may be much higher), the inflation-protected bond would be the preferred alternative.
In these uncertain days, bond funds are an especially important option for investors. Unlike stock funds, they have high predictability in at least these five ways: (1) The current yields (on longer-term issues) are an excellent—if imperfect—predictor of future returns. (2) The range of gross returns earned by bond managers clusters in an inevitably narrow range that is established by the current level of interest rates in each sector of the market. (3) The choices are wide. As the maturity date lengthens, volatility of principal increases, but volatility of income declines. (4) Whether taxable or municipal, bond fund returns are highly correlated with one another. Municipal bond funds are fine choices for investors in high tax brackets, and inflation-protected bond funds are a sound option for those who believe that much higher living costs will result from the huge federal government deficits of this era. (5) The greatest constant of all is that—given equivalent portfolio quality and maturity—lower costs mean higher returns. (Don’t forget that index bond funds—or their equivalent—carry the lowest costs of all.)