Chapter 10
On Reversion to the Mean
Sir Isaac Newton’s Revenge on Wall Street
At first blush, the principle of reversion to the mean might seem a slightly dry and uninspiring subject. I assure you, it is anything but that. This principle from the theoretical world of academe has proven to be wholly pragmatic in the very real world of the financial markets. It is evident in the relative returns of equity mutual funds, in the relative returns of a whole range of stock market sectors, and, over the long term, in the absolute returns earned by common stocks as a group. Reversion to the mean (RTM) represents the operation of a kind of law of gravity in the stock market, through which returns mysteriously seem to be drawn to norms of one kind or another over time. This application of the universal law of gravity might even be characterized as Sir Isaac Newton’s revenge on Wall Street.
As investors, many of us have chosen mutual funds as all or part of our investment programs. Whether funds are a part of your portfolio or not, you have probably carefully considered your own financial circumstances and risk tolerances, and decided on your optimal allocation of assets between fixed-income investments and stocks. And if you share in the powerful and rarely challenged ethos of our era—that common stocks are virtually certain to provide the highest returns of any major asset class over the long term—a substantial portion of your program may well be invested in equity funds.
Assuming that is the case, how should intelligent investors who select mutual funds undertake the task of choosing them? Let me start with my own assessment of how not to go about it: basing selections principally, or even importantly, on the records of exceptional past performance that are published and promoted by the hyperbolic marketing machine that drives the mutual fund industry today. You will be well served if you ignore those claims. The overpowering lesson of history—as I have been trying to persuade you in earlier chapters—is: In the long run, a well-diversified equity portfolio is a commodity, providing rates of return that are highly likely to resemble closely and finally fall short of those of the stock market as a whole.
By the end of the period over which you may accumulate your nest egg, be it 10 years or 50 years, the odds are that a fund’s gross rate of annual return will approximate that of the stock market. I choose the word gross with care. Given the excessive costs borne by most mutual funds—including the fully disclosed (if often ignored) direct expenses (used for operating, marketing, and investment advisory costs, and for generous profits for managers) plus the hidden costs of fund portfolio transactions—the net rate of return of the funds as a group and, over the long run, of individual funds has tended to lag the market by from 1.5 to 2.5 percentage points annually. These differences in annual returns, if extended over long periods of time, will make a dramatic difference in your final capital.
Mutual Fund Champions Come Down to Earth
In periods as short as one year, many mutual funds—especially small, aggressive ones—can and do defy the odds. In some decade-long periods, perhaps one out of five funds succeeds in doing so by a material amount. But in the very long run, there is a profound tendency for the returns of high-performing funds to come down to earth, and, less inevitably, for the returns of low-performing funds to come up to earth, as it were. (In fact, bottom-performing funds tend to remain there because of high expenses. Since these expenses persist, upward moves of these funds are impeded.) Indeed, as I will show, the distance traveled in the course of these descents and ascents tends to be directly proportional to the earlier distance above or below the market’s return. Reversion toward the market mean is the dominant factor in long-term mutual fund returns.
Let me clarify with an example using the past two full decades to perform this test: the 1970s (which provided uncharacteristically modest equity returns) and the 1980s (which returned the favor by providing unusually generous returns—a sort of RTM example in a different context; I’ll come to that later). In performing this analysis, I’ve used middle-of-the-road growth-and-income funds and growth mutual funds. These funds include the large, well-known funds that carry risks at about the same level as the Standard & Poor’s 500 Composite Stock Price Index.
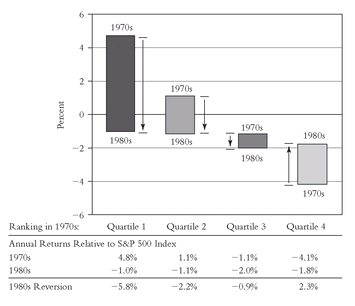
Figure 10.1 shows how the four quartiles of funds, ranked by fund performance relative to the S&P 500 Index in the 1970s, regressed toward the market mean during the 1980s. Note, for example, that the top quartile of funds provided annual returns averaging an imposing 4.8 percentage points above the index during the 1970s, but ended up 1.0 point below the norm during the 1980s, a downward reversion of 5.8 points compared to the index. By the same token, the bottom quartile fell 4.1 points behind the index during the 1970s but reduced that gap to 1.8 points behind the index during the 1980s, an upward reversion of 2.3 percentage points. (Note that in the second and third quartiles, there is much less change in returns, because these returns were close to the mean in the first decade.)
The consistency of this pattern was equally striking: 33 of the 34 funds in the top quartile reverted toward the market mean during the 1980s, with two-thirds of the formerly superior funds actually falling behind the S&P 500 Index. For what it’s worth, that one exception is a fund that provided a remarkable excess return of fully 11 percentage points per year during the 1980s. However, it has performed a classic RTM maneuver so far during the 1990s, providing an annual return precisely equal to the index, an equally remarkable 11-point annual mean reversion. Over the past four years alone, it has lagged the index by 5.6 percentage points annually. Sometimes, the manifestation of RTM requires patience!
Because it operates in a theoretical world, devoid of operating and transaction costs, the unmanaged S&P 500 Index is not only a tough target but an elusive one. (It has a strong bias toward stocks with very large market capitalizations.) Even though I have chosen the mutual fund categories dominated by large-cap funds with volatility characteristics similar to those of the index, the capitalizations of the stocks in their portfolios are somewhat smaller. Nonetheless, during the two decades—a time frame that obviously includes a considerable bias in favor of the funds by including only those that survived the period—the comparative differences were not large. During the first decade, these fund survivors actually outpaced the annual returns of the index by a slight 0.1 percent, a somewhat uncharacteristically favorable outcome, only to fall 1.5 percent behind during the second decade, a more normal result.
FIGURE 10.1 Fund Annual Returns Relative to Market Index
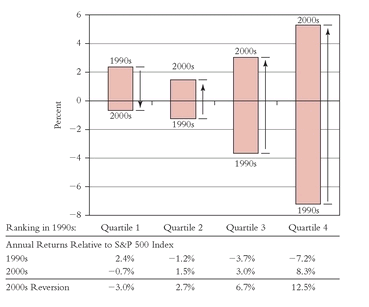
TEN YEARS LATER FIGURE 10.1 Fund Annual Returns Relative to Market Index
In any event, to put that issue to rest, I present in
Figure 10.2 a similar tabulation in which the same funds are
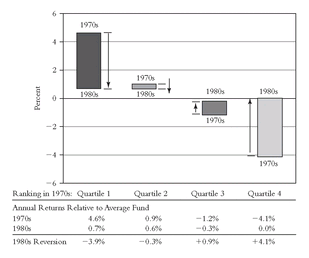
compared with one another. Figure 10.2 shows how, in each quartile, the mutual funds have regressed toward the mean of the fund group itself, rather than toward that of the market index. Again, RTM is the order of the day: The top-quartile funds lost 3.9 points of their former 4.7-point advantage. Fully 30 of the 34 top-quartile funds reverted. In the bottom quartile, 33 funds improved their relative records, and only one failed to do so. The bottom-quartile funds reverted upward by 4.1 points, recouping precisely what they had lost in the prior decade. RTM is sending a powerful message about the futility of evaluating funds based on their past returns. The patterns of
Figures 10.1 and
10.2 are virtually identical despite a change in the standard of reversion from the market average to the fund average. The RTM principle remains firmly intact.
To reinforce the point, we repeated the same test over the past 20 years. Comparing the decade 1987-1997 with 1977-1987, the top-quartile reversion to the market mean was a slightly larger 6.9 percentage points—from 5.1 percentage points ahead of the index to 1.8 percentage points behind the index—with all 44 funds reverting toward the mean, including fully 35 that fell below it. In the bottom quartile, with many of the returns retarded by excessive costs in both periods, 22 of the 44 funds improved their relative annual returns. The average return for these funds actually failed by a minuscule margin to revert (moving from 3.7 to 3.8 percentage points behind the index), a result brought about solely by the fact that two funds—notorious for their consistent and abject failure—turned in average annual returns 29 percentage points short of the market. (Absent those funds, the reversion took the bottom-quartile funds upward from 3.2 to 2.6 percentage points behind the index.)
FIGURE 10.2 Fund Annual Returns Relative to Average Equity Fund
TEN YEARS LATER FIGURE 10.2 Fund Annual Returns Relative to Average Equity Fund
We also repeated the test for 1977-1987 and 1987-1997 using the average return of the funds themselves rather than the average return of the market index as in the previous test. Here, with fund costs taken into account, the pattern is again remarkable symmetry. In the top quartile, 41 of the 44 funds reverted downward; in the bottom quartile, 40 of the 44 funds reverted upward. On average, the downward reversion for the top group was 4.3 percentage points; the upward reversion for the bottom group, again held back by high costs, was 3.2 percentage points. Clearly, the general rule of reversion to the mean in mutual fund returns, no matter which time period or which standard we use, is consistent, highly predictable, and, finally, universal.
Mutual fund marketers assume—usually correctly—that most investors are completely unaware that today’s top performers are overwhelmingly likely both to be tomorrow’s ordinary participants in the stock market and to parallel the average of their peers. In other words, today’s Beau Brummels are tomorrow’s Joe Six-Packs. Indeed, despite compelling evidence of that outcome, fund advertisers consistently hawk top performers. Fund organizations know full well that today’s idols have feet of clay. But as long as there are believers in witchcraft, the purveyors of witches’ brew will create and peddle elixirs and panaceas, engendering costly and counterproductive investment choices that inevitably come to grips with yesterday’s realities, not tomorrow’s.
No study exists that suggests the opposite conclusion: that the very few long-term winners that have emerged (usually, through highly superior returns in their early years, when they have very small assets and few shareholders) can be selected in advance. But perhaps there is a better way of reaping superior future performance than by sowing superior past performance. Let us turn to a second category of RTM, and a second reflection of Sir Isaac Newton’s revenge on Wall Street.
TEN YEARS LATER
Mutual Fund Champions?
Reversion to the mean (RTM) continued in the similar parallel pattern shown in the previous edition (updated
Figure 10.1). Just as the top-quartile equity funds in the 1970s lost substantial
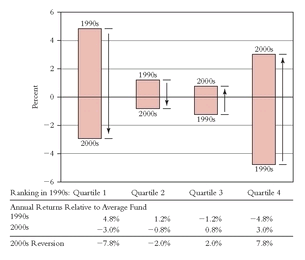
(Continued) ground to the S&P 500 in the 1980s and the bottom quartile gained ground, so the pattern repeated itself from the 1980s to the 1990s, and again from the 1990s to the decade ending in 2009. This latter comparison, however, does not present quite the same results as its predecessor, perhaps because the level of returns in the past decade was so low (in fact, about -1.5- percent). Nonetheless, the funds that clearly topped the S&P 500 by the largest margins during the 1990s fell behind into the 2000s, and those that fell furthest behind (-7.2 percent) shot up to a dramatic superiority (+8.3 percent) during the following decade. RTM to be sure, but perhaps an imperfect manifestation.
Figure 10.2, on the other hand, is indeed a perfect manifestation of RTM. When we compare equity funds with one another (rather than with the S&P 500), quartile by quartile—in truly incredible symmetry—the first shall be last and the last shall be first. The top funds moved from a 4.8 percentage point advantage to a 3.0 percentage point disadvantage, and the big losers moved from a 4.8 percent disadvantage to a 3.0 percent age point advantage. For the second quartile, the decline in relative return was
minus 2.0 percentage points; for the third quartile, the same 2.0 percentage point margin, but on the plus side. While such a pattern of symmetry is obviously unlikely to repeat, there can be little doubt that mutual fund champions come down to earth with remarkable consistency.
Gravity and Stock Market Sectors
Large-cap growth and value funds must provide short-term returns that roughly track those of the stock market before costs are deducted. But over the long run, because of costs, they must fall significantly short. Should investors seeking superior long-term returns concentrate on stocks in selected sectors of the stock market that may have characteristics that lead to outperformance? Alas, there seems to be no enduring systematic bias in favor of a particular market sector. RTM seems consistently to turn even what often appear to be long-term secular trends into mere cyclical phenomena, albeit often of considerable duration.
Let’s look at four examples: (1) growth stocks versus value stocks, (2) high-grade stocks versus low-priced stocks, (3) large-cap stocks versus small-cap stocks, and (4) U.S. stocks versus international stocks. The net result of all four examples (I tip my hand here) is that, in each of these key market sectors, RTM is alive and well.
Growth Stocks versus Value Stocks
We begin with growth stocks (generally, those with above-average earnings growth, price-earnings ratios, and market-book ratios) and value stocks (lower in each case, and offering above-average yields). For this study, I’ve examined 60 years of growth funds (mutual funds with stated growth objectives and a record of above-average volatility) and value funds (seeking both growth
and income, and demonstrating average to below-average volatility).
vIn recent years, the conventional wisdom has been to give the value philosophy accolades for superiority over the growth philosophy. Perhaps this belief predominates because so few observers have examined the full historical record. Nonetheless, over the long run, as shown in
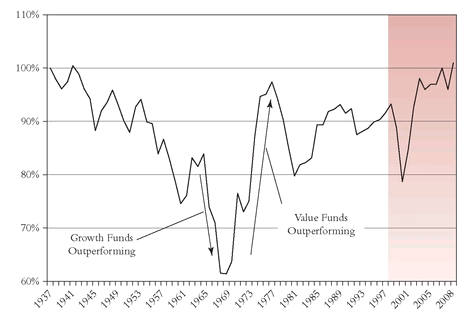
Figure 10.3, RTM proves powerful and profound. In the early years, growth funds controlled the game and were clearly the winners from 1937 through 1968. At the end of that long era, an investment in value stocks was worth just 62 percent of an equivalent initial investment in growth stocks. Value stocks then enjoyed a huge resurgence through 1976, redressing almost precisely the entire earlier deficit. (This recent history—covering only eight of the entire 60 years up to 1997—created the value stock mystique.) Then, growth stocks outperformed through 1980, and value stocks pretty much dominated through 1997. (As it happened—RTM at work again?—growth stocks returned with a fury to preeminence in 1998.)
FIGURE 10.3 Growth Funds versus Value Funds (1937-2008)
When all of these cyclical fluctuations for the full six decades were linked, the terminal investment in value stocks was equal to about nine-tenths of the investment in growth stocks. For the full 60-year period, the compound total returns were: growth, 11.7 percent; value, 11.5 percent—a tiny difference. I’d call that match a standoff—and another tribute to RTM.
High-Grade Stocks versus Low-Priced Stocks
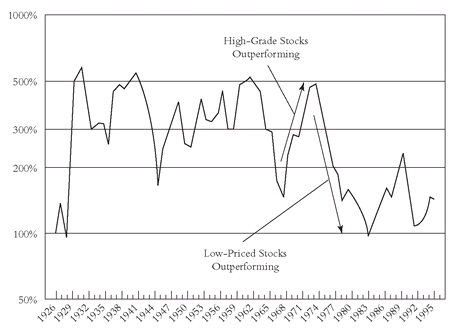
My second example of market-sector RTM is high-grade versus low-priced stocks. This series—not much considered by investors during the past decade—has been published by Standard & Poor’s Corporation on a consistent basis since 1926. As shown in
Figure 10.4, the swings in market preeminence have been much briefer than with growth and value stocks. The most sustained trends have been evident during the past four decades. Low-priced stocks enjoyed a six-year feast from 1962 through 1968. It was followed by a complete reversal in favor of high - grade stocks—a six-year famine that lasted through 1974.
FIGURE 10.4 High-Grade Stocks versus Low-Priced Stocks (1925-1995)
Continuing a cycle that seems vaguely to parallel the seven-year cycle of biblical prophesy, the next feast for low-priced stocks lasted for nine years, through 1983, and was followed by a seven-year famine through 1990, followed by a brief feast that appears to have ended in 1992. When all was said and done, for the full seven decades, each dollar initially invested in high-grade stocks was valued at about 1.4 times the investment in low-priced stocks—almost exactly where it was at the end of 1927, which was a truly great year for high-grade issues. Even including the distorting effect of that single opening year, high-grade stocks provided a historical return of 6.7 percent versus 6.2 percent for low-priced stocks (in both cases, excluding dividends). Nonetheless, the power of RTM is apparent in the chart.
Large-Cap Stocks versus Small-Cap Stocks
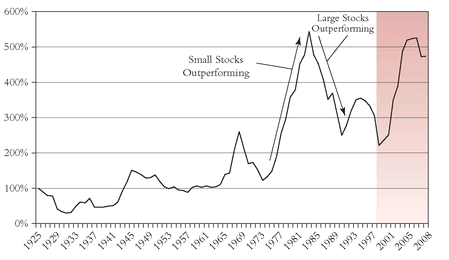
Now to my third sector. One of the seemingly indestructible myths of investing is that stocks with small market capitalizations outpace stocks with large market capitalizations over time. Having accepted this proposition, its proponents then explain why, in terms easily understood: “Small caps carry higher risks; therefore it follows, as the night the day, that they must earn higher returns.” This reasoning would seem to make consummate good sense. But, in fact, as shown in
Figure 10.5, the cycles of small-cap superiority have been relatively spasmodic. From 1925 through 1964—a period of fully 39 years—small caps and large caps provided identical returns. Then, in just four years, through 1968, the small-cap return more than doubled the large-cap return. Virtually that entire margin was lost during the next five years. By 1973, small caps were about at par with large caps for nearly the full half-century. The small caps’ reputation was made largely during the 1973-1983 decade. Then, perhaps inevitably, RTM struck again in a fifth cycle. Paralleling the observation of the poet Thomas Fuller in 1650, it was darkest for the large caps just before the dawn, for the sun has shone brightly upon them since 1983.
On balance, for the full period, the compound annual return on small-cap stocks was 12.7 percent, compared with 11.0 percent for large-cap stocks. This difference resulted in a terminal value for small - cap stocks that was three times that of large-cap stocks, as shown in
Figure 10.5. But, given the dominance of small caps in a single decade, I’m not sure I’d rely on it. (Certainly, the truly awesome strength of large caps, in a so-so 1998 for small caps, meant it was not wise to accept uncritically the small-cap thesis.) Without the relatively brief cycle of small-cap domination in 1973-1983—only one of seven decades in the period—large caps were actually
superior. When that period is excluded, annual returns were: large caps, 11.1 percent; small caps, 10.4 percent. In any event, the relationship between large caps and small caps, if not entirely dominated by RTM, is permeated with the force of market gravity.
FIGURE 10.5 Large-Cap Stocks versus Small-Cap Stocks (1925-2008)
U.S. Stocks versus International Stocks
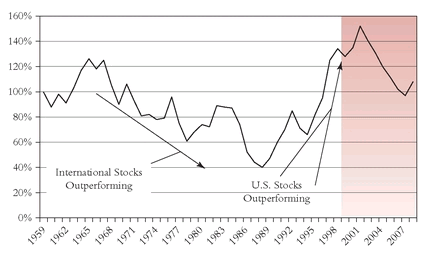
For U.S. stocks versus international stocks, no historical chronicle compares in length to those I’ve used for my first examples of RTM. I rely here on all the available data, covering only the past 38 years. As shown in
Figure 10.6, there is profound evidence for my thesis. Here, I’ll compare the returns of the S&P 500 Index and the Morgan Stanley Capital International Europe, Australasia, Far East (EAFE) Index, expressed in dollars rather than local currency terms to reflect the experience of U.S. investors. There were frequent swings to and fro, but the ratio of cumulative value slightly favored the EAFE Index for the first 24 years (through 1984). The compound returns were: EAFE, 9.7 percent; S&P, 8.4 percent.
FIGURE 10.6 U.S. Stocks versus International Stocks (1959-2009)
Then EAFE exploded, outpacing U.S. stocks by fully two times during the brief 1984-1988 cycle. During the subsequent nine years, U.S. stocks completely repaid the compliment, more than redressing that short flash of EAFE brilliance. For the full period, the compound returns on U.S. stocks and international stocks were identical: 11.5 percent. The relative value of each initial dollar invested by the investor who stayed in the United States was worth precisely the same as the dollar invested by the investor who traveled abroad. Over the long run, RTM has clearly manifested itself in global equity markets.
Back to Sir Isaac Newton
I’ve now illustrated the powerful force of the law of relative market gravity, although perhaps not with Sir Isaac Newton’s precision. His discovery of the law of universal gravitation has been described as the high point of the scientific revolution of the seventeenth century. To be sure, the utility value of mean reversion to investors in diversified equity funds and in stock market sectors will hardly be the high point of this fading century. Indeed, Newton’s third law: “Every action has an equal and opposite reaction,”
w is perhaps an even better translation of what happens in financial markets. But RTM, even though it may take decades to appear, is a principle borne out by history. Intelligent investors will ignore it at their peril. I ’m staking my own investment strategy on the fact that it will continue to exist.
Common Stocks Return to Earth, Too
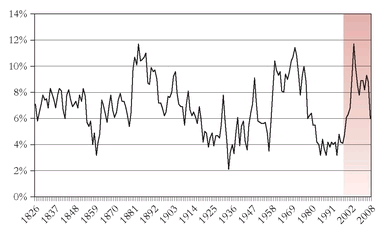
There is a third important area of mean reversion: the long-term returns of common stocks. Unlike stock mutual funds and stock market sectors, RTM relates here to absolute, not relative, returns. For more than two centuries, over rolling 25-year periods, the U.S. stock market has demonstrated a profound tendency to provide real (after-inflation) returns that surround a norm of about 6.7 percent. As shown in
Figure 10.7, the swings around this norm are reasonably narrow, and returns are much below 4 percent in only five periods.
TEN YEARS LATER
RTM in Stock Market Sectors
The RTM patterns illustrated in the previous edition—growth stocks versus value stocks, large-cap stocks versus small-cap stocks, and U.S. stocks versus international stocks—also continued during the past decade-plus. (Standard & Poor’s Corporation no longer provides indexes for high-grade stocks and low-priced stocks.)
Growth funds, which had slightly lagged value funds during 1979 to 1995, soared past value funds during the great bull market that ended in 2000 (
Figure 10.3). Then value quickly shot ahead during the next two years. The advantage changed hands often since then, but significantly, the average annual returns of the two categories during the 72-year period covered by
Figure 10.3 were actually
identical—9.7 percent for growth funds and 9.7 percent for value funds.
Large-cap stocks and small-cap stocks, too, continued their back-and-forth pattern (
Figure 10.5). Large did better during 1994 to 1998; then small shot ahead during 1999 to 2006, with large doing better since then. While the small-cap advantage over large-caps is substantial in terms of historical annual return (13 percent versus 10.7 percent), it is significant that large-cap stocks at least held their own over incredibly long periods; for example, from 1945 through 1973 (28 years), and from 1982 through 2008 (26 years). Maybe the long-term historical pattern will persist—who really knows?—but investors who hold small-cap stocks disproportionately larger than their market weight would be well-advised to have a full measure of patience.
The past decade has also reflected—in spades!—RTM between U.S. and international stocks. The domination by U.S. stocks continued through 2001, only to see a major reversal (in part due to
(Continued) the weakness of the U.S. dollar) through 2007. Then, in 2008, U.S. stocks held a slight advantage, followed by a slight disadvantage through mid-2009. Over the full half-century, the annual returns are virtually identical: U.S. 9.1 percent, international 9.0 percent. Investors who believe that they can time these reversions—so evident in
Figure 10.6—are playing a dangerous game.
In short, real returns have ranged between roughly 4 percent and 10 percent in 93 percent of the 25-year periods—a remarkable record of consistency. RTM is alive and well in the stock market. The standard deviation of annual returns in 25-year periods—about half of an investing lifetime for most investors today—is plus or minus 2.0 percent from the norm. In fairness, in a time frame of 10 years, the standard deviation is 4.4 percent; in an investment lifetime of 50 years, it is a minuscule 1.0 percent. Time horizon makes a meaningful difference.
The root cause of these consistent long-term returns is fundamental: corporate dividends and corporate earnings growth. And, using data we have available from 1871 forward, we can measure the extent to which these two financial fundamentals have dictated the returns earned on equities. The sum of real corporate earnings growth plus dividend yields since 1871, again averaged over rolling 25-year periods, produces a total fundamental return on stocks of 6.7 percent. This figure precisely matches the actual real stock market return of 6.7 percent, meaning that the role of speculation was neutral over time. This precise equality of the two returns during this 127-year period is a remarkable tribute to the long-run rationality of the financial markets.
FIGURE 10.7 Rolling 25-Year Real Stock Returns (1826-2008)
Lord Keynes Redux
In the shorter run, the irrationality in stock returns is created by the speculative element. Stock market irrationality can be measured by the ephemeral—but critical—factor represented by the stock market’s price-earnings ratio. If, following Lord Keynes, we use the term investment to describe the fundamental return based on earnings and dividends, we use the term speculation to describe this second determinant of stock prices: the price that investors will pay for each dollar of corporate earnings. If the power of fundamentals dominates market returns in the very long run, the power of speculation dominates market returns in the shorter run. Speculation is, ultimately, temporary and fickle. Over time, investors have been willing to pay an average of about $14 for each $1 of earnings. But if, in their optimism, they are willing to pay $21, stock prices will leap by 50 percent for that reason alone. If, in their pessimism, they are willing to pay only $7, stock prices will fall by 50 percent. The changing price of $1 of earnings creates powerful leverage indeed, but it doesn’t last forever, nor even for an investing lifetime.
Even over periods as long as a quarter century, however, there have been variations in returns based on the esoteric force of speculation rather than on the rock foundation of investment. But they have been reasonably subdued. The combination of dividend yields and earnings growth has remained the predominant driver of return.
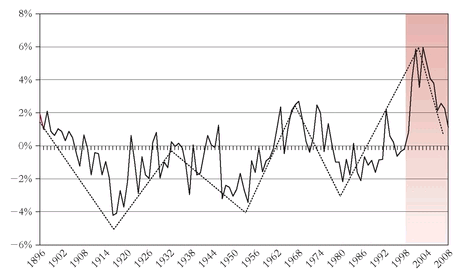
Figure 10.8 presents the differences between the two since 1871. (It was not until then that reliable figures on earnings and dividends began to be developed.) Actual returns fell within a range of plus or minus some two percentage points of fundamental returns in 88 of the 102 periods of 25 years since 1871. I am struck by the fact that there seem to be six waves—each with roughly 15 years ’ duration—from the peak-to-valley (and vice versa) role of speculation. Just for fun, I’ve delineated these six waves—arguably, three grand RTM cycles—in
Figure 10.8.
FIGURE 10.8 Actual Stock Market Real Returns versus Fundamental Returns, Rolling 25-Year Periods (1871-2008)
To illustrate how these differences between fundamental and actual returns have worked in the past, let’s compare the role of investment and speculation in two very different climates (
Table 10.1). In both examples, I rely on nominal, rather than real, stock market returns. When investors moved from pessimism to optimism, as in 1942 to 1967, a fine fundamental return of 12.8 percent was supplemented by a speculative return of 2.6 percent. This additional return represented the annual impact of the upward revaluation represented by a 95 percent increase in the price of $1 of earnings, from $9.50 to $18.10, bringing total return to 15.4 percent. On the other hand, when optimism turned into pessimism, as in 1958 to 1983, the reevaluation of $1 of earnings reduced the price of $1 of earnings by 40 percent, from $19.10 to $11.80. The annual impact of this reduction was -1.9 percent over the full 25-year period, taking the fundamental return from 9.7 percent to 7.8 percent. With $1 of earnings today selling for $27, I suppose it’s fair to say that our future expectations ought to be held in check.
| | Pessimism to Optimism 1942-1967 | Optimism to Pessimism 1958-1983 |
| 1. | Fundamental component | | |
| A. Dividend yield | 6.0% | 3.2% |
| B. Earnings growth | +6.8 | +6.5 |
| Total fundamental return | 12.8% | 9.7% |
| 2. | Speculative component | +2.6 | -1.9 |
| 3. | Total market return | 15.4% | 7.8% |
My purpose in again discussing the overpowering force of fundamental factors in driving stock returns is to reinforce the fact that the economics of capitalism and competition seem somehow to have established a historic limit of 4 percent real (6 percent nominal) returns on long-term earnings growth. What has captivated the U.S. stock market today—and what has helped to drive the stock market during these glorious recent years—is the notion that earnings growth has moved to a new, distinctly higher plateau. Indeed, during the past 15 years, real returns have averaged fully 12.6 percent—nearly double the long-term norm, and a return significantly exceeded in only nine of the 182 15-year periods since 1816, and even then not by very much. Even if the coming decade produces only a 3 percent real return, the quarter-century return would be 8.6 percent, still well above the long-term norm of 6.7 percent. But the remarkable returns earned on stocks since 1982 have raised important questions about whether the old shackles of fundamental returns have been ripped away, freeing the United States to enter a new era of corporate profitability. The central question of the day is: Are stocks reverting to a new, higher mean?
A New, Higher Mean?
In mid-1997, as the bull market roared to new heights, the respected firm of Morgan Stanley Dean Witter headlined its investment strategy bulletin, “A New, Higher Mean to Revert To?”
1 The bulletin began by saying, “As the fat returns from U.S. equities keep piling up, you have to wonder if in this brave new world, the historical returns of 6 percent to 7 percent real are obsolete, and have to be revised upward.” It then took the middle ground. “This golden age for equities won’t last forever . . . but the mean for equities is probably somewhat higher than in the past, and famine will follow feast as it always has.” The bulletin concluded that the new mean market return would be “7 percent to 8 percent real, but below the 10 percent today’s bulls talk about. The real returns of around 12 percent generated for a decade now are simply not sustainable. Over time, returns will have to gravitate back toward the new mean.”
If—if—a real return of 7 percent to 8 percent is in fact the new mean, as the strategy bulletin seemed to imply, stocks would then have been overvalued (i.e., overpriced relative to the fundamentals) by about 20 percent. In such an environment of revaluation, a protracted period with real stock returns in the 3 percent to 5 percent range would be expected. At that level, stocks would face serious competition from bonds. Bonds, now with nominal yields of about 5.25 percent, should provide real returns of about 3.5 percent to 4 percent on average over the coming decade, at considerably lower risk.
Given the hazardous nature of market forecasting, however, and the powerful odds against being right twice (selling at or near the highs, and buying back at or near the lows, a winning strategy of extraordinary unlikelihood), the possibility—even the probability—of inferior risk-adjusted returns on stocks should prompt, not aggressive investment actions, but thoughtful consideration about investment goals.
TEN YEARS LATER
Common Stocks Return to Earth
When we look at the returns in common stocks over rolling 25-year periods, RTM virtually leaps off the chart (
Figure 10.7). In the previous edition, the trailing 25-year real annual return was at 6.9 percent, close to the 6.7 percent long-term norm. As I mentioned in Chapter 2, it then shot up to an all-time high of 11.7 percent during the quarter century ended in 1999, only to revert to a return of 6 percent in the 25 years ended in mid - 2009. That kind of mean reversion is what stocks have done for nearly two centuries in the past, and it’s a good bet that they’ ll do the same in the next two centuries.
Over the very long run, stock returns are—and must be—driven by, well, business returns, what I called
fundamental returns in the previous edition (I now often use the term
investment returns): (1) the initial dividend yield of U.S. corporations, usually measured by the S&P 500 Index (or its predecessors), plus (2) the subsequent rate of earnings growth. As I showed in
Figure 10.8, when
stock market returns get far ahead of
fundamental returns (usually reflecting buoyant optimism), it is only a matter of time until the market return reverts to the fundamental return, and then overdoes it (usually reflecting profound pessimism), lagging well behind.
So it was that the clear signs of opportunity in the stock market during the late 1970s (fundamental returns one to two percentage points higher than market returns) were followed by the signs of warning during 1998-2003, when the 25-year market returns exceeded the fundamental returns by record high margins of nearly 6 percent per year (compared to previous historic highs of less than 3 percent). In the 1999 edition, I cited with approval Morgan Stanley Dean Witter’s conclusion, “This golden age for equities won ’t last forever . . . and famine will follow feast as it always has.” After two great decades of “feast,” as it turned out, “famine” proved to be a not-so- hyperbolic description of the negative returns on stocks in the decade that followed.
Investing to Cope with the Force of Gravity
The academic aspects of RTM—what the historical statistics tell us—suggest that mean reversion is alive and well. It has been manifested in almost every aspect of investing: in shaping relative returns for individual mutual funds; in shaping the relative performance of diverse stock market sectors; and in determining the absolute levels of long-term stock returns, albeit perhaps at a prospective level that may be somewhat higher than in the past. If, as an academic matter, you accept this thesis, what actions does it imply for the wholly pragmatic business of investing? How can this history help to ensure that you and your family will have an optimal opportunity to accumulate capital?
As we saw in Chapter 3, much comfort can be found in an appropriate asset allocation mix. Today’s financial markets seem to carry a higher-than-normal risk component, but I do not believe that investors should abandon equities. In a retirement plan, for example, I would suggest balancing the potential risks and returns by centering on a 70 percent equity/30 percent bond program. I ’d shade equities higher (up to 90/10) for those at the beginning of their accumulation programs, provided that they have a healthy appetite for returns, a strong stomach for risks, and an extended time (15 to 40 years) before retirement. For anyone who is making regular investments that are modest relative to the capital already salted away, and who has more conservative instincts and a shorter time horizon (1 to 15 years), I’d shade equities lower—perhaps all the way down to 35/65. No one knows what future returns the financial markets will provide. A balanced approach has been validated over centuries, not because it provided the highest returns (it clearly didn’t), but because it achieved solid long-term returns without excessive short-term risks—hardly an unacceptable outcome.
With the stage thus set, however roughly, for future market returns, what does RTM suggest about equity investment strategy? Since RTM prevails among all market sectors such as growth stocks and value stocks, large-cap stocks and small-cap stocks, and U.S. stocks and international stocks, most investors should own equity funds that represent a broad cross-section of the U.S. stock market, in which large-cap stocks are the predominant component. Investors who believe they can garner a performance edge by selecting (or even overweighting) funds with different investment styles and strategies should be aware of the risks involved in doing so. For those who believe that the clear lessons of history are pointing us in the wrong direction (always a risky bet), an equally risky bet remains: determining which of these countervailing segments will in fact prove to be superior in the years to come. If, for example, large-cap and small-cap stocks do not revert to the market mean over the next 10 to 20 years, an investor has to guess which of the two is more likely to provide superior returns. It is for this reason that I prefer, on both theoretical and practical grounds, index funds that track the total U.S. stock market. With their extraordinarily broad diversification, over a wide-ranging spectrum of large-, mid-, and small-cap stocks alike, these funds are the ultimate response to the power of RTM in the stock market.
A decision to own an all-stock market index fund also solves the problem of fund selection. Why fly in the face of historical evidence by trying to select individual mutual funds in the hope of picking a big winner? Given the power of mean reversion in the returns of individual mutual funds, an index fund provides the most reliable participation in the future returns of equities as a group. Surely it has proved its worth in the past. Notwithstanding my preference for the total market fund, a Standard & Poor’s 500 Index fund is by no means an unacceptable choice. This large-cap index fund carries a 75 percent weight in the U.S. stock market, and cannot diverge widely from the total market, even in short-term periods. RTM suggests that its long-run returns will closely parallel those of the total market. Given low costs, either index fund should provide investors with the best possible opportunity to earn returns approaching 100 percent of the market return.
The Crown Jewels
In this modern era of investing, the descriptive phrase “the crown jewels”—the family’s most valuable assets—has taken on new meaning. Investors aspire to something far more important than diamonds, rubies, and sapphires. They aspire to accumulate sufficient capital to reach their personal financial goals. A comfortable and independent retirement is a major goal for most investors. When the time for retirement comes to the breadwinner, the family’s most valuable asset—its crown jewel—will almost certainly be the capital value of the retirement plan. Tax - deferred plans are especially valuable jewels because tax deferral, combined with low-cost investing, is the most valuable weapon in the long-term investor’s arsenal. Limited only by the provisions of the Internal Revenue Code, you should put every penny you can spare into your individual retirement account (IRA) or your 401(k) or 403(b) thrift plan.
An investment program that carries the theoretical armor of RTM, the mathematical armor of regular investing, and the protective armor of a balanced strategy, combined with the powerful weaponry of compound interest, deferred taxes, and low cost, would be applauded by Sir Isaac Newton. Even as the proverbial apple drops to the ground, so too do high-performing mutual funds and surging sectors of the stock market. The returns achieved in the most productive eras of the stock market itself, given enough time, have dropped to normal levels. Newton’s law of gravity, applied to the manifold mean reversion of returns in the financial markets, should also help you to think through and develop an intelligent financial plan and to implement it with simplicity and common sense, the better to accumulate a retirement fund of generous proportions. Powerful evidence of reversion to the mean in the financial markets is found not only in academic studies, but in pragmatic experience. As you accumulate capital, be sure to use the concept to your benefit.
TEN YEARS LATER
Reversion to the Mean (RTM)
Everything that has happened during the past decade only con firms my earlier position that RTM in investing is everywhere—in equity mutual funds, in market sectors, across the globe, in real stock market returns, and in the relationship between fundamental business returns and the returns of the stock market itself. Ignore these clear lessons of history at your peril.
