Chapter 14
On Time
The Fourth Dimension—Magic or Tyranny?
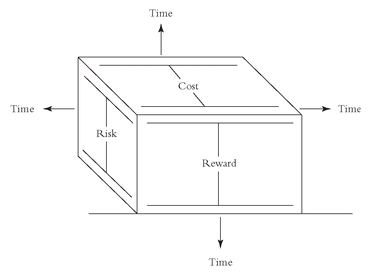
The language of geometry has proved a particularly fertile source of imagery and metaphor in my efforts to describe the elements of intelligent long-term investing. In the past, I have used the triangle to describe the eternal interplay of reward, risk, and cost in shaping investment returns, but a triangle exists only as a flat, two-dimensional surface. An elongated cube, which has the three spatial dimensions of length, breadth, and depth, is a more useful geometrical figure for those three key elements of investing. It better represents the complicated and simultaneous interplay among the dynamic vectors of return. But, as Albert Einstein pointed out, we live in a universe that is not only spatial, but temporal. He identified time as the fourth dimension, and so it is in the world of investing, too.
In other words, investment return has four dimensions. Three are the spatial dimensions: length (which I’ll describe as reward), breadth (risk), and depth (cost). But there is also a temporal dimension: time.
Figure 14.1 shows how the four dimensions interact. Never make an investment without having a clear idea of the impact each dimension will have, and never develop a financial program that doesn’t meet the same standard.
I’ll first review my earlier comments on the dimensions of reward, risk, and cost, and then turn to the time dimension. These four dimensions are interlinked in tantalizing ways—sometimes obvious, sometimes subtle. The intelligent investor cannot afford to ignore any of them. The challenge is to weigh each of them properly in the light of the investment goals to be achieved. Doing so with common sense and discipline is the key to the development of a sound investment program.
Reward—The First Dimension
In
Figure 14.1, I used “length” to describe reward, simply because it is the longer of the two straight-line dimensions of a surface. Reward must be given primacy as a factor in the process of wealth accumulation. Looking back at the past 15-plus years, during which mutual funds have become, overwhelmingly, the investment of choice for America’s families, reward almost seems taken for granted. During that period, the total stock market has garnered an astonishing annualized return of 17.2 percent. As a result, an investor who placed $10,000 into the stock market at the end of 1982 would now have an investment worth $117,000 if costs and taxes were ignored. (Would that they could be!) During this era of abundance for so many investors, building a portfolio of assets has seemed easy.
Financial markets have, however, demonstrated a truly remarkable tendency to revert to the mean over time. It would be unwise to lose sight of the fact that the 12.6 percent real (inflation-adjusted) return of the past 15 years—almost double the long-term norm of some 7 percent—has been exceeded in but nine of the 181 periods of similar duration since 1802. It hardly seems probable that such a return will soon be repeated; the investment fundamentals are clearly less compelling today than in mid- 1982, when the bull rampage began, and when stocks were priced at a multiple of 7.9 times earnings. In late 1998, at 27 times earnings, they are more than three times as richly valued. In 1982, $1 of dividends could be purchased for an initial investment of $16 (a yield of 6 percent). Today, $1 of dividends costs $71 (a yield of 1.4 percent), almost four times as richly valued. (While it is said that dividends don’t matter anymore, I remain unconvinced.) Surely, if $71 for $1 of dividends is not too high a price, there must be some price that is too high to pay.
TEN YEARS LATER
Dividend Rewards and Yields
My blunt conviction that dividends—virtually ignored during the frothy bull market of the late 1990s—still mattered was right on the mark. For a few short years, paying $70 for each $1 of dividends didn’t seem excessive; indeed, the price rose to a stupefying $99 in early 2000. But as it always does, reality took over. By mid-2009, the price of each $1 of dividends had tumbled to $38—the result of the steep decline in stock prices, accompanied by substantially higher dividends, even taking into account the sharp 23 percent drop in the dividend rate estimated for 2009.
Risk—The Second Dimension
As you survey the inevitably uncertain prospects for reward in the near term, which are perhaps greater at this level of the stock market than during the entire investment lifetimes of most investors today, you must necessarily consider risk, the second dimension of investment return. In investment terms, risk is to reward what breadth is to length in spatial terms: the lesser of the two sides of the plane. That is not to say that risk is unimportant. It is crucial. But I simply do not accept its being counted equally with reward. Indeed, as I noted in Chapter 1, faith in the future, an essential element in investing, entails the implicit assumption that return will exceed risk. If the potential return does not exceed the potential risk, why invest at all? But risk is one of the hallmarks of equity investing, and fear of loss is often the investor’s greatest concern. Conventionally, risk is measured with precision, albeit imperfectly, in terms of standard deviation, although that is a backward-looking measure that is more accurately a measure of price volatility than of risk. (The two are not exactly the same!)
In weighing the first and second dimensions of return, an investor relies on measures of risk-adjusted return, of which the consummate measure is the Sharpe ratio, essentially the relationship between the return of a portfolio and its volatility. As I noted in Chapter 6, however, counting one unit of risk as the equivalent of one unit of return seems simplistic, for at the margin it hardly seems rational to weight a meaningless difference of one percentage point of volatility equally with a priceless difference of one percentage point in long-term reward. Nonetheless, some investors have trained an almost singular focus on risk-adjusted return. In an effort to reduce portfolio volatility, institutional investors, and many individual investors as well, have increasingly diversified beyond the liquid financial markets of the United States. They have moved into international stock and bond markets, and have sampled a variety of nontraditional alternative assets: hedge funds and relatively illiquid assets such as venture capital, private capital of more seasoned enterprises without public markets, and hard assets such as real estate and energy. (Gold, once considered the consummate contracyclical holding, has lost its luster, presumably because of nearly two decades of languishing returns.)
Since they moved into the mainstream of institutional investing, these types of investments have rarely distinguished themselves, but the strategy may yet succeed. If the relative returns of international equities, after lagging for a decade, were merely to revert to their long - term means, they might well enhance the results of an equity portfolio. And it is probably reasonable to assume that, in the long run, illiquid investments such as venture capital and private equity should carry premiums over freely marketable issues, suggesting that a significant commitment in these areas could also enhance returns for investors to whom liquidity is not a major concern.
ab A pallid past, then, may well be the precursor of a favorable future, in which both reduced volatility and enhanced returns are achieved by the use of nontraditional asset classes.
This sequence of events, however, is merely conjecture. But make no mistake: Each of these alternative asset classes carries its own out-sized special risks, risks that investors are not required to assume. Besides, the individual securities in each class often carry extraordinarily high risk—inherently, a far greater risk than owning large, highly marketable, liquid U.S. stocks. Investors should carefully consider the implications of a decision to invest in alternative assets—holding investments that individually carry higher risks, with the goal of reducing the risk of the equity portfolio as a whole—and be fully aware of the paradox that decision entails.
Cost—The Third Dimension
The first two elements, reward and risk, are well-accepted dimensions of investment return—indeed, usually to the complete exclusion of the third dimension. For example, how often do we read “risk/reward ratio” rather than “risk/reward/cost ratio”? Yet the impact of cost both on reward and on risk cannot possibly be overstated.
Cost matters. It matters in every far-flung corner of the world of investing, but it matters most where it is the highest. Throughout this book, I have catalogued the exceptionally high costs that characterize much of the mutual fund industry, and their impact on net fund returns that are astonishingly sensitive to cost. Add up the operating expense ratio of the average equity mutual fund (1.5 percent), plus the minimum estimated average portfolio transaction costs (0.5 percent), and the total cost of a no-load fund is at least 2 percent per year. If the fund charges a traditional front-end sales load (as most funds do), the minimum initial commission, amortized over a 10-year holding period, would come to 0.5 percent per year, bringing the total annual cost to 2.5 percent. For the one-fourth of all funds with the highest fees, the total cost would come to 2.5 percent per year (or 3.0 percent if high-cost load funds were used).
As I noted at the close of Chapter 3, even a 2.2 percent annual cost could consume 22 percent of a normal market return of perhaps 10 percent annually in nominal terms, and fully 30 percent of return if 2.5 percent inflation reduced it to a real return of 7.5 percent. Compounded over 10 years, this cost would consume 30 percent of the aggregate nominal return, and fully 36 percent of the aggregate real return. Looked at another way, a 2.2 percent cost would confiscate an astonishing 63 percent of the normal equity risk premium of 3.5 percent. Fund expenses are hungry ogres, not easily sated.
Not even included in these calculations is the appetite for consuming returns manifested by taxes, the equally famished cousins of the expense ogres. And as I noted in Chapter 13, mutual fund portfolios are typically managed with utter disregard for tax considerations. Fund managers not only fail to defer gain realization to the latest possible moment, but they also realize huge portions of gains long before they become eligible (after one year) for the 20 percent maximum rate on long-term gains. Perhaps one-third of all fund gains are realized in holding periods of less than one year and taxed at up to the maximum 40 percent rate applicable to ordinary income.
Long-Term Investing—The Canny Scots
While bona fide long-term investing seems almost entirely absent from the U.S. mutual fund scene, there are exceptions around the globe. A recent article in the
Wall Street Journal reported that money managers in Scotland are following a path untrodden by most U.S. fund managers. At Walter Scott and Partners in Edinburgh, the firm focuses on a concentrated portfolio, which “holds a maximum of 50 stocks, and changes no more than six names annually—turnover of less than 15 percent. The firm’s managers ignore stock-market benchmarks, and shrug off market turmoil.” A spokesman notes, “Stock markets may go up and down a wee bit, but our goal is to have shares in companies that can grow their cash. At the end of the day, you’re investing in a business you expect to grow. And compound growth is the most valuable tool of any investment manager.”
1During the recent years of soaring markets, taxes on capital gains realized and distributed by mutual funds may well have penalized investment fund returns for taxable shareholders by another 2.2 percentage points each year, doubling the impact of the 2.2 percent annual cost penalty. During the 1995-1998 period alone, furthermore, the average equity fund actually lagged the total stock market by an annual rate of five percentage points, even before taxes were deducted, so taxes would have taken that shortfall to more than seven percentage points. Wise fund investors will ignore the third dimension of return, cost—specifically, fund investment expenses and taxes—at their peril.
Time—The Fourth Dimension
With this review of the three spatial dimensions of return—length, breadth, and depth, as illustrated by return, risk, and cost—we move to the fourth dimension: time. Albert Einstein’s General Theory of Relativity is generally credited with developing the concept of time as the fourth dimension of the universe, and time is an equally useful concept in the world of investment returns.
In the investment world, the importance of time in shaping returns has been honored more in the breach than in the observance—more in theory than in practice. We speak of the value of long-term investing, and we say kind words about long-term investors. But when asked to list them, it is hard to name two. Who comes to mind after Warren Buffett?
In the mutual fund industry, as noted at the outset of this book, we clearly invest for the short term; fully one-third of equity fund portfolios have turnover of more than 100 percent each year. If our marketing policies and fund supermarkets are any indication, we seek short-term investors, too. And we get them: Shareholders are turning over their own equity funds at an average annual rate of more than 30 percent. These numbers reflect incredible mobility; in both cases, they reflect foolish short-run strategies. In the search for investment return, I have no doubt that they are counterproductive. Looking across large classes of shareholders, I sometimes suspect that wealthy private investors may be the only significant group that prizes a long-term strategy and practices low portfolio turnover. And I am hardly above suggesting that the reliance on such a strategy may be precisely why these families are wealthy in the first place. Experience need not be painful to teach a powerful lesson. And fund investors and managers alike should learn from that experience.
Among all strategies, market index strategies have the longest time horizons. An all-market index changes only at the glacial pace of the entire market. Initial offerings of stocks are small in relative weight, and when firms vanish by merger or bankruptcy, no portfolio transactions ensue. The annual portfolio turnover of an all-market index fund rarely exceeds 2 to 3 percent, essentially an average holding period of 33 to 50 years. That long horizon is surely a significant factor in the formidable relative pretax returns that index funds have provided, as well as in their almost unparalleled superiority in providing after-tax returns.
Time and Reward—The Magic of Compounding
Given Einstein’s role in bringing time to the fore as the fourth dimension of our universe, it is hardly surprising that he is often quoted (perhaps apocryphally) as having described compound interest as “the greatest mathematical discovery of all time.” Indeed, the powerful link between time and reward is often described as the “magic of compounding.” The longer the time horizon, the greater the power of compounding investment returns in transforming an initial outright investment, or a series of modest annual investments, into a truly breathtaking terminal value.
Let’s begin with two basic cases of the magic of compounding.
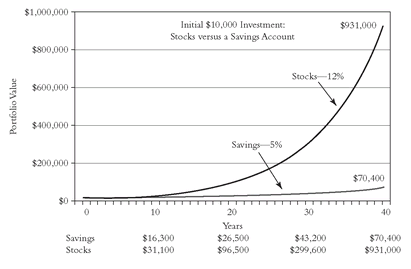
Figure 14.2 shows the results of a single initial investment over time. This is a typical mutual fund industry format for comparing the result of an initial investment of $10,000 in stocks, held for a working lifetime of 40 years, earning a high return of 12 percent annually, with a fixed - income alternative that is earning the much lower annual return of 5 percent. The 12 percent return approximates the rate of total return on the stock market over the past 40 years; the 5 percent return approximates the recent yield of U.S. Treasury bills.
The investment in stocks builds its reward over savings year after year.
Figure 14.2 shows how this edge in reward grows over the decades. The returns on stocks produce a final reward of $931,000; the returns on savings produce a final reward of $70,400.
Magic is hardly too strong a word for this awesome differential.
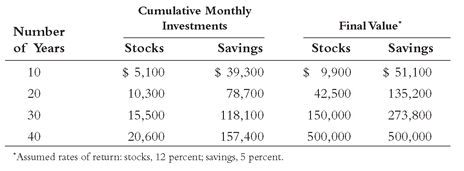
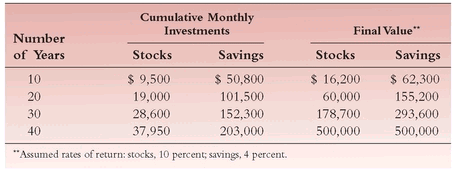
Table 14.1 shows a second example of compounding for an investor whose goal is to invest regularly and accumulate $500,000 of assets. The hypothetical investor is 25 years old and expects to retire at age 65. After making the necessary calculations (using the same return assumptions), the choice comes down to (1) investing $43 per month in stocks for 40 years or (2) investing $328 per month in savings for the same 40 years.
Here we see precisely the same compounding, but it is working in a different fashion. The same capital accumulation (consistent with the investor’s objective) occurs in each case, but infinitely smaller investments are required to reach the goal if stocks are chosen over savings (assuming both that the past returns are achieved and that the investments are in a tax-deferred account). The cumulative $43 monthly investment in stocks ($516 per year) totals $20,600 over 40 years; the cumulative $328 monthly investments in savings came to $3,936 per year, a total of $157,400 by the end of the period. The stock investment required only one-eighth the investment to reach the requisite $500,000 total. Magic is at work again.
FIGURE 14.2 The First Dimension: Reward and the Magic of Compounding
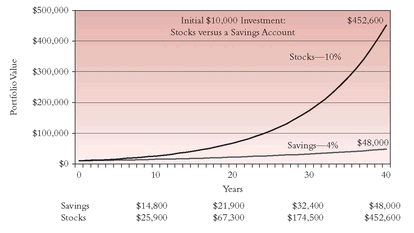
TEN YEARS LATER FIGURE 14.2 The First Dimension: Reward and the Magic of Compounding
The magic of compounding becomes even more apparent if we examine the results for three investors who delay beginning their programs. Instead of beginning to invest at age 25, one waits for 10 years, the second waits for 20 years, and the third waits for 30 years. It’s not easy to acquire the habit of thrift, especially when spending is so much more fun than saving. Fun, yes. But expensive fun. Whether they invest or save, the cost of delay for investors ascends steeply with the passage of time.
TABLE 14.1 Monthly Investing to Build $500,000 in Assets—$43/Month in Stocks versus $328/Month in Savings
TEN YEARS LATER TABLE 14.1 Monthly Investing to Build $500,000 in Assets—$79/Month in Stocks versus $423/Month in Savings
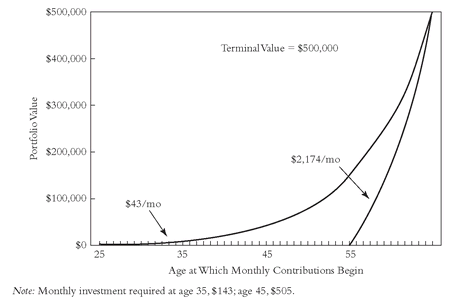
Using the stock account only, and again assuming a return of 12 percent over the past 40 years, the cost of delay is shown in
Figure 14.3. The difference between putting away $43 a month ($516 a year) if you begin early, but a staggering $2,174 a month ($26,088 a year) if you let 30 years elapse is astonishing. As shown in
Figure 14.3, the fairly gradual slope that early investors must climb becomes, for investors who wait too long, an Everest-like peak that defies even the most resourceful mountaineers. (A delay of 10 years more than triples the monthly outlay, to $143; a delay of 20 years multiplies the monthly outlay 12-fold, to $505.)
The Rule of 72
The Rule of 72 provides a wonderful illustration of the magic of compounding. To quickly approximate how many years are required to double the value of an investment, simply divide the rate of return into 72: a 4 percent return takes about 18 years; 6 percent, 12 years; 10 percent, 7 plus years; and so on.
The following table shows how quickly money grows over various time periods at various rates. Note how the reward of higher return increases over time. At 4 percent, it takes 72 years—a very long time horizon—for the original investment to multiply 16-fold. But at 12 percent, it takes 24 years, only one-third the time, to grow 16-fold. After some 30 years, the investment compounding at 12 percent annually multiplies 32 times over, a multiple that the 4 percent rate would not reach until 90 years had elapsed. More magic.
The Rule of 72 also works in another useful way for investors putting money away today so that they can receive income tomorrow. For any given rate of return, the Rule of 72 shows how many years you must regularly invest a given sum before you can stop investing and then start withdrawing the same amount without depleting your capital.
For example, if you invest $500 per month at a 6 percent rate of return, after 12 years (72 divided by 6) you could regularly withdraw $500 per month and still leave your principal untouched. After 24 years, you could begin to make withdrawals of $1,500 per month. After 36 years, you could withdraw $3,500 per month, and still preserve principal. But if your rate of return were 12 percent, your waiting time would be shorter: six years to begin $500 monthly withdrawals, 12 years for $1,500, and 18 years for $3,500. After 24 years, you could withdraw $7,500 per month without impairing your principal—fully five times the amount possible at the 6 percent rate of return.
Caution: The table may suggest that the stock market works off some sort of actuarial table. It does not, under any circumstances. If future stock returns are lower than 12 percent—hardly an inconceivable outcome—future retirement income would be reduced. For example, a monthly investment of $500 made at 12 percent would permit $7,500 withdrawals after 24 years without depleting capital. But if the return were 8 percent, the permissible monthly withdrawal after 24 years would be only $2,670. So be cautious about projecting past returns into the future, and be conservative in the returns you assume.
Using the Rule of 72
TEN YEARS LATER
Time—The Fourth Dimension
During 1998 and 1999, when I was writing the first edition of this book, I was looking back over two consecutive decades (the 1980s and the 1990s) in which the annual returns on stocks had averaged almost 18 percent (equal to a two-decade compound return of +2,500 percent!). Of course, it was absurd to expect such returns to continue on into infinity—businesses just can’t grow that fast!—but I erred by showing even a 12 percent annual return as the high end of my range of possible investment returns with 4 percent assumed at the low end.
In this revised edition, I’ve recalculated both
Figure 14.2 (“Reward and the Magic of Compounding”) and also the data in
Table 14.1 on “Monthly Investing to Build $500,000 in Assets,” using a more realistic—if still optimistic—potential maximum return on stocks of 10 percent rather than 12 percent. I’ve also reduced the assumed return on savings (which I define as fixed-income investments) from 5 percent to 4 percent, roughly what is available on a portfolio of investment-grade short- and intermediate-term bonds in mid-2009.
In the previous chart and table the cumulative return gap between an initial investment of $10,000 in savings ($70,400) and stocks ($931,000) over 40 years was $860,600. While both recalculated figures ($48,000 and $452,600, respectively) are far lower than their predecessors, the gap remains huge: $404,600. And of course the monthly investments necessary to reach a $500,000 target in accumulated assets have also risen, from $43 to $79 per month for stocks, and from $328 to $423 for savings. But the message—time is your friend—remains.
Time and Risk—The Moderation of Compounding
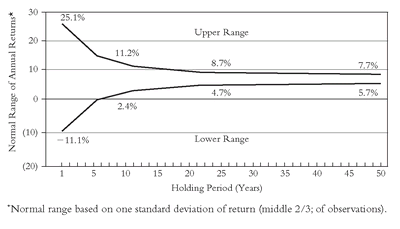
Almost as striking as the interplay between time and reward is the relationship between time and risk, particularly in the stock market. As your time horizon increases, the variability of stock market returns declines. As the years roll on, compounding moderates market risk. Furthermore, the risk of earning the stock market’s long-term return declines quite steeply during surprisingly short spans. For example, merely extending your time horizon from one year to five years telescopes the absolute range of stock returns from +67 percent to -40 percent all the way down to a range of 27 percent to -11 percent. By the same token, the normal level of risk extremes (measured conventionally by one standard deviation), falls precipitously, from a high of 25.1 percent and a low of -11.1 percent in one year to a high of 14.4 percent and a low of -0.6 percent over five years. Extending the period to 10 years reduces the range of annual returns from a high of 11.2 percent to a low of 2.4 percent.
In the risky business of investing in stocks, most of the risk reduction is accomplished in a decade. Add five years, and the range of returns is reduced to a high of 10.3 percent and a low of 3.4 percent over 15 years. Add another full decade, and the range is only slightly different—high 8.7 percent, low 4.7 percent—a minuscule reduction after 25 years. Doubling the period to a full half-century scarcely reduces risk any further. The annual range of annualized returns on stocks dwindles to a high of 7.7 percent to a low of 5.7 percent.
Figure 14.4, showing how risk diminishes with the passage of time, is based on the data in
Figure 1.3 in Chapter 1, now cast as a sort of half-mountain and its mirror image.
Descending the slope of risk is far easier than ascending the slope of reward. Of the maximum decline in risk over an investing lifetime, fully six-tenths has been accomplished by holding stocks for five years, eight-tenths by holding them for 10 years, and nine-tenths by holding them for 15 years. But, lest we forget, risk, while reduced over 15 years, is hardly eliminated. While the normal ranges, as shown in
Figure 14.4, are fairly narrow, the extremes are wide. During the best 15-year period, the annualized return was 14.2 percent; during the worst, a loss of -1.4 percent annually. No actuarial table here! The investor’s time horizon itself makes investment risk an elusive concept, one inevitably interlinked with investment reward. The fourth dimension significantly shapes our perception, not only of the first dimension of investment return, but of the second dimension.
FIGURE 14.4 The Second Dimension: Risk and the Moderation of Compounding (1999)
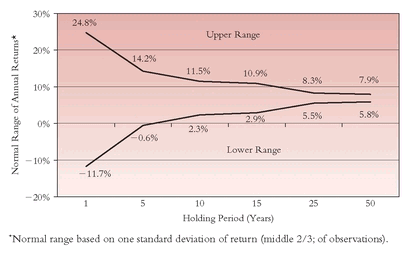
TEN YEARS LATER FIGURE 14.4 The Second Dimension: Risk and the Moderation of Compounding (2009)
Time and Cost—The Tyranny of Compounding
My earlier discussion of the interaction of time and reward included
Figure 14.2, showing the typical fund industry representation of the virtues of investing in equities versus putting savings in a fixed-income account. But fund investors do not earn the full market return. As a group, they cannot possibly do so, because fund investors incur costs, and costs are subtracted directly from the
gross returns funds earn. Only the net returns are passed along to fund shareholders.
TEN YEARS LATER
The Moderation of Compounding
As you might imagine, the updated
Figure 14.4 is virtually unchanged from its predecessor. The recent period did little to alter the return patterns of the past 200-plus years, and the point is identical: As time marches on, the variability of the average historical rates of return converge dramatically.
But please don’t make the error of equating that narrower range of returns with lower long-term risk. As I explain in the next section, even seemingly small differences in annual returns can result in sizeable differences in long-term wealth accumulation.
For example, annual contributions of $1,000 over 25 years, growing at 8.3 percent per year, would be worth nearly $83,000 at the end of the period. Reduce the annual return to 5.5 per cent, and the final value would be $54,000, a considerable spread that belies the seemingly small difference in annual returns. But even returns at the lower end of the historical spectrum can provide impressive growth over the long-term. Given that we have no control over the market’s future returns, the intelligent investor will seek to minimize costs, thereby maximizing their share of whatever long-term returns the market bestows on us.
The mutual fund industry almost
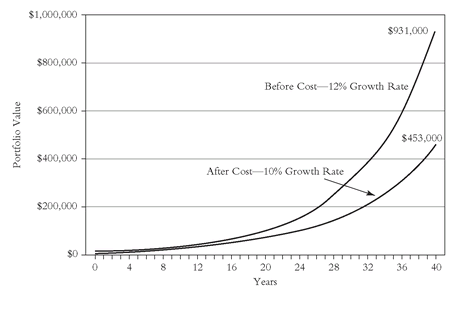
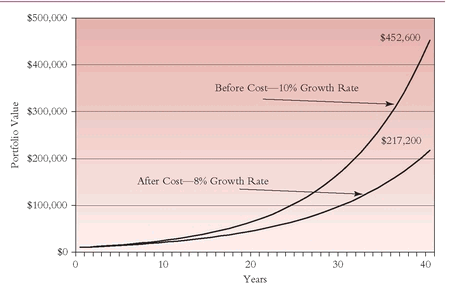
never shows the relationship between time and cost. If shown, the chart would be a rather disturbing one. It would present the same time period, the same stock market return of 12 percent, and the same $931,000 end result. But a second line would show the results assumed for a 10 percent mutual fund return: the market return reduced by estimated all-in annual equity fund expenses of 2 percent. At 10 percent, the line still grows, nicely sweeping upward as the years pass, but to a 40-year total of only $453,000—
less than half of the value generated by the stock market’s return. Over the full 40-year period, costs have confiscated fully $478,000. Put another way, more than half the market ’s return has been consumed by the industry’s costs.
Figure 14.5 depicts precost and postcost returns.
This evidence, brutal but factual, reflects the tyranny of compounding.
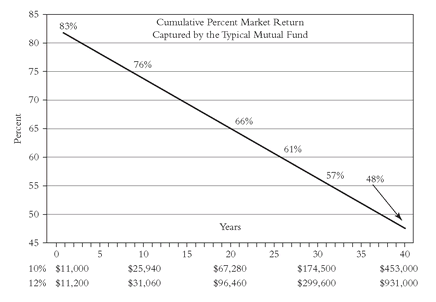
ac Figure 14.6 compares the extra capital (over and above the initial investment) earned with a gross return of 12 percent with the capital earned with a net return (after-cost) of 10 percent. In the first year, a gross return of 12 percent increases a $10,000 investment by $1,200, but the investment with a net return of 10 percent grows by $1,000, or 83 percent of the $1,200 provided by the market. After 10 years, the value of the costly investment has fallen to 76 percent of the market, and after 25 years to 61 percent. After 40 years, the capital earned in the fund is worth just 48 percent of the capital that would have been accumulated in the market.
TEN YEARS LATER
The Tyranny of Compounding
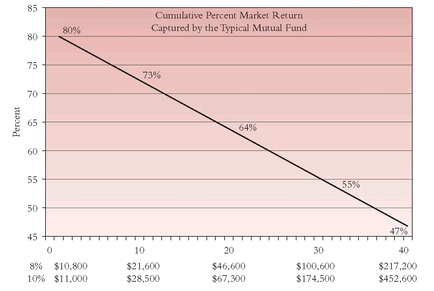
As in the earlier note, I’ve reduced the assumed rate of return on stocks from 12 percent to 10 percent, and left the assumed cost of mutual funds at 2 percent per year. (The actual level is almost certainly higher.) The new
Figures 14.5 and
14.6 reflect precisely the same
pattern, albeit with a more modest gap than in the earlier version. Against my better judgment, I’ve used assumed net (time-weighted)
fund returns of 8 percent, rather than the doubtless lower (dollar-weighted) returns likely to be earned by fund
investors.FIGURE 14.5 The Interaction of Time and Cost: Growth of $10,000 over 40 Years
TEN YEARS LATER FIGURE 14.5 The Interaction of Time and Cost: Growth of $10,000 over 40 Years
FIGURE 14.6 The Third Dimension: Cost and the Tyranny of Compounding
TEN YEARS LATER FIGURE 14.6 The Third Dimension: Cost and the Tyranny of Compounding
Cost matters. I use the phrase once again. Small differences in compound interest lead to increasing, and finally staggering, differences in capital accumulation. This phrase, however, illustrates not only the magic of compounding, but the tyranny of compounding. A higher-cost investment loses ever more ground to a lower-cost investment as the years roll on, leading to sharply lower capital accumulation. Like time and reward and time and risk, the dimensions of time and cost are also interlinked.
The other major cost of investing—taxes—also leads to sharply descending relative returns over time, so the tyranny of compounding gains further momentum. Based on the analysis presented in Chapter 13, which assumed a market return of 12 percent and an after-cost, after-tax mutual fund return of 8 percent, we can conclude that the combined appetites of the expense and tax ogres resulted in a truly staggering shortfall over just 25 years. The final capital value would have been only 37 percent of what the precost, pretax market return would have suggested. If, using the same net rates of return, the time line were extended to 40 years, the final values would have been $931,000 and $217,200. Only 23 percent of the projected capital would have been accumulated. The tyrannical impact of fund expenses combined with taxes paid on fund dividends and capital gains distributions, if almost completely ignored by the mutual fund industry, can no longer be ignored by fund investors. The sheer weight of evidence that cost matters is simply too compelling.
The Dimensional Imperative
When navigating the financial markets, the long-term investor must keep in mind the four basic dimensions of long-term return—reward, risk, cost, and time—and must apply them to every asset class. Never forget that these four dimensions are remarkably interdependent.
Reward and risk go hand in hand. The conventional wisdom of finance teaches that if one is to increase (or decrease), so must the other. Cost has a significant impact on both reward and risk. Lower costs make it possible to earn a higher return without assuming extra risk, or to hold reward constant and reduce risk. And because the passage of years multiplies the aggregate reward, moderates the volatility risk, and magnifies the burden of cost, time interacts with each of the three spatial dimensions of investing.
If your basic objectives are long-term in nature, awareness of this interdependence will give you a strong advantage in planning the voyage of the flagship represented by your own investment accounts. During the long voyage that you take to reach your goal of accumulating capital, the financial markets will inevitably experience crosscurrents, tidal shifts, high winds, rough seas, and rugged storms. Today’s bright skies, sprightly breezes, and calm waters won’t last forever. But those of you who are looking to far horizons, who are able to accept a bit more short-term risk in the pursuit of enhanced long-term returns, who are conscious of the destructive power of cost, and who are able to use time to its highest advantage will win the battle for investment survival, if only you have
TEN YEARS LATER
The Dimensional Imperative
The message of this chapter is precisely the same as in the previous edition. Time intersects with rewards, with risks, and with costs. And, yes, with the passage of time the magic of compounding returns is inevitably overwhelmed by the tyranny of compounding costs. (Do the math!) This message, in fact, is eternal.
