Chapter Two
Rational Exuberance
Business Reality Trumps Market Expectations.
THAT WONDERFUL PARABLE ABOUT the Gotrocks family in Chapter 1 brings home the central reality of investing: “The most that owners in the aggregate can earn between now and Judgment Day is what their business in the aggregate earns,” in the words of Warren Buffett. Illustrating the point with Berkshire Hathaway, the publicly owned investment company he has run for 40 years, Buffett says, “When the stock temporarily overperforms or underperforms the business, a limited number of shareholders—either sellers or buyers—receive out-sized benefits at the expense of those they trade with. [But] over time, the aggregate gains made by Berkshire shareholders must of necessity match the business gains of the company.”
“Over time, the aggregate gains made by shareholders must of necessity match the business gains of the company.”
How often investors lose sight of that eternal principle! Yet the record is clear. History, if only we would take the trouble to look at it, reveals the remarkable, if essential, linkage between the cumulative long-term returns earned by business—the annual dividend yield plus the annual rate of earnings growth—and the cumulative returns earned by the U.S. stock market. Think about that certainty for a moment. Can you see that it is simple common sense?
Need proof? Just look at the record since the twentieth century began (
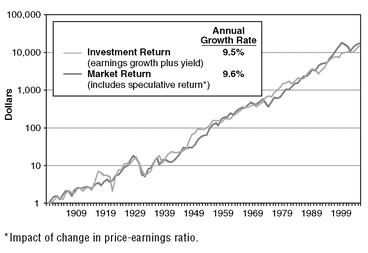
Exhibit 2.1). The average annual total return on stocks was 9.6 percent, virtually identical to the investment return of 9.5 percent—4.5 percent from dividend yield and 5 percent from earnings growth. That tiny difference of 0.1 percent per year arose from what I call speculative return. Depending on how one looks at it, it is merely statistical noise, or perhaps it reflects a generally upward long-term trend in stock valuations, a willingness of investors to pay higher prices for each dollar of earnings at the end of the period than at the beginning.
EXHIBIT 2.1 Investment Return versus Market Return—Growth of $1, 1900 - 2005
Compounding these returns over 106 years produced accumulations that are truly staggering. Each dollar initially invested in 1900 at an investment return of 9.5 percent grew by the close of 2005 to $15,062.
5 Sure, few (if any) of us have 106 years in us, but, like the Gotrocks family over the generations, the miracle of compounding returns is little short of amazing—it is perhaps the ultimate winner’s game.
As
Exhibit 2.1 makes clear, there are bumps along the way in the investment returns earned by our business corporations. Sometimes, as in the Great Depression of the early 1930s, these bumps are large. But we get over them. So, if you stand back from the chart and squint your eyes, the trend of business fundamentals looks almost like a straight line sloping gently upward, and those periodic bumps are barely visible.
Stock market returns sometimes get well ahead of business fundamentals (as in the late 1920s, the early 1970s, the late 1990s). But it has been only a matter of time until, as if drawn by a magnet, they soon return, although often only after falling well behind for a time (as in the mid-1940s, the late 1970s, the 2003 market lows).
In our foolish focus on the short-term stock market distractions of the moment, we, too, often overlook this long history. We ignore that when the returns on stocks depart materially from the long-term norm, it is rarely because of the economics of investing—the earnings growth and dividend yields of our corporations. Rather, the reason that annual stock returns are so volatile is largely because of the emotions of investing.
We can measure these emotions by the price/earnings (P/E) ratio, which measures the number of dollars investors are willing to pay for each dollar of earnings. As investor confidence waxes and wanes, P/E multiples rise and fall.
6 When greed holds sway, we see very high P/Es. When hope prevails, P/Es are moderate. When fear is in the saddle, P/Es are very low. Back and forth, over and over again, swings in the emotions of investors momentarily derail the steady long-range upward trend in the economics of investing.
“It is dangerous . . . to apply to the future inductive arguments based on past experience.”
What
Exhibit 2.1 shows is that while the prices we pay for stocks often lose touch with the reality of corporate values, in the long run, reality rules. So, while investors seem to intuitively accept that the past is inevitably prologue to the future, any past stock market returns that have included a high speculative stock return component are a deeply flawed guide to what lies ahead. To understand why past returns do not foretell the future, we need only heed the words of the great British economist John Maynard Keynes, written 70 years ago: “It is dangerous . . . to apply to the future inductive arguments based on past experience, unless one can distinguish the broad reasons why past experience was what it was.”
But if we can distinguish the reasons the past was what it was, then, we can establish reasonable expectations about the future. Keynes helped us make this distinction by pointing out that the state of long-term expectation for stocks is a combination of enterprise (“forecasting the prospective yield of assets over their whole life”) and speculation (“forecasting the psychology of the market”). I’m well familiar with those words, for 55 years ago I incorporated them in my senior thesis at Princeton, written (providentially for my lifetime career that followed) on the mutual fund industry. It was entitled, “The Economic Role of the Investment Company.”
This dual nature of returns is reflected when we look at stock market returns over the decades. Using Keynes’s idea, I divide stock market returns into two parts: (1) Investment Return (enterprise), consisting of the initial dividend yield on stocks plus their subsequent earnings growth, which together form the essence of what we call “intrinsic value”; and (2) Speculative Return, the impact of changing price/earnings multiples on stock prices.
Let’s begin with investment returns.
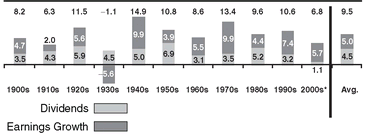
Exhibit 2.2 shows the average annual investment return on stocks over the decades since 1900. Note first the steady contribution of dividend yields to total return during each decade; always positive, only once outside the range of 3 percent to 7 percent, and averaging 4.5 percent. Then note that the con-tribution of earnings growth to investment return, with the exception of the depression-ridden 1930s, was positive in every decade, usually running between 4 percent and 7 percent, and averaging 5 percent per year. Result: Total investment returns (the top line, combining dividend yield and earnings growth) were negative in only a single decade (again, in the 1930s). These total investment returns—the gains made by business—were remarkably steady, generally running in the range of 8 percent to 13 percent each year, and averaging 9.5 percent.
EXHIBIT 2.2 Investment Return by the Decade (Percentage/ Year)
Enter speculative return. Compared with the relative consistency of dividends and earnings growth over the decades, truly wild variations in speculative return punctuate the chart as price/earnings ratios (P/Es) wax and wane (
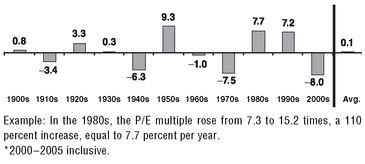
Exhibit 2.3). A 100 percent rise in the P/E, from 10 to 20 times over a decade, would equate to a 7.2 percent annual speculative return. Curiously, without exception, every decade of significantly negative speculative return was immediately followed by a decade in which it turned positive by a correlative amount—the quiet 1910s and then the roaring 1920s, the dispiriting 1940s and then the booming 1950s, the discouraging 1970s and then the soaring 1980s—reversion to the mean (RTM) writ large. (Reversion to the mean can be thought of as the tendency for stock returns to return to their long-term norms over time—periods of exceptional returns tend to be followed by periods of below average performance, and vice versa.) Then, amazingly, there is an unprecedented second consecutive exuberant increase in speculative return in the 1990s, a pattern never before in evidence.
EXHIBIT 2.3 Speculative Return by the Decade (Percentage/ Year)
By the close of 1999, the P/E rate had risen to an unprecedented level 32 times, setting the stage for the return to sanity in valuations that soon followed. The tumble in stock market prices gave us our comeuppance. With earnings continuing to rise, the P/E currently stands at 18 times, compared with the 15 times level that prevailed at the start of the twentieth century. As a result, speculative return has added just 0.1 percentage points to the annual investment return earned by our businesses over the long term.
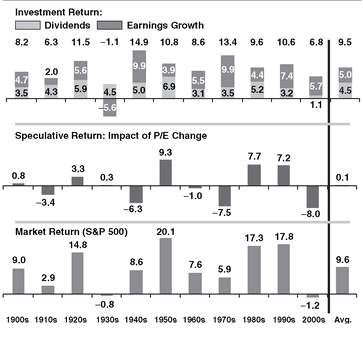
When we combine these two sources of stock returns, we get the total return produced by the stock market (
Exhibit 2.4). Despite the huge impact of speculative return—up and down—during most of the individual decades, there is virtually no impact over the long term. The average annual total return on stocks of 9.6 percent, then, has been created almost entirely by enterprise, with only 0.1 percentage point created by speculation. The message is clear: in the long run, stock returns depend almost entirely on the reality of the investment returns earned by our corporations. The perception of investors, reflected by the speculative returns, counts for little. It is economics that controls long-term equity returns; emotions, so dominant in the short-term, dissolve.
EXHIBIT 2.4 Total Stock Return by the Decade (Percentage/Year)
Accurately forecasting swings in investor emotions is not possible. But forecasting the long-term economics of investing carries remarkably high odds of success.
After more than 55 years in this business, I have absolutely no idea how to forecast these swings in investor emotions.
7 But, largely because the arithmetic of investing is so basic, I can forecast the long-term economics of investing with remarkably high odds of success. Why? Simply, it is investment returns—the earnings and dividends generated by American business—that are almost entirely responsible for the returns delivered in our stock market. Put another way, while illusion (the momentary prices we pay for stocks) often loses touch with reality (the intrinsic values of our corporations), in the long run it is reality that rules.
To drive this point home, think of investing as consisting of two different games. Here’s how Roger Martin, dean of the Rotman School of Management of the University of Toronto, describes them. One is “the real market, where giant publicly held companies compete. Where real companies spend real money to make and sell real products and services, and, if they play with skill, earn real profits and pay real dividends. This game also requires real strategy, determination, and expertise; real innovation and real foresight.”
Loosely linked to this game is another game, the expectations market. Here, “prices are not set by real things like sales margins or profits. In the short-term, stock prices go up only when the expectations of investors rise, not necessarily when sales, margins, or profits rise.”
The stock market is a giant distraction.
To this crucial distinction, I would add that the expectations market is not only a product of the expectations of active investors but the expectations of active speculators, trying to guess what these investors will expect, and how they will act as each new bit of information finds its way into the marketplace. The expectations market is about speculation. The real market is about investing. The only logical conclusion: the stock market is a giant distraction that causes investors to focus on transitory and volatile investment expectations rather than on what is really important—the gradual accumulation of the returns earned by corporate business.
My advice to investors is to ignore the short-term noise of the emotions reflected in our financial markets and focus on the productive long-term economics of our corporate businesses. Shakespeare could have been describing the inexplicable hourly and daily—sometimes even yearly or longer—fluctuations in the stock market when he wrote, “[It is] like a tale told by an idiot, full of sound and fury, signifying nothing.” The way to investment success is to get out of the expectations market of stock prices and cast your lot with the real market of business.
Don’t Take My Word for It
Simply heed the timeless distinction made by Benjamin Graham, legendary investor, author of The Intelligent Investor and mentor to Warren Buffett. He was right on the money when he put his finger on the essential reality of investing: “In the short run the stock market is a voting machine . . . (but) in the long run it is a weighing machine.” Ben Graham continues, using his wonderful metaphor of “Mr. Market.” “The investor with a portfolio of sound stocks should expect their prices to fluctuate and should neither be concerned by sizable declines nor become excited by sizable advances. He should always remember that market quotations are there for his convenience, either to be taken advantage of or to be ignored.
“Imagine that in some private business you own a small share which cost you $1,000. One of your partners, named Mr. Market, is very obliging indeed. Every day he tells you what he thinks your interest is worth and furthermore offers either to buy you out or to sell you an additional interest on that basis. Sometimes his idea of value appears plausible and justified by business developments and prospects. Often, on the other hand, Mr. Market lets his enthusiasm or his fears run away with him, and the value he proposes seems little short of silly.
“If you are a prudent investor will you let Mr. Market’s daily communication determine your view as the value of your $1,000 interest in the enterprise? Only in case you agree with him or in case you want to trade with him. Most of the time you will be wiser to form your own ideas of the value of your holdings. The true investor . . . will do better if he forgets about the stock market and pays attention to his dividend returns and to the operating results of his companies.”
