Chapter Twelve
Profit from the Majesty of Simplicity
Hold Index Funds That Own the Entire Stock Market.
IF LOW COSTS ARE GOOD (and I don’t think a single analyst, academic, or industry expert would disagree that low costs are good), why wouldn’t it be logical to focus on the lowest-cost funds of all—index funds that own the entire stock market? Several index funds carry expense ratios as low as 0.10 percent or even less, and incur turnover costs that turn out to be zero. They have all-in costs of just 10 basis points per year, 80 percent lower even than the 90 basis points for the low-cost quartile of funds described in Chapter 11.
And it works. Witness the real-world superiority of the S&P 500 Index Fund compared with the average equity fund over the past 25 years and over the previous decade, as described in earlier chapters. The case for the success of indexing in the past is compelling and unarguable. And with the outlook for subdued returns on stocks during the decade ahead, I am concluding my anecdotal stroll through the relentless rules of humble arithmetic with a final statistical example that suggests what the future may hold.
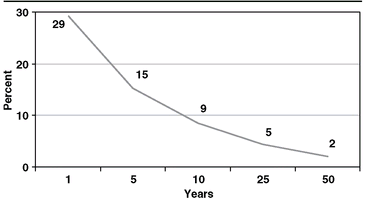
We can, in fact, use statistics designed to project the odds that a passively managed index fund will outpace an actively managed equity fund over various time periods. The complex exercise is called the “Monte Carlo simulation.”
20 What it does is make a few simple assumptions about the volatility of equity fund returns and the extent to which they vary from the returns earned in the stock market, as well as an assumption about the all-in costs of equity investing. The particular example presented here assumes that index fund costs will run to 0.25 percent per year and that the costs of active management will run to 2 percent per year. (Index funds are available at far lower costs, and the typical equity fund has even higher costs, so we’ve given actively managed funds the benefit of a very large doubt.)
Result: Over one year, about 29 percent of active managers on average, would be expected to outpace the index; over five years about 15 percent would be expected to win; over 10 years, 9 percent; over 25 years, 5 percent; and over 50 years just 2 percent of active managers would be expected to win (
Exhibit 12.1).
How will the future actually play out? Of course, we can’t be sure. But we know what the past 25 years look like, and we know that over the past 35 years only 9 of the 355 funds in business at the outset outperformed the stock market index by more than 2 percent per year. What’s more, even the majority of these winners lost their early edge a decade or more ago. So it looks as if our statistical odds are in the right ballpark. This arithmetic suggests—even demands—that index funds deserve an important place in your portfolio, even as they constitute the overriding portion of my own.
EXHIBIT 12.1 Odds of Actively Managed Portfolio Outperforming Passive Index Fund
Whatever the case, in the era of subdued stock and bond market returns that most likely lies in prospect, fund costs will become more important than ever. Even more so when we move from the illusion that mutual funds as a group can capture whatever returns our financial markets provide to the even greater illusion that most mutual fund investors can capture even those depleted returns in their own fund portfolios. What the index fund has going for it is, as I have often said, “the magic of simplicity in an empire of parsimony.”
To reiterate: all those pesky costs—fund expense ratios, sales charges, and turnover costs; tax costs; and the most subtle cost of all, the rising cost of living (inflation) —are virtually guaranteed to erode the spending power of our investments over time. What’s more, only in the rarest cases do fund investors actually succeed in capturing the returns that the funds report.
My conclusions rely on mathematical facts—the relentless rules of humble arithmetic.
My conclusions about the market returns we can expect in the years ahead, as well as my conclusions about the share of those returns that funds will capture, and the share of those returns that we investors will actually enjoy, have one thing in common: They rely, not on opinion, but largely on mathematical facts—the relentless rules of humble arithmetic that make selecting winning funds rather like looking for a needle in a haystack. You ignore these rules at your peril.
If the road to investment success is filled with dangerous turns and giant potholes, never forget that simple arithmetic can enable you to moderate those turns and avoid those potholes. So do your best to diversify to the nth degree; minimize your investment expenses; and focus your emotions where they cannot wreak the kind of havoc that most other people experience in their investment programs. Rely on your own common sense. Emphasize all-stock-market index funds. Carefully consider your risk tolerance and the portion of your investments you allocate to equities. Then stay the course.
All index funds are not created equal. One example: the difference between $122,700 and $99,100.
I should add, importantly, that all index funds are not created equal. While their index-based portfolios are substantially identical, their costs are anything but identical. Some have miniscule expense ratios; others have expense ratios that surpass the bounds of reason. Some are no-load funds, but nearly a third, as it turns out, have substantial front-end loads, often with an option to pay those loads over a period of (usually) five years; others entail the payment of a standard brokerage commission.
The gap between the costs charged by the low-cost funds and the high-cost funds offered by 10 major fund organizations for their S&P 500-Index-based funds runs upward of an amazing 1.2 percentage points per year. (
Exhibit 12.2)
Today, there are some 115 index mutual funds designed to track the S&P 500 Index. Astonishingly, more than half of them carry an initial sales load, albeit often concealed by offering class “B” shares with no front-end load but with an additional heavy annual fee (used to pay the broker). The wise investor will select only those index funds that are available without sales loads, and those operating with the lowest costs. These costs—no surprise here!—are directly related to the net returns delivered to the shareholders of these funds.
| Five Low-Cost Index 500 Funds | Annual Expense Ratio | Annual Expense Ratio Including Any Sales Charges |
|---|
| 1. Fidelity Spartana | 0.07% | 0.07% |
| 2. Vanguard Admirala | 0.09 | 0.09 |
| 3. Vanguard (Regular) | 0.18 | 0.18 |
| 4. USAA | 0.19 | 0.19 |
| 5. T. Rowe Price | 0.35 | 0.35 |
| Five High-Cost Fundsb |
| 1. UBS | 0.69% | 1.45% |
| 2. Morgan Stanley | 0.64 | 1.40 |
| 3. Wells Fargo | 0.64 | 1.39 |
| 4. Evergreen | 0.56 | 1.31 |
| 5. J.P. Morgan | 0.53 | 1.30 |
| a Share classes available subject to initial minimum investments and/or specified holding periods. |
| b Investors pay the lower expense ratio only if they first pay an initial sales charge of about 5 percent. |
In the past, some S&P 500-Index-based funds may have earned small increases in return (or been penalized by small reductions) based on their managers’ ability (or inability) to employ strategies that allow small short-term departures from the exact weightings of the stocks in the index. I assume, however, that these variations will be lower in the future, and have therefore ignored them as an element in the cost-value equation. Funds tracking a particular index are—or should be—commodities in terms of their portfolios and the returns they provide. So variations in costs make the difference. While cost differentials may look trivial when expressed on an annual basis, compounded over the years they make the difference between investment success and failure.
In January 1984, the second index mutual fund was formed—Wells Fargo Equity Index Fund. Its subsequent return can be compared with that of the original Vanguard 500 Index Fund over the same period. Both funds selected the S&P 500 Index as their benchmark. The sales commission on the Vanguard Index 500 Fund was eliminated within months of its initial offering, and it has operated with an expense ratio averaging 0.28 percent annually. (By 2005, the ratio had decreased to 0.18 percent, and to 0.09 percent for longer-term investors and those who had $100,000 or more invested in the fund.) In contrast, the Wells Fargo fund carried an initial sales charge of 5.5 percent througout the period, and its expense ratio averaged 0.80 percent per year (0.64 percent in 2005).
These seemingly small differences added up to a 23 percent enhancement in value for the Vanguard fund. An original investment of $10,000 in each produced a profit of $122,700 for the Vanguard 500 Index Fund, compared with $99,100 for the Wells Fargo Equity Index Fund. All index funds are not created equal. Intelligent investors will select the lowest cost index funds that are available from reputable fund organizations.
Your index fund should not be your manager’s cash cow. It should be your own cash cow.
Some years ago, a Wells Fargo representative was asked how the firm could justify such high charges. The answer: “You don’t understand. It’s our cash cow.” (That is, it regularly generates lots of profits for the manager.) By carefully selecting the lowest cost index funds for your portfolio, you can be sure that the fund is not the manager’s cash cow, but your own.
Given my preference for the all-market index fund, I almost hesitate to tell you that, since that lonely first S&P Index was formed in 1975, a staggering total of another 578 more index funds of all sizes and shapes are now in operation. Investors face a mind-boggling set of confusing choices—large cap, mid-cap, small-cap, industry sectors, international, single country, and so on. To make it more confusing, indexing works like a charm in every one of these areas. A well-administered index fund is inevitably destined to surpass the returns earned by the other investors in the market segment tracked by its index. Even though we never have complete information about the precise returns earned by investors as a group in each segment, given the relentless rules of humble arithmetic, it must work that way.
Standard & Poor’s Corporation now compares index returns with actual returns achieved by active managers in many U.S. market segments, and the results are unmistakable. Over the past five years alone, the S&P 500 Index has outpaced 67 percent of large-cap general equity funds, while the S&P Mid-Cap 400 Index has outperformed 84 percent of mid-cap funds, and the S&P Small-Cap 600 Index has outperformed 79 percent of all small-cap funds. Remarkable but unsurprising. While these comparisons, sorted by number of funds rather than by fund assets, have the flaws noted earlier, the message could hardly be clearer: indexing is the winning strategy.
Interestingly, Standard & Poor’s tries to take survivor bias into account in its calculations. During the past five years alone, an astonishing 28 percent of all general equity funds have gone out of business. That’s one more warning about relying on actively managed mutual funds as long-term investments.
In inefficient markets, the most successful managers may achieve unusually large returns. But common sense tells us that for each big success, there must also be a big failure.
While it is alleged that indexing doesn’t work in markets that are less-efficient than the large stocks in the S&P 500, the impressive performance of the small- and mid-cap indexes suggest that it works perfectly well. As it must. For, whether markets are efficient or inefficient, as a group all investors in that segment earn the return of that segment. In inefficient markets, the most successful managers may achieve unusually large returns. But never forget that, as a group, all investors in any discrete segment of the stock market must be, and are, average. Common sense tells us that for each big success, there must also be a big failure. But after all those deductions of even larger management fees that funds incur in less efficient markets, and the damaging impact of their even larger turnover costs, the aggregate lag is even wider. So even in inefficient market segments, index funds, with their tiny costs, win again.
International funds are also subject to the same allegation that it is easier for managers to win in (supposedly) less-efficient markets. But also to no avail. S&P reports that the international index (world markets, less U.S. stocks) outpaced 80 percent of actively managed international equity funds over the past five years. Similarly, the S&P Emerging Markets Index outpaced 88 percent of emerging market funds. With indexing so successful in both more efficient and less efficient markets alike, and in U.S. markets and global markets, I’m not sure what additional data are required to close the case in favor of index funds.
But while investing in particular market sectors is done most efficiently through index funds, betting on the winning sectors is exactly that: betting. But betting is a loser’s game. Why? Largely because emotions are almost certain to have a powerful negative impact on the returns that investors achieve. Whatever returns each sector may earn, the investors in those very sectors will likely, if not certainly, fall well behind them. For there is abundant evidence that the most popular sector funds of the day are those that have recently enjoyed the most spectacular recent performance. As a result, after-the-fact popularity is a recipe for unsuccessful investing.
Indexing stock market sectors, a strong idea. Betting on stock market sectors, a weak reality.
For example, when Vanguard created the industry’s first Growth Index Fund and Value Index Fund in 1992, the former was designed for younger investors who focused on wealth accumulation, were seeking tax-efficiency, and were willing to assume larger risks. The latter was designed for older investors who focused on wealth preservation, were seeking higher income, and were happy to reduce their risks. Alas, while the original idea was strong, the ensuing reality was weak. What followed their introduction was a classic example of performance chasing.
During the 1993 to 1997 period, the stock market was relatively placid, and value stocks and growth stocks delivered similar returns. Then in the new economy bubble, growth stocks took off, earning a cumulative return by 2000 that left value stocks in the dust (1992 to March 2000: Growth Index total return, 364 percent; Value Index total return, 229 percent). Après moi le deluge! Reversion to the mean took hold, and growth stocks plummeted through 2002.
Investor interest in the two fund styles was well balanced during the early years. But in the bubble that followed, investors poured $11 billion into the soaring Growth Index Fund, nearly four times the $3 billion invested in the sedate Value Index Fund. Then, in the aftermath, investors switched their loyalty, with net redemptions of $850 million in the Growth Index Fund during 2001 to 2006 and net purchases approaching $2 billion in the Value Index Fund.
Since 1993, the two funds have achieved substantial positive returns on the standard time-weighted basis—9.1 percent per year for Growth and 11.2 percent for Value. With their counterproductive timing and selection, however, investors in these index funds have not come even close to matching those returns. The average dollar-weighted return earned by investors in the Growth Index Fund was a pathetic 0.9 percent per year. While investors in the Value Index Fund did better, their return of 7.6 percent still lagged the return on the Value Index Fund by 3.6 percentage points per year.
Since 1993, the cumulative return of the Growth Index has been 224 percent, versus 320 percent for the Value Index, based on the traditional calculation of fund performance. The Growth Index Fund investor, meanwhile, earned but 13 percent, and the Value Index Fund investor earned about 170 percent. Despite my best intentions when they were formed, Vanguard’s Growth Fund and Value Index Funds proved to be a paradigm for the ways that investors fool themselves, relinquishing perfectly acceptable long-term returns in their search to find the Holy Grail of extra returns in the short run.
So look before you leap in trying to pick which market sector to bet on. It may not be as exciting, but owning the classic stock market index fund is the ultimate strategy. It holds the mathematical certainty that marks it as the gold standard in investing, for try as they might, the alchemists of active management cannot turn their own lead, copper, or iron into gold. Just avoid complexity, rely on simplicity, take costs out of the equation and trust the arithmetic.
Don’t Take My Word for It
You may think that I am too pessimistic in calculating the odds that only 2 percent of all equity mutual portfolios will outperform the stock market over 50 years. If so, consider the odds calculated by Michael J. Mauboussin, chief market strategist at Legg Mason, adjunct professor at Columbia Business School, and author of the best-selling More than You Know. While my 2 percent estimate would mean that 1 portfolio in 50 would outperform the stock market over 50 years, Mauboussin calculates the odds of a fund outperforming for 15 years consecutively at 1 in 223,000, and at 1 in 31 million over 21 years. Either way, the odds of outpacing an all-market index fund are, well, terrible.
Now listen to Warren Buffett’s widely esteemed partner Charlie Munger, who eloquently states the case for shunning the foolish complexity of investing and opting for simplicity: “At large charitable foundations in recent years there has been a drift toward more complexity. In some endowment funds, there are not few but many investment counselors, chosen by an additional layer of consultants who are hired to decide which investment counselors are best, help in allocating funds to various categories, insure that claimed investment styles are scrupulously followed . . . [plus] a third layer of the security analysts employed by investment banks. There is one thing sure about all this complexity, the total cost of all the investment management, plus the frictional costs of fairly often getting in and out of many large investment positions, can easily reach 3 percent of foundation net worth per annum. All the equity investors, in total, will surely bear a performance disadvantage per annum equal to the total croupiers’ costs they have jointly elected to bear. . . . And it is unescapable that exactly half of the investors will get a result below the median result after the croupier’s take, a median result that may well be somewhere between unexciting and lousy. The wiser choice is to dispense with the consultants and reduce the investment turnover, by changing to indexed investment in equities.” (Once again, shades of the Gotrocks family.)