Chapter Thirteen
Bond Funds and Money Market Funds
Where Those Relentless Rules Are Even More Powerful
SO FAR, MY DISCUSSION of the index fund (and its hand-maiden, low investment costs) has related to the stock market and to equity mutual funds. But the relentless rules of humble arithmetic with which I’ve regaled you also apply—arguably even more forcefully—to bond funds and money market funds.
Perhaps it’s obvious why this is so. While a seemingly infinite number of factors influence the stock market and each individual stock that is traded there, a single factor influences the bond market and the money market (and for that matter, each individual fixed-income security) far more than any other: the prevailing level of interest rates. Managers of fixed-income funds can’t do much, if anything, to influence rates. If they don’t like the rates established in that market, calling the Treasury Department or the Federal Reserve, or otherwise trying to change the supply-and-demand equation, is unlikely to bear fruit.
So let’s be clear: In the long run, virtually 100 percent of the return on any bond fund or money market fund is accounted for by the net interest income it generates for its shareholders. The only way for a manager to add an increment to that return is to make interest rate bets—for example, by selling bonds when he expects rates to go up (and prices down), and then buying bonds when the reverse is expected to happen. If you think that picking stocks and timing their purchase is hard, just imagine how hard it is to execute these same strategies successfully in the incredibly efficient precincts of the bond market.
Thus, managers of fixed income funds almost inevitably deliver a gross return that parallels the baseline constituted by the interest rate environment. Yes, a few managers might do better—even do better for a long time—by being extra smart, or extra lucky, or by taking extra risk. Yet even the best bond and money market managers can add only a few fractions of one percent per year to your long-term returns, albeit only by risking a comparable shortfall. What’s more, even if they achieve these margins, they rarely overcome the fees, sales loads, and expenses involved in acquiring their services.
While these costs make the task of adding returns far more difficult, overly confident bond fund managers may be tempted to take just a little extra risk by extending maturities of the bonds in the portfolio. (Long-dated bonds—say, 30 years—are much more volatile than short-term bonds—say, two years—but usually provide higher yields.) They are also tempted to reduce the investment quality of the portfolio, holding less in U.S. Treasury bonds (rated AAA) or in investment-grade corporate bonds (rated BBB or better), and holding more in below-investment-grade bonds (BB or lower), or even some so-called junk bonds, rated below CC or even unrated.
Since stocks represent the residual ownership (or equity) of corporations, the word safety is not usually associated with them. Unlike bonds, stocks can’t default. Bonds, on the other hand, represent debt. If the payments of interest that corporations and governments promise to make every six months are threatened, their ratings will be downgraded and the market value of their bonds reduced. And if they finally fail to make the promised payments, they enter bankruptcy proceedings. Where bonds are concerned, Brandeis’s warning becomes particularly meaningful: “Remember, O stranger, arithmetic is the first of the sciences and the mother of safety.”
There are too many types of bond funds to try your patience by examining all of them. So this chapter presents the three basic maturity levels that have become the industry standard, one in each of the three major bond segments—taxable (corporate and government) bonds, tax-exempt municipal bonds, and U.S. Treasury issues. The discussion begins with intermediate-term taxable bond funds; then turns to long-term tax-exempt bond funds; and finally evaluates funds investing in short-term U.S. Treasury notes.
Among intermediate-term taxable bond funds, the low-cost index fund is truly a superior performer.
As you’ll see, the low-cost intermediate-term bond index fund is a truly superior performer
21 (
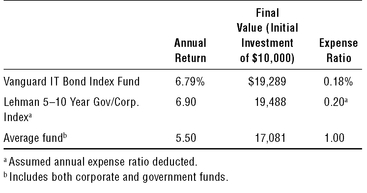
Exhibit 13.1). (A finding that indexing wins should no longer surprise you.) With a 10-year return averaging 6.8 percent annually, it comes within a whisker of outpacing the (cost-adjusted) return of the comparable Lehman 5-10 Year Government/Corporate Bond Index. What is more, the index fund’s annual return of 6.8 percent was almost 25 percent higher than the 5.5 percent return of its average peer. While the actively managed bond funds as a group earned a lower gross return than either the index fund or the index, relative cost proved to be the principal differentiator in net return.
EXHIBIT 13.1 Intermediate-Term Taxable Bond Funds: Returns and Costs, 1996-2006
As a group, the portfolios of the actively managed bond funds include about 25 percent corporate and 75 percent U.S. government bonds (largely bonds of government agencies), whereas the bond index and the bond index fund include about 50 percent in corporates and 50 percent in governments. While the bond index fund carried slightly more volatility risk (with an annualized standard deviation of 5 percent versus 3.7 percent for the active managers), both figures represent an extremely low risk level.
And so the message echoes. Among intermediate-term taxable bond funds, in terms of maximizing your return and minimizing your risk, the low-cost index fund is truly a superior performer. The Vanguard Intermediate-Term Bond Index Fund, for example, has an expense ratio of 0.18 percent, less than one-fifth of the 1.0 percent expense ratio of its average peer. In addition, its return benefits from the absence of sales loads. Always avoid bond funds with sales loads. (A typical 5 percent load would obliterate your entire yield for the first year.) With a cumulative final value of an initial investment of $10,000 growing to $19,289 in the index fund, versus just $17,081 for its average rival, the index strategy is a winning strategy, outpacing an amazing 550 of its 570 peers over the past decade.
Among long-term tax-exempt bond funds, once again, indexing wins.
Now let’s consider long-term maturities, with a focus on tax-exempt municipal bond funds. Because of complexities in the construction of municipal bond indexes, there are no pure index funds in this category. But the results of the major index in the field (the Lehman Brothers Tax-Exempt 10-Year Maturity Index) confirm the power of indexing in surpassing the returns provided by the average active bond manager (
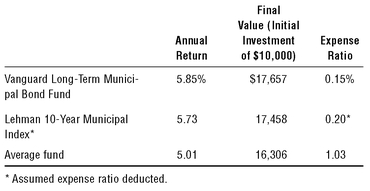
Exhibit 13.2). Since the index provided a gross return of 5.93 percent, a comparable index fund, after assumed costs of 0.20 percent, would have provided a 5.73 percent net annual return.
By way of comparison, the Vanguard Long-Term Tax-Exempt Bond Fund—whose expense ratio of 0.15 percent is actually slightly below these assumed costs for the index fund—provided a net return of 5.85 percent, a bit higher than the assumed return of the bond index fund. Like the index fund, this bond fund is broadly diversified, holds a high-quality portfolio (87 percent rated A or better, even higher than its actively managed peers), and minimizes turnover.
EXHIBIT 13.2 Long-Term Municipal Bond Funds: Returns and Costs, 1996 - 2006
Once again, low costs lead to higher returns. The 5.73 percent annual return of the hypothetical municipal bond index fund was roughly 15 percent more than the 5.0 percent earned by the average long-term municipal fund, even though the actively managed funds were assuming higher risks—15 percent in lower-rated bonds versus 4 percent for the index and 13 percent for the Vanguard fund.
Over the past decade, $10,000 initially invested in the Vanguard Long-Term Municipal Bond Fund grew to $17,657, versus $16,306 for its average rival. With low-costs, broad diversification, and no serious attempt to outguess the market in long-term tax-exempt bond funds, once again indexing wins. Its close proxy, the Vanguard Long-Term Municipal Bond Fund, ranked first among its 194 peers.
Among short-term Treasury funds, the lowest cost option wins again.
Our sweep of the bond fund arena concludes with an examination of short-term funds investing in U.S. Treasury obligations (
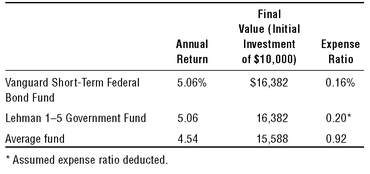
Exhibit 13.3). There are few surprises here. The net return earned by the index itself (5.06 percent per year, adjusted for an assumed expense ratio of 0.20 percent) outpaces the average fund. Again, while the Vanguard Short-Term Federal Bond Fund is not, technically speaking, an index fund, it tracks the index return with remarkable precision, turning in a net average annual return of 5.06 percent over the past decade. The lowest cost options win again, outpacing 97 of the 122 short-term government funds. (Treasurys being Treasurys, investment quality is virtually uniform. Both the Vanguard index fund and the index itself hold 100 percent of their portfolios in short-term U.S. Treasury notes, and the active funds hold 99 percent.)
EXHIBIT 13.3 Short-Term Treasury Bond Funds: Returns and Costs, 1996-2006
With its towering 0.92 percent average expense ratio, the average short-term bond fund has a lot to overcome. It doesn’t succeed—it can’t succeed—in overcoming that handicap, even by assuming somewhat more volatility risk than the government index and the Vanguard, both of which funds displayed slightly less volatility than their active peers. (Again, many of these actively managed funds carry sales charges, averaging 3 percent, which are incorporated into the returns shown in
Exhibit 13.3.)
The tracking of its benchmark, its quality parity, and its extremely low expenses mark the Vanguard Short-Term Treasury Bond Fund as the functional equivalent of the Lehman 1-5 Year Government Bond Index. While there are no bond funds that track this index, the Vanguard fund is the virtual equivalent of an index fund. Both provided cumulative gains on an initial investment of $10,000 of an identical $16,382 over the past decade, compared with $15,588 for the average short-term Treasury fund.
Among money market funds—surprise! —low cost wins again.
Money market funds can be thought of as very short-term bond funds with uniformly high credit quality. Federal regulations limit money market funds to high-grade commercial and bank paper, and as a practical matter limit maturities to a very short term (about 60 days), to maintain a stable asset value of $1.00 per share. (Unlike bank savings accounts, money market funds are not guaranteed by the Federal Deposit Insurance Corporation.) As a result, money market funds hold portfolios with generally similar quality (though a bit of “stretching” for yield often goes on) and very short maturity (usually averaging about 40 days). As a result, they tend to earn substantially identical gross yields on their portfolios.
With their short maturities, extremely high credit quality, and broadly diversified portfolios, money market funds essentially become commodities. Thus, when all else is equal (as it is here), relative performance is determined by relative cost. So, even more than in stock index funds and bond index funds, cost tells virtually the entire story in money market funds.
If we rank the records of all 190 money market funds in terms of the returns they have delivered to investors over the past 10 years (highest first) and then compare their expense ratio (lowest first), the relationship is almost perfect.
Exhibit 13.4 echoes the cost versus return analysis of
Exhibits 13.1 to
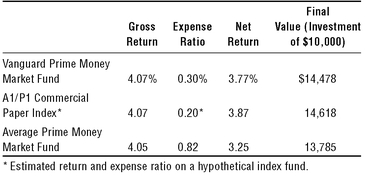
13.3. The Vanguard Prime Money Market Fund, close cousin to our hypothetical index fund, was among the leaders, producing a net annual return of 3.77 percent for the past decade, some 15 percent above the return on the average money market fund. Cumulatively, a $10,000 initial investment in the Vanguard Prime Money Market Fund grew to $14,478 over the past decade, versus $13,785 for its average peer. Among 190 comparable funds, it ranked number 7.
EXHIBIT 13.4 Money Market Funds: Returns, Costs, and Risks, 1996-2006
Remarkably, while the data are not shown in
Exhibit 13.4, money market funds in the high-cost quartile earned a gross return of 4.10 percent (about equal to the average). But with a shocking annual expense ratio of 1.39 percent, these high-cost funds delivered a net return of just 2.71 percent to their owners. Why would investors pay more than a 0.50 percent annual cost for a money market fund? The answer is beyond me. (They should probably have their heads examined.) How the supposedly independent directors of these 45 money funds with expense ratios at or above the 1.00 percent level could vote to approve such fees is an even bigger question. Their job is to represent the interests of the fund shareholders, and they have failed. But intelligent investors don’t need to fail. If you avoid these high-cost money market funds in favor of low-cost funds, you inevitably earn superior returns.

Summing up, I realize full well that investors are far more focused on equity funds and the stock market than on fixed-income funds. Nonetheless, smart investors will save themselves lots of money—and substantially improve their returns—if they apply the same principles of broad diversification, low-cost, no-load, minimal turnover, and long-term investing when they select fixed income funds. These are the very commonsense characteristics that enable index funds to guarantee your fair share of the returns in the bond and money markets, even as they do in all financial markets.
Don’t Take My Word for It
While not a lot has been written about the remarkable (and remarkably obvious) value of index funds that invest in bonds, the convictions expressed in this chapter have been strongly reinforced by Walter R. Good, CFA and Roy W. Hermansen, CFA, in Index Your Way to Investment Success. “Comparison of expenses, transaction costs, and, where applicable, sales loads identify the cost advantage for bond index funds. For the purposes of projecting returns, let’s assume that the actively managed fund and the benchmark index fund each hold bonds that, overall, yield the same 7 percent annual rate of return. For the actively-managed load funds, the index fund advantage amounts to 1.2 percentage points per year. The data provide a sobering glimpse of the challenge encountered by the active bond fund manager . . . and suggest how much additional return active management may have to add—on average over an extended period—just to break even! . . . Near-index bond mutual funds provide an alternative to indexing the bond market. While the funds do not completely conform to the index fund model, they share key characteristics: very high degree of diversification [in the specified market segment], very low expense ratio, very low transaction costs, and absence of sales loads.”
Once again, further confirmation comes from across the pond. England’s Timothy Hale, author of Smarter Investing—Simpler Decisions for Better Results, writes, “You should not overlook the efficacy of index investing for bonds, which up to now has been whispered rather than shouted from the rooftops. The evidence is compelling and comes down firmly in favor of investing in index funds. . . . Over the ten-year period 1988-1998, US bond index funds returned 8.9 per cent a year against 8.2 per cent for actively managed bond funds (with) index funds beating 85 per cent of all active funds. This differential is largely due to fees.”


