Chapter 16
“High Standards of Commercial Honor . . . Just and Equitable Principles of Trade . . . Fair Dealing with Investors”153
For something like two full decades during the 1960s and 1970s, I maintained an active involvement with NASD regulation as a member and then chairman of the Investment Companies Committee, and as a member of the Long-Range Planning Committee. While I have had little experience with regulators for the New York Stock Exchange, I believe the consolidation of these two enforcement groups will significantly enhance investor protection.
In the mid-1970s, long-range planning for the securities industry was no mean challenge. The long era of (high) fixed commissions on brokerage transactions had ended in 1974, replaced by today’s system of (minuscule) negotiated commissions. Financial technology was just being introduced, and it was clear that the slow, old order (and its glacial pace of change) hath changeth to be replaced by a new order operating at a millisecond pace. And securities regulations were beginning to change and litigation to grow. In the phrase that I used then, “competition, communications, and the courts will reshape the securities industry.” In some ways these changes were easily foreseen (I’ve reviewed the ancient minutes of our committee meetings) and in some ways totally unforeseen. But the securities industry survived and thrived, and is wallowing in prosperity today.
I reveled in those years of working on industry issues with a classy, integrity-laden group of financial leaders and regulators, dedicated to the public interest. While I haven’t participated in NASD affairs for a long time, it occurs to me that the basic mission remains unchanged. As Mary Schapiro, your chief executive, pointed out recently, “investor protection and market integrity remain FINRA’s overarching objectives.” So I’m glad to be back, though I note with some vague concern that among your 50 workshops, none discusses mutual funds. I hope that the reflections and policy recommendations that follow will fill that gap.
I’ll focus on investor protection in the mutual fund industry, discussing what can be done to assure that fund investors get a fair shake, or, as I wrote in my senior thesis at Princeton University almost 57 years ago, that “mutual funds must be operated in the most efficient, economical, and honest way possible.” It was that thesis that opened the door to my first job in this industry, and I’ve been with the same firm ever since, although it has changed greatly.
154 That was a pretty good characterization of how the industry worked in 1951. But it is with regret that I report to you that the ethos of today’s mutual fund industry—with some, but not nearly enough, exceptions—has moved away from those principles. I am a tough critic of today’s fund industry, but acknowledge that my views are not widely shared by my industry colleagues. Indeed, one veteran industry leader has stated that “Mr. Bogle’s view of ethics may be somewhat outside the mainstream.” He was, of course, quite right.
Commercial Honor, Equitable Principles, Fair Dealing
To set the stage for my remarks, I’ve chosen as my title the three central standards of the NASD Rules of Fair Practice: “A member, in the conduct of its business, shall observe high standards of commercial honor and just and equitable principles of trade,” and shall engage in “fair dealing with investors.” With these principles in mind, let me discuss how they relate to the mutual fund industry, which has changed in so many fundamental ways.
• A new mission. We’ve moved our central mission from stewardship to salesmanship, and our core value from managing assets to gathering assets. We have become far less of a management industry and far more of a marketing industry, engaging in a furious orgy of “product proliferation” that has ill-served our investors. Once an industry that “sold what we made,” our new motto has become “If we can sell it, we will make it.” For example, right at the peak of the late, great bull market, we created 494 new “aggressive growth” funds, investing largely in technology and telecommunication stocks. The consequences for our investors were devastating.
• Our funds, once broadly diversified, became largely specialized. In 1951, almost 80 percent of all stock funds (60 of 75) were broadly diversified among investment-grade “blue-chip” stocks, pretty much tracking the movements of the stock market itself, and lagging its returns only by the amount of their then-modest operating costs. Today, our total of 512 “large-cap blend funds” account for only 11 percent of all stock funds. These “market beta” funds are now vastly outnumbered by 4,200 more specialized funds—3,100 U.S. equity funds diversified in other styles; 400 funds narrowly diversified in various market sectors; and 700 funds investing in international equities, some broadly diversified, some investing in specific countries. The challenge in picking funds, dare I say, has become roughly akin to the challenge in picking individual stocks. I don’t regard that change as progress.
• The wisdom of long-term investing has given way to the folly of short-term speculation. In 1951, a mutual fund held the average stock in its portfolio for about six years—investing. Today, the average holding period for a stock in an equity fund portfolio is just over one year—speculation. Neither is that change progress.
• We’ve discouraged long-term investors. With the substantial differences in short-term returns that inevitably occur among these different fund styles, investors have come to chase past performance. In 1951, most fund investors just picked funds and held them—on average, for about 16 years. Today, investors trade their funds, now holding the typical fund in their portfolios for a period of only about four years—a negative reversal with unfortunate consequences for our clients.
• The ethos of fund managers has changed. Once dominated entirely by small, privately owned firms and operated by professional investors, the industry is now dominated by giant, publicly owned firms, largely operated by businessmen bereft of investment experience. Today, 41 of the 50 largest fund managers are publicly held, including 35 owned by giant U.S. and international financial conglomerates. Small wonder that these firms are all too eager to focus on maximizing the return on their own capital invested in the fund management companies they own, rather than focusing on maximizing the return on the capital they are investing for fund shareholders—another compelling negative for our clients.
All of these departures from our traditional role as fiduciaries have ill-served fund investors. Think about it. With all due respect, the motivations of the businessman in financial services, who must gather assets in order to prosper and who must constantly sell something, week after week, differs, not only in degree but in kind, from the motivations of the trustee, a member of a profession with high standards of conduct and a duty to serve client before self.
The drive for asset gathering is importantly responsible for our product proliferation. We must always have a “product” that will sell. But it also has another negative aspect. We allow—and indeed encourage—our successful funds to grow too large to maintain the investment flexibility that produced the attractive returns that drew the attention—and the dollars—of investors in the first place. Too rarely is the marketing spigot turned off.
Crowd-like behavior is another obvious cause of the changes I’ve described. I remember an industry in which “there are some things that one simply doesn’t do.” But today what I see is, “When everyone else is doing it, I can do it, too.” (I concede that the mutual fund industry is hardly alone in manifesting this debasement in values.)
Finally, greed rears its ugly head. Of course we don’t think of ourselves as greedy. (Perhaps no one does.) But the enormous management compensation now generated by this giant industry can easily blind us to our underlying motives. Paraphrasing Upton Sinclair: “It’s amazing how difficult it is for a man to understand something if he’s paid a small fortune not to understand it.” The lack of introspection by industry leaders, then, has been just one more negative force. (Ironically, the amount of dollars and cents paid to fund executives is kept secret from the shareholders who own our funds, the only publicly held U.S. corporations with a blanket exemption from such disclosure.)
I’ve been asked this fundamental question: “Are fund managers now less ethical than they once were?” I’d have to answer, “I doubt it.” With a handful of truly horrifying exceptions (tact, not usually my strong point, precludes my naming them), the industry leaders I’ve known have been men and women of high character, impressive integrity, and substantial intelligence. But they are part of a system in which traditional values have eroded, operating in a new “bottom-line society” that worships a bottom line so easily measured in dollars and cents, rather than in qualities not susceptible to measurement—for example, character, and integrity, and trust.
How else to explain the disgraceful conduct of so many of the oldest, largest, and once most respected management companies in this industry—now representing
 2 trillion
 of fund assets, almost 30 percent of the total—in aiding and abetting illicit market-timing schemes. Or the number of leading brokerage firms engaged in “breakpoint” frauds in which excessive sales loads were imposed on investors. Or having one of the bluest of the industry’s blue-chip firms—one of the three largest firms in our field—violate NASD rules by allocating brokerage commissions as a
quid pro quo to brokers that sold the shares of its funds. What’s more, according to the NASD decision, the firm’s executives were duplicitous on the witness stand. (The actual word was “disingenuous.”) While the examiner recommended a $100 million fine, it was reduced to $5 million on the grounds that the illicit practice was rife in the industry (i.e., “Everyone else was doing it, so I can too”).
Together, this disgraceful conduct represents a sorry chapter in this industry’s history. But I know of no easy way to regulate or legislate a return to our industry’s traditional values. Competition, in fact, is driving us in quite the opposite direction. As long as our industry participants—our fund managers and marketers, our brokerage firm account executives, and our financial advisers—have more information at hand than their clients possibly could—the economists call this information asymmetry—a largely unaware investment public will be inadequately informed. Regulations calling for more complete disclosure would be a huge help in protecting investors from their own naiveté and lack of information.
So I’ll now focus on three major problem areas. By doing so in some depth and detail, I hope to convey not only the nature of the problems, but the change—for the worse—in the industry environment, and the historical context in which they have arisen. I think you’ll be amazed at what you’ll see. The three areas are:
1. The importance of investment income.
2. Fund returns versus shareholder returns.
3. Measuring shareholder satisfaction.
The Importance of Investment Income
One of the great unexplained curiosities of the mutual fund industry is its unwillingness to call attention to the vital role of investment income in shaping the returns on equities. Theory tells us, and experience confirms, that dividend yields play a crucial role in shaping stock market returns. In fact, the dividend yield on stocks has accounted for almost one-half of their total long-term return. Of the 9.6 percent nominal total return earned by stocks over the past century, fully 9.5 percent has been contributed by investment return—4.5 percent by dividend yields and 5 percent from earnings growth. (The remaining 0.1% resulted from an 80% increase in the price-earnings ratio, from 10 at the start of the century to 18 at the end, amortized over the long period. I describe changes in the p/e ratio as speculative return.)
When we take inflation into account, the importance of dividend income is magnified even further. During the past century, the average rate of inflation was 3.3 percent per year reducing the
nominal 5 percent earnings growth rate to a
real growth rate of just 1.7 percent.
155 Thus, the inflation-adjusted return on stocks was not 9.6 percent, but 6.3 percent. In real terms, then, dividend income has accounted for almost 75 percent of the annual investment return on stocks.
But while dividend income has accounted for nearly 50 percent of the long-term
nominal annual return on stocks and 75 percent of the
real annual return, even these figures dramatically
understate the
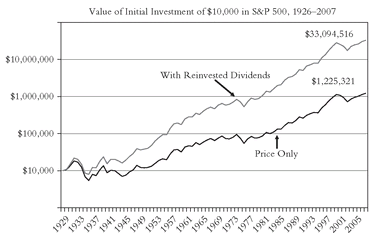
cumulative role played by dividends. Consider this: An investment of $10,000 in the S&P 500 index
156 at its 1926 inception (
Figure 16.1) with all dividends reinvested, would by the end of September 2007 have grown to $33,100,000 (10.4% compounded). If dividends had
not been reinvested, the value of that investment would have been $1,200,000 (6.1% compounded)—an amazing gap of $32 million. Over the past 81 years, then, reinvested dividend income accounted for approximately 95 percent of the compounded long-term return earned by the companies in the S&P 500.
These stunning figures would seem to demand that mutual funds highlight the importance of dividend income. But in this era of “total return,” income is virtually ignored. Why? Because dividend income plays a remarkably small role in equity fund returns. Today, in fact, the average domestic stock fund is offering a dividend yield of just 0.4 percent. Where did all the income go? It was slashed by fund expenses. The expense ratio of domestic stock funds averages 1.4 percent, reducing the funds’ gross dividend yield of 1.8 percent to 0.4 percent. Unsurprisingly, then, it appears that the average stock fund earns the stock market’s present dividend yield of 1.8 percent and then consumes fully 80 percent of that yield in fees and expenses.
It didn’t need to be that way. When I began my research on this industry in 1950 for my Princeton University thesis, an interesting fact came to my attention. The first mutual fund—Massachusetts Investors Trust, founded in 1924—calculated its expenses, not on the basis of a percentage of assets, but as a percentage of its investment income. During its first 25 years, MIT charged investors the then-standard trustee fee of 5 percent of income.
Throughout that quarter-century, MIT was the nation’s largest mutual fund, and its growth was substantial. By 1950, its assets had grown to $362 million. The dividend income on its investments grew commensurately, and the 5 percent charge against income was soon producing far too much money for the fund’s trustees to accept. (Imagine
that!) So they promptly reduced the annual fee to 2.9 percent of income.
157 Since dividend yields were then relatively high (MIT’s stocks were yielding about 5.5%), the net dividend yield received by MIT’s shareholders was 5.3 percent. (For the record, measured against fund assets, MIT’s expense ratio was 0.33%.)
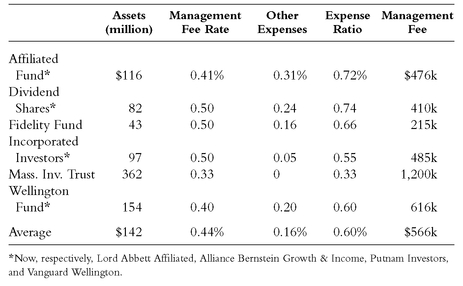
For reasons lost in history, few of the mutual funds organized in the years after MIT began followed the pioneer’s precedent. Instead they chose to set their management fees as a percentage of net assets rather than as a percentage of investment income. The typical annual charge was set at 0.5 percent of assets, typically scaled down to 3/8 of 1 percent on fund assets in excess of $100 million.
158 Modest fee structures, then, for an industry then managing modest amounts of assets.
A 1950 snapshot of that tiny mutual fund industry (
Table 16.1) shows both management fees and total expenses at a reasonably low level, along with a recognition by fund managers that, as their funds grew large (then, “large” meant more than $100 million in assets!), fund investors were entitled to share in the substantial economies of scale that accompany asset growth (i.e., that it cost little more to manage $200 million in assets than it did to manage $100 million).
But a funny thing happened on the way to 2006. Those old values seemed to vanish. Remarkably, each of those six industry pioneers still exists, but, with a single exception, the idea of sharing substantial economies of scale with shareholders has gone up in smoke. (By 1969, alas, even MIT had abandoned its dividend-based fee rate in favor of the conventional asset-based fee rate. Its expense ratio subsequently more than tripled, from 0.33% to 1.09%.) Amazingly, despite the truly staggering growth in total fund assets, expenses have grown at an even faster rate, resulting in expense ratios that have actually increased.
For five of these six funds, more and more of that priceless component of investment return known as dividend income was consumed by costs (
Table 16.2) from 10 percent of income in 1950 to nearly 60 percent in 2006. Even as assets have increased nearly 60 times over, from $770 million to $42 billion, their expenses have increased even faster—more than 100 times over, from $3.4 million to $395 million. Result: Expense ratios have nearly doubled, from 0.57 percent to 1.0 percent. This evidence totally contradicts the consistent stand of the industry, articulated over and over again at the annual membership meetings of the Investment Company Institute, that “the interests of mutual fund managers are directly aligned with the interests of mutual fund shareholders.” It’s just not so.
TABLE 16.2 GROWTH IN ASSETS AND EXPENSES, 1950-2006
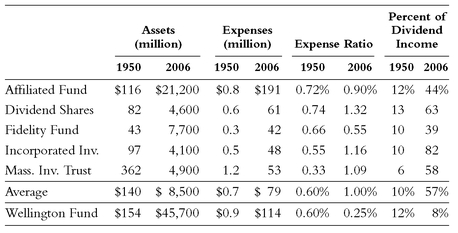
But there is a case—just one, and one with which I am wellfamiliar—in which the ICI was right. That fund’s assets also soared—from $154 million to $46 billion. But while its expenses leaped from $924,000 to $114 million, the expense ratio actually
declined by 60 percent, from 0.60 percent of assets to 0.25 percent. Most importantly, after absorbing 12.5 percent of income in 1951, Wellington Fund’s costs actually absorbed even less of the fund’s income—8.0 percent—in 2006. I attribute this obvious success largely to the facts that (1) the Fund is a unit of Vanguard, a unique
mutual mutual fund group owned by its fund shareholders, and is operated on an “at-cost” basis; and (2) in the 1980s and 1990s, we vigorously renegotiated the advisory fee scale with our external adviser, demanding that our fund’s owners share in the economies of scale. (Today, the annual advisory fee we pay to Wellington Management Company comes to just

of 1% of assets—a measly three basis points.)
And now, a dream: Suppose now that industry practice had followed MIT’s early lead, pegging management fees to 5 percent of investment income rather than to fund assets. Further suppose that no economies of scale—none—were shared with fund shareholders, and that the 5 percent fee remained unchanged. On that basis, equity fund expenses last year would have totaled just $5.7 billion, compared to the actual total of $56 billion, a huge potential annual “dividend” of $50.3 billion to fund shareholders. Well, I can dream can’t I? But in any event, it’s high time that we require mutual funds to disclose to investors and prospective investors the amount of their dividend income that is consumed by costs, and its impact on the fund’s long-term returns.
Bond Funds
Now a brief word about bond fund expenses. While in bond funds the consumption of income by expenses is lower, the impact on long-term returns is higher (
Table 16.3). The average bond fund is presently earning a gross yield of about 5 percent, but after the average expense ratio of 1.0 percent, the net yield averages 4.0 percent. In all, bond fund expense ratios, on average, are consuming about 20 percent of the interest payments the funds receive. (Here, I’ve ignored the impact of sales loads and transaction costs.)
TABLE 16.3 BOND FUNDS: CURRENT YIELDS AND EXPENSES
| Year-End 1996 Yield | 10-Year Annual Return Through 2006 |
| Intermediate-Term |
| Corporate | 6.2% | 5.2% |
| Municipal | 4.7 | 4.3 |
| Treasury | 6.2 | 4.9 |
| Long-Term |
| Corporate | 6.9% | 6.1% |
| Municipal | 5.1 | 4.4 |
| Treasury | 6.1 | 6.9 |
| Note: Yields and returns exclude impact of sales charges. |
But income takes on a special importance in the case of bonds. Why? Because the income yield on a bond fund at the point of purchase establishes the parameters of its future return.
159 Said straight out, today’s yield on a bond fund is an excellent proxy for its total return in the subsequent decade. For example, the initial interest rate on a 10-year U.S. Treasury bond has had a correlation of a mere 0.91 with its returns over the subsequent 10 years (1.00 is perfect correlation).
This cause-and-effect proposition among bond mutual funds is demonstrable.
Table 16.4 compares the yield of various types of bond funds as of December 31, 1996, with their returns during the following decade, ended December 31, 2006. On average, the actual yield of 5.9 percent a decade ago resulted in a total annual return averaging 5.2 percent per year. (That gap reflects those other bond fund costs coming into play.)
TABLE 16.5 RELATIONSHIP BETWEEN EXPENSES AND RETURNS
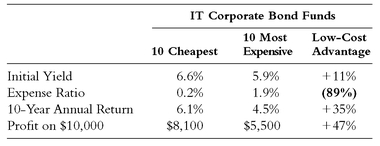
If investors were more aware of this relationship, surely they’d seek out the lowest-cost—and, therefore, generally highest-yielding—bond funds. For example,
Table 16.5 shows the returns earned by today’s 10 lowest-cost intermediate-term corporate bond funds—expense ratios averaging 20 basis points—and the 10 highest-cost funds—expense ratios averaging an amazing 190 basis points—their yields a decade ago, and their returns over the subsequent 10 years. The low-cost group provided an enhancement of fully 35 percent to the investor’s annual return, and a compounded enhancement of almost 50 percent, with zero increase in risk.
Investors are largely unaware of these clear relationships between bond fund costs and yields, and between today’s net yield and tomorrow’s total return. Expenses are the principal determinant of relative yields, and yields are highly predictive of future returns. But as a group, bond fund managers are unwilling to reduce their fees to enhance the returns earned by their shareholders. Since I don’t see how regulation can solve this problem, it’s high time that bond funds, too, be required to put their prospective investors on notice by disclosing these relationships. As in the case of stock fund costs, failure to disclose could hardly be said to represent “fair dealing with investors.”
Fund Returns versus Shareholder Returns
I now turn to the issue of the returns actually earned by fund shareholders. When we were an industry that sold what we made, those returns closely paralleled the returns reported by the funds themselves. But when we became an industry that focused on making what would sell, those two returns sharply diverged, with great detriment to fund shareholders. This departure began in the “Go-Go” era of the mid-1960s, when we created scores of risky funds, seeking high returns by rapid trading, investing in small and often risky companies, and following new “investment concepts.”
Many of these funds reported past returns that were achieved by dubious means, including buying “letter stocks” from insiders at substantial price discounts and marking up their prices to the higher market price. The investment records of many of these “incubation funds” that were later taken public were little short of fraudulent. These funds were “hot,” the money flowed in, and then they turned cold. Fund investors paid a high price for our folly.
In the recent era, while the conditions were different, the outcome was the same. In the late 1990s, fund investors again paid a high price for our focus on the promise of the technology-driven Information Age, and on the promised land of the Great Bull Market. The price they paid can be measured by the errors that fund investors made in the timing of their fund purchases and the selection of the funds they chose.
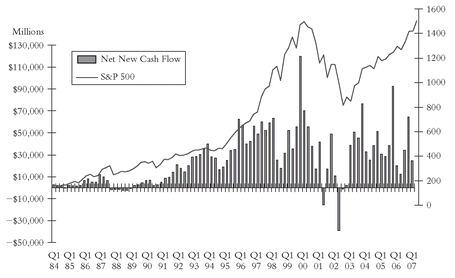
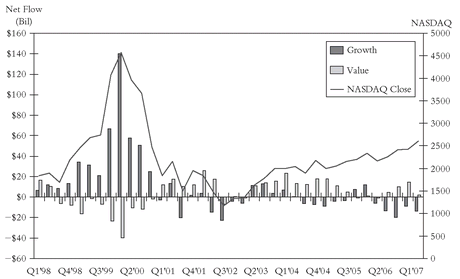
The next two figures reflect those destructive patterns. The
timing penalty (
Figure 16.2) was evidenced by the fact that fund investors placed little money into equity funds during the cheap markets of the late 1980s and early 1990s (less than $10 billion per year), but invested more than $500 billion at the peak market levels of 1998—2000.
The
selection penalty (
Figure 16.3) made a bad situation worse. Investors poured the lion’s share of that $500 billion into those “New Economy” growth funds, technology funds, telecommunication funds, and even Internet funds. It was these funds that led the market upward, and then led the market downward, with late-to-the-party fund investors paying an awful price. Ironically, at the height of the bubble, investors were actually liquidating their stodgy old value funds, which would provide excellent downside protection during the bear market that followed.
We are only now beginning to calculate the devastation that these two patterns dealt to the wealth of mutual fund investors. But the data showing investor returns—resisted by the industry ever since I first mentioned it in a speech to the financial writers in Chicago 11 years ago—can no longer be hidden. We can now readily compare the returns earned by the fund itself—as reported in its shareholder reports and prospectus—to the returns actually earned by its investors. The technical distinction is between time-weighted and dollar-weighted (or asset-weighted) returns. The results are not pretty.
FIGURE 16.2 TIMING PENALTY: EQUITY FUND CASH FLOW FOLLOWS STOCK MARKET RETURNS
FIGURE 16.3 SELECTION PENALTY: EQUITY FUND SECTOR SELECTION FOLLOWS SECTOR RETURNS
SOURCE: Strategic Insight.
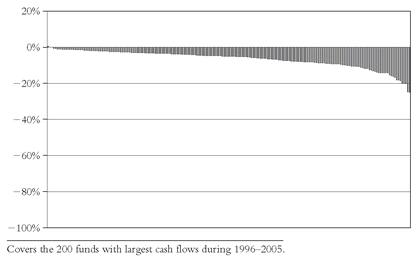
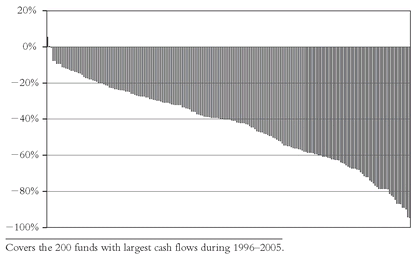
Begin with the fact that during the 25-year period 1980-2005, when the S&P 500 index rose at a 12.3 percent annual rate, the return of the average fund averaged 10.0 percent annually, or 2.3 percentage points less. But the returns earned by fund investors fell far short of that 10.0 percent return. We can’t be sure of exactly how far short, but an analysis of the past decade suggests that the gap was huge (
Figure 16.4). For example, the 200 funds with the largest cash inflows during the 5-year period 1996-2000—essentially the duration of late, great bull market—reported an average return of 8.9 percent for the 10 years 1996-2005. But the
dollar-weighted returns of those 200 funds—the returns actually earned by their
shareholders—was just 2.4 percent, only 25 percent of the annual return reported by the fund themselves.
FIGURE 16.4 GAP BETWEEN ANNUAL TIME-WEIGHTED AND DOLLAR-WEIGHTED RETURNS, 1996-2005
The consistency of this pattern is remarkable. Among those 200 funds, the shareholders of 198 funds actually earned
less money than the funds reported. In only two cases did the shareholders do better: in the best case, by just 0.5 percent per year (50 basis points); in the other case, by a minuscule five basis points per year. When we compound these shortfalls, the results are little short of astounding (
Figure 16.5). For fully 76 of the 200 funds, that cumulative shortfall ranged from
minus 50 to
minus 95 percentage points(!).
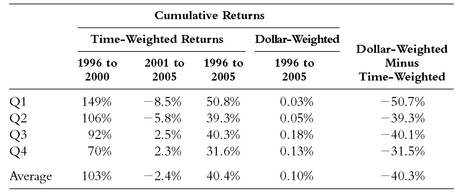
Unsurprisingly, given the marketing ethos of today’s mutual fund business, the funds that reported the highest returns during the bull market experienced the largest gap between fund returns and shareholder returns, and vice versa. The chart in
Table 16.6, showing the relationship between the various quartiles of
reported performance and the actual
shareholder performance, makes it clear that the higher the performance quartile in the bull market, the lower the returns earned by investors. As it might be said in Biblical terms, “and the first (in reported returns) shall be the last (in shareholder returns).”
The fund industry, naturally, argues that it bears little responsibility for this state of affairs. Rather, it is the foolishness of the investing public that is to blame for these disastrous results. But the industry surely bears a heavy responsibility—I would argue, the largest share—for the harm that has been done. Consider these facts:
• It was we in the fund industry who created those new funds that were to create such havoc for investors. As the market soared ever higher, we introduced those 494 brand-new “New Economy” funds. Only a precious few of the major fund marketers had the courage to stand firm against the market madness, and forbear from creating and offering such funds.
• When we had funds whose performance turned “hot,” we marketed them aggressively. Our public relations departments were willing co-conspirators with the press in establishing interviews with our “star” portfolio managers, many of whom, inevitably, turned out to be comets.
• The higher a fund’s performance soared, the more we advertised our returns. Example: In March 2000, the month the market hit its high, there were 44 equity funds that advertised their performance in Money magazine. The average advertised annual return was +86 percent. Imagine! (During the next three years, these funds were to plummet by 39 percent.) Unsurprisingly, after the fall, in the October 2002 issue of Money there were only four funds that did so.
FIGURE 16.5 AMAZING GAP BETWEEN CUMULATIVE TIME-WEIGHTED AND DOLLAR-WEIGHTED RETURNS, 1996-2005
TABLE 16.6 HIGH FUND PERFORMANCE PRODUCES LOW SHAREHOLDER RETURNS
I believe that the mandatory and prominent disclosure of shareholder returns alongside fund returns would alert fund investors to the true returns that managers have actually achieved for their shareholders. Such disclosure, I suspect, would also discourage fund managers—and brokers and financial advisers, too—from following the “fund-of-the-week” syndrome, remind them of the perils of aggressive marketing, and give them some self-discipline regarding the creation and promotion of high-risk funds.
Measuring Shareholder Satisfaction—The Redemption Rate
In the early years of my career at Wellington Management Company, as I recall, I was asked to prepare a brochure, to be entitled “The Wellington Story,” designed to persuade both potential investors and the stockbrokers who in those days sold the fund’s shares that Wellington Fund was a creditable investment. Of course, I included sections about the fund’s remarkable growth; its conservative objectives (it was a balanced fund, investing in both stocks and bonds); its past investment record; and its management depth.
I also created what I called “an index of shareholder satisfaction,” simply calculated by presenting the ratio of the annual dollar amount of the shares of the Fund redeemed to the Fund’s total net assets. The Wellington Fund redemption rate was then less than 4 percent—about half of the industry rate—suggesting an average holding period of 25 years for its shareholders. We believed that we were the industry leader in shareholder satisfaction, and we were determined to emphasize our bragging rights.
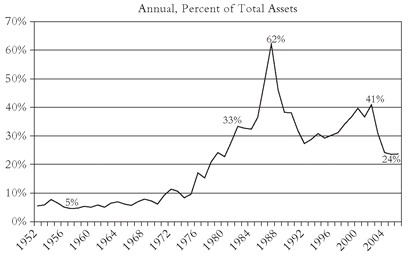
In those days (
Figure 16.6), industry redemption rates were far below today’s levels. Note that the 7 to 8 percent rates that persisted through the 1950s and 1960s didn’t reach 20 percent until the 1980s. Rates soared to 62 percent in the 1987 bear market but then settled down to the 30-40 percent range through 2004, suggesting a remarkably short average holding period of 2.5 to 3 years by fund shareholders.
But it turns out that much of that soaring leap in redemption rates was less about plummeting shareholder satisfaction than about a fraud that was being inflicted on the long-term shareholders of mutual funds. Much of that increase in redemptions, in fact, reflected the growing use of mutual fund shares in “market-timing” programs, largely by substantial investors and hedge funds.
As the years passed, more and more investors became aware of how easy it was to make purchases (or redemptions) of funds after the local markets for the stocks they held had closed. The funds priced their foreign stocks at the closing prices in local markets, which had closed long before the New York Stock Exchange closed at 4 P.M. eastern time. Periodically, opportunities arose to, as it would later be alleged by Attorney General Spitzer, “bet on the horses after the race was over.” The betting, as it were, was widespread. The SEC later identified some 400(!) hedge funds that described their strategy as “mutual fund market timing.”
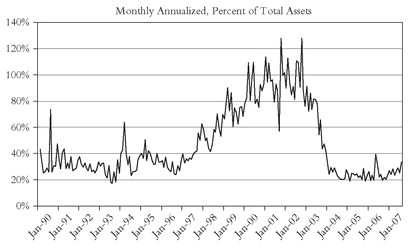
International funds, of course, were the prime victims of what became known as “time-zone trading.” As the chart in
Figure 16.7 shows, the problem goes back at least to the late 1990s, when redemption rates on international funds leaped above the industry-wide rate of 30 to 40 percent. But by 1998, as more investors became aware of the, well, opportunity to engage in this essentially risk-free arbitrage, the international fund redemption rate began to steadily increase. It crossed 60 percent in December 1997, 70 percent in September 1998, 90 percent in March 1999, 100 percent (a one-year holding period) in March 2000, and 110 percent in July 2000, reaching an all-time peak of 128 percent in October 2001 and again in October 2002.
Finally, after the Spitzer revelations in the fall of 2003, the time-zone trading practice began to abate, with redemption rates falling below 30 percent by January 2004. It’s remained in the 25 percent range (with a few upward thrusts) through July 2007, a four-year holding period that, although it seems to me absurdly short, suggests that time-zone trading has been substantially eliminated.
The remarkable fact is that the data showing these extraordinary redemption patterns was not hidden. The amount of redemptions in international funds was published by the industry’s trade association, the Investment Company Institute, in every single one of the 212 months shown in
Figure 16.7. All that remained was to compare those redemptions with the fund’s assets and calculate the rate. Is it possible that the industry and its leaders weren’t aware of what was going on? Only out of inexcusable ignorance of what the business had become, or because it was a good idea, in the interest of building assets in international funds, to turn a blind eye to the disservice it clearly represented to the long-term shareholders of these funds.
But if it was ignorance, it should have been exorcised with the publication of an article in the Financial Analysts Journal of July/August 2003. Written by four NYU professors, it was titled “Stale Prices and Strategies for Trading Mutual Funds.” The authors demonstrated how easy—and how profitable—it was for investors to develop winning strategies. It concluded: “Should mutual funds even worry about trying to prevent these strategies? Because the gains are offset by losses to the other [long-term] shareholders in the funds, the funds have a fiduciary duty to take preventative action. . . . Why [don’t they]? . . . because short-term trading increases assets under management and [increases] management compensation . . . and managers may have the perception that [blocking these strategies] puts the fund at a competitive disadvantage.” In short, taking action to limit trading would hurt fund marketing.
Rather than being alerted to the problem, the industry ignored it. Worse, the only published response to the article came from a senior executive of an industry leader, who condemned the Journal for publishing the article: “Your article raises serious questions about the policies, oversight, and judgment in selecting articles. Publishing [it] is a bad idea in the best of times but is abhorrent in a period when investor confidence is shaken by corporate greed and fraud, bad accounting, and a bear market overall.” That response is a classic “shoot the messenger” reaction. (It was about this time that his firm finally added redemption fees for its international funds, at last curtailing the trading.)
But it wasn’t only managers of international funds who participated in this scandalous conduct. One example: In its 2002 annual report, a U.S. growth fund with assets of $530 million reported, as all funds must, its sales and redemptions: share sales for the year, $3,509,527,000; redemptions, $3,604,272,000. Redemption rate (calculated but not published), 679.2 percent. Average holding period, seven weeks. Is it possible that market timing was going on? You tell me. Tell me, too, where the fund directors were, or for that matter, where the SEC examiners were, or even where the press was.
A sad anecdote: In the spring of 2006, I spoke at the Union League Club of New York, afterward signing copies of my new book, The Battle for the Soul of Capitalism. One person who asked me to sign his book requested that I endorse it to him. When he told me his name, I recognized him as the man who was in charge of the administration of the fund I just described. He told me that he’d only recently been released from prison for allowing the rapid-fire trading to take place, and then trying to hide the evidence. He said he knew it was wrong, but the firm had always done it, and he felt compelled to go along. “Everyone else is doing it” strikes again. There’s a telling message there.
While most of the abuses in market-timing and time-zone trading seem to have been eliminated by the exposure of the practices, by legal actions, and even by the fairly modest financial penalties imposed (and at least that one jail sentence), I conclude that funds should be required to prominently disclose not only the amount of their annual redemptions (as they must today), but their redemption rate as well. Investors would be alerted by high rates—suggesting some combination of shareholder dissatisfaction and excessive market timing—and perhaps encouraged by low rates—suggesting a high level of shareholder satisfaction and a long-term focus among existing fund owners. When I listed Wellington Fund’s modest redemption rates in The Wellington Story all those years ago, that’s precisely what I was trying to accomplish.
What’s to Be Done?
Without full disclosure, it’s hard to imagine that brokers and advisers can measure up to the high standards of commercial honor, equitable principles of trade, and fair dealing with their clients that are demanded by regulatory principles. I’ve already described, in great detail, three of the disclosures that should be mandatory:
1. The amount of investment income consumed by their fees and expenses.
2. The returns actually earned by their shareholders.
3. The annual rates at which their shareholders are redeeming their shares.
But that’s only the beginning: I believe funds should also be required to disclose:
4. Historical returns, not only in nominal terms, but also in real terms, adjusted for rates of inflation. After all, investors saving for retirement ought to be on notice that the kinds of compound returns funds show are not always what they seem. (For the record, a 9% nominal return increases capital by 762% over a quarter-century; at a real rate of 6%, the increase is only 329%—barely 40% of the putative capital accumulation.)
5. The actual dollar amounts of expenses paid by each fund shareholder each year. This need be neither complicated nor precise. Simply calculate the fund’s expense ratio for the year just ended, and multiply it by the dollar value of the shareholder’s investment at year-end. The actual dollars they spend, I believe, are more meaningful than ratios to investors.
6. The total annual costs incurred by fund investors. Not merely the fund’s expense ratio, but its estimated costs of portfolio turnover, and the annual impact of the initial sales charge. While the industry leaves the self-serving impression that a fund’s expense ratio represents the total cost of owning a fund, that is far from the truth. The fact is that often there is sort of a three-legged stool of costs that drag down fund returns. The expense ratio of the average equity fund is 1.4 percent; the average (hidden) cost of portfolio turnover probably runs between 0.5 percent and 1.0 percent; and, for funds with sales changes, the amortized cost of the typical 5 percent load runs to more than 1.0 percent per year. (The average holding period is now about 4.5 years.) So average total all-in costs may reach as much as 3 percent a year or more. Such costs, to state the obvious, constitute a powerful drag on net returns earned by fund investors, magnified manyfold over the long term.
7. I’d also like to see reforms in advertising regulations. Since only funds with exceptional records advertise them (and then only until they turn negative), I’ve come to the conclusion that advertising fund performance is inherently misleading. It should simply not be allowed. (I’d also bar endorsements. Just what could it possibly matter to an investor that Lance Armstrong or Paul McCartney, presumably in return for a healthy fee, is plugging a particular fund family?)
8. We also ought to disallow the publication of records of incubation funds and funds with hypothetical past returns. Full-page ads bragging about back-tested, cost-free, and entirely theoretical returns that allegedly were earned by funds following today’s “fundamental indexing” fad—now appearing in all their full-page glory—are simply improper, inappropriate, and materially misleading. The practice must be stopped.
The “Statement of Policy”
Time does not permit me to go into more detail with my litany of reforms designed to assure that fund investors get the straightforward information to which they are entitled, and are protected from deceptive information that can only mislead them. So let me conclude with a constructive suggestion: my recommendation that FINRA adopt a new “Statement of Policy” regarding the sales and sales literature published by fund sponsors, stockbrokers, and financial advisers.
Hardly anyone in this business today remembers (although I do!) that from 1950 until 1969, mutual funds operated under a fairly rigorous code of standards for advertising and sales literature. It was called the “Statement of Policy,” and was administered by the NASD. Under the SOP, it was deemed “materially misleading” to, among other things, combine into a single figure dividends for investment income and distributions from any other source; to present charts showing results of initial investments that include dividend reinvestments; to present charts or tables that do not provide adequate and accurate disclosure of material facts; to make extravagant claims regarding management ability or competency; or to compare a fund’s record with any other fund or market index without pointing out the material differences or similarities between the subjects of the comparison.
The SOP, however, proved unduly restrictive, prohibiting, for example, the publication of a fund’s total annual return. (Ironically, total return has become the universal metric for today’s industry.) It also required levels of detail that obscured the clear presentation of returns that included dividend reinvestment. Nonetheless, if we are to protect investors without burdensome regulation, we must educate them in the sunlight of full disclosure. Exactly how to do this, I do not know, for it involves shareholder reports, sales literature, and prospectuses, each of which operates in a different regulatory framework. But if there is a will, I’m sure there’ll be a way.
But don’t count on support from the mutual fund industry or the brokerage industry, nor likely from most financial advisers. Should the strong message of these remarks reach the press and public, I can already hear the Investment Company Institute saying, “More disclosure? It will just confuse investors. They already have too much information.” There is, of course, some truth in that allegation. Most investors don’t know about, or don’t use—or perhaps don’t even understand—the abundant information they have today. But publishing the important data to which I urge giving attention today—even on each fund’s web site—would cost essentially nothing. And even if only a single investor were to benefit—and I believe that ultimately millions of investors will benefit—the cost-benefit ratio would be, well, infinite.
A Retrospective View, and a Look Ahead
What’s more, as I noted at the outset, the past half-century has been one in which a beautifully simple concept—owning a broadly diversified list of investment-grade stocks (and/or bonds) at low cost, investing for the long-term rather than speculating for the short-term, designed for fund investors who buy and hold for the long-term—has become a complex, expensive, confusing exercise in, to a greater or lesser degree, speculation, giving rise to a huge depletion of wealth for the 100 million American families who own mutual funds.
In that half-century period, we—at least, too many of us—have tried lots of clever, faddish ways to gather more assets from the investing public: option-income funds, “government-plus” funds, short-term global funds, adjustable-rate preferred-stock funds, to say nothing of funds investing in “sin” stocks, and so on. Nearly all of them have come and gone, and fund failures have now risen to an annual rate of about 5 percent. Not bad? Only until you realize that at that rate, a decade hence, fully one-half of today’s 4,700 equity funds will be gone—consigned to the dustbin of history.
Yet, I regret to say, the trend toward specialization in mutual funds is not abating. It is actually increasing. In most industries, innovation is an unvarnished asset, but in the fund industry it has proved to be an asset to fund managers but a liability to fund investors. (Remember those sadly deficient returns that fund investors have earned over the past decade.)
Some innovation, of course, has been positive. I think few would disagree that the Vanguard experiment in mutual fund governance; our creation of the first index mutual fund, the first series of defined-maturity bond funds, and the first series of tax-managed funds; our focus on low costs—not only in expense ratios, but also in eliminating sales charges, and minimizing portfolio turnover costs—have created substantial shareholder value. And surely target-date retirement funds and asset-allocation funds, properly used, also offer substantial potential benefits to investors.
But the new wave of innovation is something else again. I’ve long made my position clear that exchange-traded funds (ETFs)—index funds that one can trade “all day long, in real time” (as the advertisement says), and overwhelmingly focused on narrow, even minuscule, sectors of the market—are likely to do investors more harm than good. The stolid, simple, classic old index funds—that have, in fact, worked brilliantly—are also being challenged by new funds purporting to be “better” index funds, but in fact are pursuing active investment strategies.
Variable annuities are another problem. The original TIAA-CREF annuity was a truly great creation, and with costs that are so low as to barely be believed, deservedly leads the field to this day. But, with rare exceptions, its successors have piled on costs that are totally unacceptable (to investors, although hardly to salesmen). Equity-linked annuities, where downside protection is provided—at a grossly excessive cost—are but one more way to escape NASD regulations on the technicality that they are actually (exempt) insured products, not securities subject to federal oversight. A BusinessWeek article describes them as “a sucker’s game dressed up to look like a free lunch.” I hope the SEC will demand the investor protection and disclosure that is clearly required.
What’s more, we now have 130/30 funds (or 120/20 funds), whose respective ratios speak to the fund’s long and short positions, our sad attempt to challenge the hedge fund industry. When I see these kinds of innovations, I say, “Watch out!” Also on the drawing board are funds that make automatic monthly payouts directly from capital—which I pray will include a “worst-case” disclosure—and funds offering “growth and guaranteed income.” Where this innovation will end, knows God. But my long experience tells me that many, perhaps even all, of today’s innovations will end badly for investors.
For we know that complexity is usually associated with higher—and often hidden—costs, and with higher—and usually undisclosed—risks. As these “new products” (as we are wont to call them) proliferate, the new Statement of Policy I propose must have the flexibility to deal with them. Again to be clear, not by regulating them (though I’m not at all sure that might not be a good idea), but by requiring the full and fair disclosure of all relevant information, and with “CAVEAT EMPTOR” written on every page.
All of this will require sensitive, objective handling by our regulators, I hope relying on the concept of “principles-based” regulation. Given the unforeseen nature of what may come along, that reliance on judgment is every bit as important as the process we put in place to require full and fair disclosure. So, to you at FINRA, I say, using the principle I regularly commended to our crew when I ran Vanguard, “Let’s always keep FINRA a place where judgment has at least a fighting chance to triumph over process.”
I close by expressing again my admiration for our industry’s regulators and enforcement officers. You are doing the Lord’s work, and I heartily endorse, yet again, your mission of investor protection, buttressed by the need for investor education that I’ve emphasized today. Much of your work involves crooks and charlatans. But there are few, if any, of either in the fund business today. Our problem is more subtle: We believe unfailingly in our mission, in our competence, and in our integrity, without ever standing back and asking exactly what have we wrought in changing our traditional values of stewardship into a new set of values focused on asset gathering and marketing. That’s the vital issue that I’ve put on the table today.
This dichotomy poses a major challenge to our system of regulation and enforcement. In my Battle book, I quote James Madison: “If men were angels, no government would be necessary.” Using a similar formulation, I’d suggest that “If fund managers, and stockbrokers, and financial advisers were angels, no regulators would be necessary.” As far as I know, however, this industry has no angels. So we need our regulators—who have served us so well ever since the enactments of the Securities Acts of 1933 and 1934—to demand the kind of full disclosure I’ve described, helping to assure that mutual fund and fund distributors operate under “high standards of commercial honor, just and equitable principles of trade, and fair dealing” with the investors of America.
 2 trillion of fund assets, almost 30 percent of the total—in aiding and abetting illicit market-timing schemes. Or the number of leading brokerage firms engaged in “breakpoint” frauds in which excessive sales loads were imposed on investors. Or having one of the bluest of the industry’s blue-chip firms—one of the three largest firms in our field—violate NASD rules by allocating brokerage commissions as a quid pro quo to brokers that sold the shares of its funds. What’s more, according to the NASD decision, the firm’s executives were duplicitous on the witness stand. (The actual word was “disingenuous.”) While the examiner recommended a $100 million fine, it was reduced to $5 million on the grounds that the illicit practice was rife in the industry (i.e., “Everyone else was doing it, so I can too”).

 of 1% of assets—a measly three basis points.)
