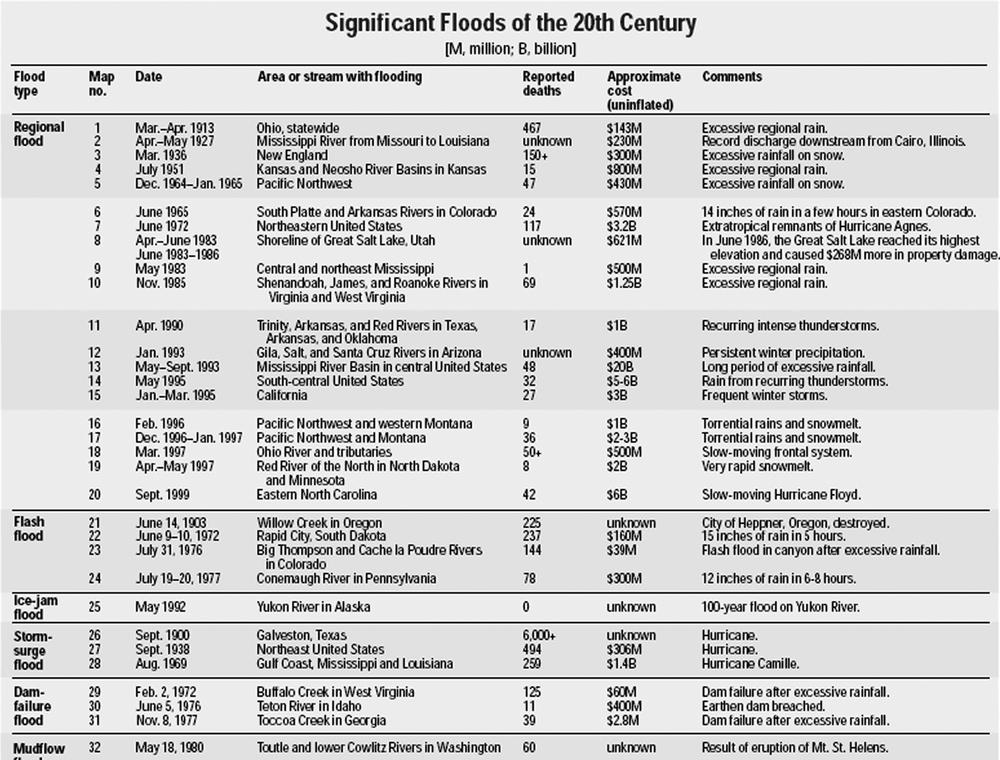
A complex data table has at least one heading that spans multiple rows or columns. The table shown in Figure 6-2 (which was taken from http://ks.water.usgs.gov/Kansas/pubs/fact-sheets/fs.024-00.pdf) is a complex table because it has both row and column headings and several of the row headings span multiple rows. For example, “Flash Flood” applies to four rows—map numbers 21–24.
A well-written summary can provide a verbal map that helps someone using a screen reader navigate the data more efficiently:
<table summary=" The table is divided into six columns:  Map number,
Date,  Area or stream with flooding, Reported deaths, Approximate costs
 (uninflated), and Comments.  The rows are grouped by flood types into six
 subcategories:  Regional flood, Flash flood, Ice-jam flood, Storm-surge
flood, Dam-failure flood, and Mudflow flood.  ">
 ...
The preceding code summarizes the table with the following information:
The number and titles of the column headings
The stubhead (“The rows are...”) and subheadings
Key information
Most screen readers will announce the number of columns and rows
upon entering a table. The summary
attribute allows you to provide information about how to read the
table—information that could be useful to anyone not familiar with the
data you are presenting.
Note
Always try to avoid using the same text in both the caption and the summary.
In a complex data table, it isn’t always programmatically obvious
which headings apply to which cells. We can use the id and headers attributes to explicitly list all of
the headings that apply to each data cell. First, assign each heading
cell an id. Then, list the
appropriate ids in the headers attribute of each data cell:
    <tr>
      <th id="type">Flood Type</th>
      <th id="map">Map no.</th>
      <th id="date">Date</th>
      <th id="area">Area or stream with flooding</th>
      <th id="deaths">Reported deaths</th>
      <th id="cost">Approximate cost (uninflated)</th>
      <th id="comments">Comments</th>
    </tr>
    <tr>
      <td rowspan="5" id="regional">Regional flood</td>
      <td headers="regional map">1</td>
      <td headers="regional date">Mar.-Apr. 1913</td>
      <td headers="regional area">Ohio, statewide</td>
      <td headers="regional deaths">467</td>
      <td headers="regional cost">$143M</td>
      <td headers="regional comments">Excessive regional rain.</td>
    </tr>
Depending on the screen reader and how it has been configured, the heading information will either be read all the time or only when it is “new.” For example, someone may prefer to listen to column headings only when columns change—when reading horizontally across a row. Row and column numbers may or may not be read as well. Here are a few ways the cell “Ohio, statewide” may be read:
Area with stream or flooding, Regional flood, Ohio, statewide
Area with stream or flooding, Regional flood, Ohio, statewide
Row 2, column 4, Area with stream or flooding, Ohio, statewide
Regional flood, Ohio, statewide
You can combine techniques such that the rows with rowspan use the headers attribute and row
headings that don’t span multiple rows only use the th element. For example, the following is the
markup for the last row of the table for which there is only one entry
(one row). Thus, there is no rowspan,
no id, and no headers. However, since “Mudflow flood” is
both data and a row heading, it is marked with a td (rather than th). To indicate that it is a heading and to
clarify that it applies to the row, the scope is set to “row.”
  <tr>
      <td scope="row">Mudflow flood</td>
      <td>32</td>
      <td>May 18, 1980</td>
      <td>Toutle and lower Cowlitz Rivers in Washington</td>
      <td>60</td>
      <td>unknown</td>
      <td>Result of eruption of Mt. St. Helens.</td>
</tr>A second approach, yet less consistently supported by assistive
technologies, is to group related rows and associate a heading with
the scope attribute. It is more elegant, and we
hope it gains support in the future.
This technique uses the rowspan and scope attributes. rowspan is used to indicate how many rows a
heading applies to, while scope indicates that the
heading applies to the row.
<tr>
      <th rowspan="5" scope="row">Regional flood</th>
      <td>1</td>
      <td>Mar.-Apr. 1913</td>
      <td>Ohio, statewide</td>
      <td>467</td>
      <td>$143M</td>
      <td>Excessive regional rain.</td>
    </tr>
    <tr>
      <td>2</td>
      <td>Apr.-May 1927</td>
      <td>Mississippi River from Missouri to Louisiana</td>
      <td>unknown</td>
      <td>$230M</td>
      <td>Record discharge downstream from Cairo, Illinois.</td>
    </tr>
    <tr>
      <td>3</td>
      <td>Mar. 1936</td>
      <td>New England</td>
      <td>150+</td>
      <td>$300M</td>
      <td>Excessive rainfall on snow.</td>
    </tr>
    <tr>
      <td>4</td>
      <td>July 1951</td>
      <td>Kansas and Neosho River Basins in Kansas</td>
      <td>15</td>
      <td>$800M</td>
      <td>Excessive regional rain.</td>
    </tr>
    <tr>
      <td>5</td>
      <td>Dec. 1964 - Jan. 1965</td>
      <td>Pacific Northwest</td>
      <td>47</td>
      <td>$430M</td>
      <td>Excessive rainfall on snow.</td>
    </tr>