Chapter 7
Jet Aircraft Applied Performance
The aircraft performance items that we discussed in Chapter 6 were for one weight, clean configuration, and sea level standard day conditions. In this chapter we alter these conditions and examine the resulting performance, specifically as weight, configuration, and altitude are changed. To simplify the explanation, only one condition will be altered at a time.
VARIATIONS IN THE THRUST‐REQUIRED CURVE
The basic thrust‐required curve for the T‐38 (Fig. 6.4) was drawn for a 10,000‐lb airplane in the clean configuration, at sea level on a standard day. We now show how the curve changes for variations in weight, configuration, and altitude.
Weight Changes
Changing the weight of an aircraft changes the induced drag much more than the parasite drag. As weight changes, the lift must change accordingly, thus drag (induced) due to lift must be factored. The only change in the parasite drag is caused by small changes in equivalent parasite area,  , at varying angles of attack. Only changes in induced drag are considered in Fig. 7.1.
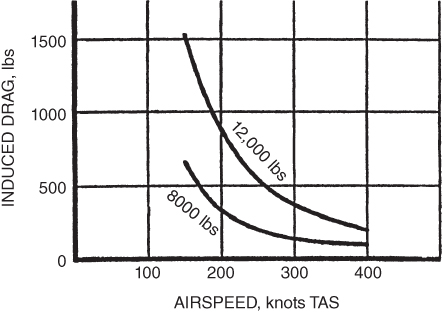
Figure 7.1 Effect of weight change on induced drag.
If the weight is increased, the lift required increases, so total drag increases due to the increase of induced drag (parasite drag remains the same for our discussion). The intersection of the induced drag and the parasite drag curves still marks the point of  , but it is moved up and to the right. In fact, all points on the thrust‐required curve are moved up and to the right. Because induced drag is greater than parasite drag in the low‐speed region of flight, the curve is moved by a greater amount in the low‐speed region than in the high‐speed region.
The total drag curves are shown as the thrust‐required curves in Fig. 7.2. Both of the curves were obtained by altering the basic  curve for the 10,000‐lb T‐38 (Fig. 6.4). First the airspeed for each point on the curve was corrected using Eq. 4.3. Second, the drag was corrected by using the fact that the value of
  is not changed by weight. This was discussed previously when this statement was made: “Note that the value of
  and the angle of attack at which it occurs do not vary with aircraft weight or altitude.”
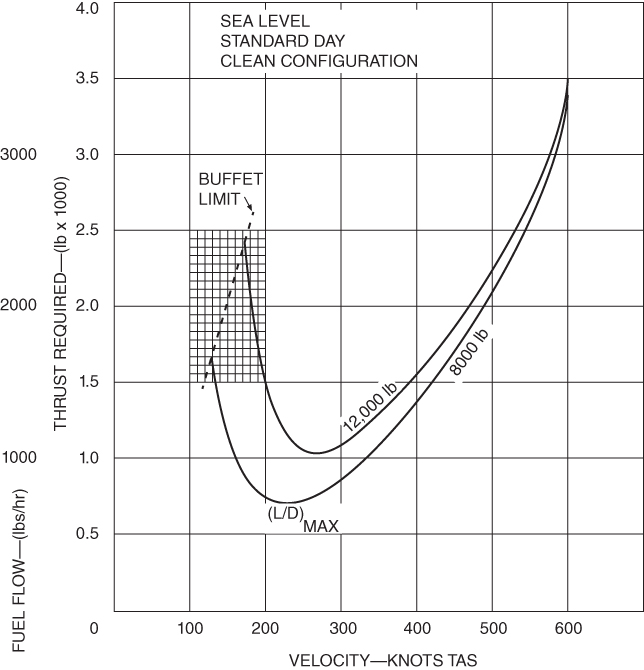
Figure 7.2 Effect of weight change on the  curve.
Not only does  not vary, but other
  values do not vary either. They are functions of AOA only. So, if
  does not vary with weight, then changing the weight changes the drag proportionately and

Under  flight
  , so
, so

Figure 7.2 was drawn by altering Fig. 6.4 for different weights. The airspeeds were changed using Eq. 4.3 and the corresponding drags,  , were changed using Eq. 7.1. Later in this chapter we discuss how the pilot must use this curve to obtain maximum performance from the aircraft as the weight changes.
Configuration Changes
When a pilot lowers the landing gear (and/or flaps), the equivalent parasite area is greatly increased. This increases the parasite drag of the aircraft, as shown in Fig. 7.3, but it has little effect on the induced drag. The effect on the thrust‐required curve is to move it upward and to the left. The amount that the curve moves is not easily calculated. The equivalent parasite area must be known for the aircraft in the dirty configuration, and the new parasite drag values must be calculated. The  curve can then be found by adding the new curve values to the old
  curve values and plotting.
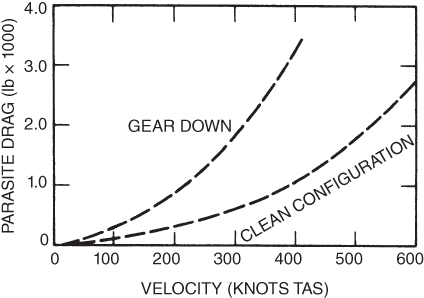
Figure 7.3 Effect of configuration on parasite drag.
The thrust‐required curves for several configurations of the T‐38 are shown in Fig. 7.4. In discussing the effect of weight change we saw that the values of  remained constant at the same AOA. The value of
  does not change as weight varies, but it does change as the configuration changes. For the clean configuration, the value of
  in Fig. 7.4 is 12.05
  thus 10,000 lb/830 lb). In the full flaps and gear configuration it is only
  thus 10,000 lb/2,350 lb).
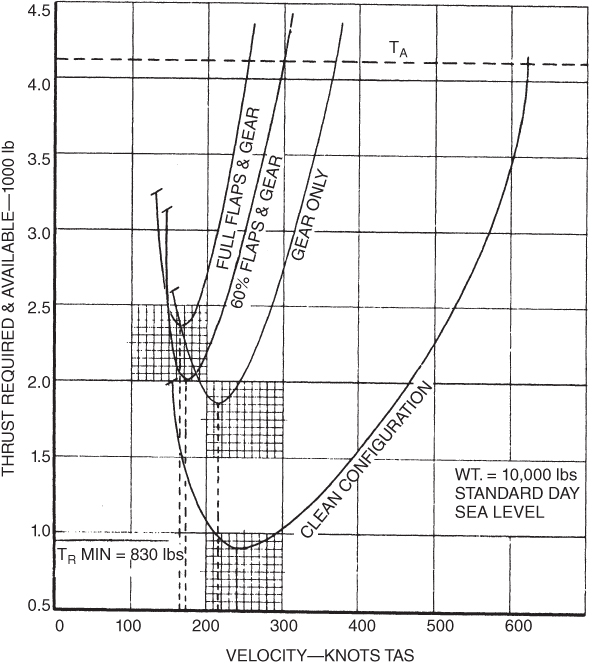
Figure 7.4 Effect of configuration on the  curve.
Altitude Changes
Drag on an airplane depends on the dynamic pressure (q):

At any given AOA, the value of the drag coefficient,  , is a constant and the wing area,
  , is also a constant. Therefore, the drag will also be a constant if the dynamic pressure is a constant. If we plotted drag versus equivalent airspeed, there would be only one drag curve for all altitudes. We could say that “drag at altitude equals drag at sea level,” but we would have to qualify that statement by adding “at the same equivalent airspeed,” which is a function of sigma (density ratio). Because the curves are drawn for true airspeed, different curves must be drawn for each altitude. If the drag does not change but the true airspeed at which it occurs changes, the only correction we must make is one for airspeed:

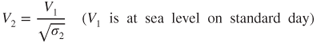
The curves in Fig. 7.5 show that the minimum thrust required is 830 lb for both altitudes. Of course, this means that the value of  is not changed by altitude. The true air speed for minimum drag does change as shown in Eq. 7.2. If
  is at sea level, where
  , and Eq. 7.2 is rewritten, then

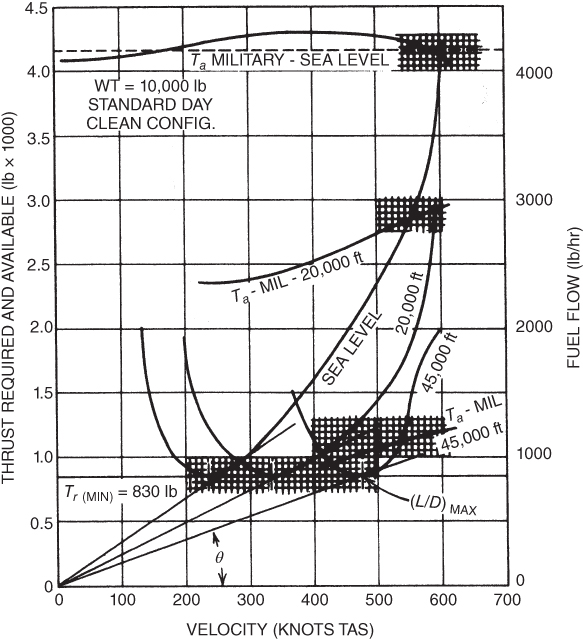
Figure 7.5 Effect of altitude on  and
and  , curves.
In addition to the  changes shown in Fig. 7.5, we must also change the
  at 20,000 ft. This is done in accordance with Fig. 6.9 as
  decreases with altitude. As
  decreases with respective increase in altitude,
  increases.
VARIATIONS OF AIRCRAFT PERFORMANCE
Straight and Level Flight
Weight Change
Increase in weight means an increase in total drag due to the increase in induced drag, but  is not changed, so
  is decreased due to the change in intersection of the
  and
and  curves. A weight decrease will reduce the drag and the
  intersection
  will be at a higher airspeed.
Configuration Change
 is usually limited by the structural strength of landing gear and flaps; therefore,
  is reduced by a dirty configuration. Even if structural integrity was not a factor, due to the increase in total drag due to increased parasite drag,
  would be lowered.
Altitude Change
 true airspeed is only slightly changed by altitude. The
  curve moves to the right with an increase in altitude and the
  decreases.
  EAS will be less at altitude as
  decreases.
Climb Performance
Angle of Climb
Weight Change
Increased weight means increased drag, while  is not changed. The
  term in Eq. 6.5b is reduced and a lower angle of climb results. When weight is reduced the opposite occurs and climb angle is increased as
  is increased.
Configuration Change
Drag increases when gear and flaps are lowered, so a smaller angle of climb results as Ta remains the same but  is increased. In order to maximize climb angle after takeoff or during a missed approach, retract the gear as soon as practical and retract the flaps as required.
Altitude Increase
Thrust available decreases with increase in altitude and drag remains the same, so  , or
, or  , is smaller and angle of climb is smaller at altitude. When an aircraft's
  at “altitude,” the aircraft has reached absolute altitude.
Rate of Climb
Weight Change
Rate of climb is the velocity times the sine of the climb angle. As we saw above the  term reduces with a weight increase and the extra drag also slows the aircraft, so ROC is reduced with increased weight and increased with decreased weight.
Configuration Change
A dirty aircraft reduces climb performance. The aircraft should be cleaned up, as soon as practical. As above,  remains the same but
  is increased with gear and flaps deployed. In order to maximize ROC after takeoff or during a missed approach, retract the gear as soon as practical and retract the flaps as required.
Altitude Increase
 (drag) does not change with an increase in altitude but
  is decreased, thus
  is reduced. The true airspeed velocity increases with altitude. The product of the two terms, however, decreases. When the
  reduces to the point where it is tangent to the
  curve, the absolute ceiling is reached and the ROC is zero.
Endurance
Weight Change
More drag is developed with increased weight, so more fuel is consumed to compensate for the increased thrust that opposes drag. Fuel flow is proportional to  (drag), so endurance is reduced, and vice versa.
Configuration Change
If the gear and flaps are deployed, parasite drag has increased, so total drag has increased (induced drag remains the same for this discussion). Fuel consumption will increase to compensate for the increased  , so endurance is reduced. When holding in an aircraft, keep the gear retracted, flaps as required, and maintain best holding airspeed to maximize endurance. If gear or flaps cannot be retracted, slow down to reduce parasite drag.
Altitude Increase
This is the same, but fuel flow is less with altitude so endurance is improved. A word of caution: You may burn more fuel climbing to a higher altitude than if you had remained at the lower altitude.
Specific Range
Weight Change
As fuel is burned, weight is reduced, and all points on the thrust‐required curve moves downward and to the left (Fig. 7.6). The tangent lines indicate velocity for SRmax. Two important changes in the flight schedule must be made by the pilot as weight decreases if maximum range is to be obtained: The thrust and the airspeed of the aircraft must be reduced. However, a reduction in throttle will result in a reduction of thrust available, which will automatically lower the airspeed. The natural tendency of a pilot to keep the throttle setting the same as weight is reduced, allowing the airspeed to increase, this tendency must be suppressed. As we have seen, when weight decreases the  curve moves down and to the left, so the maximum speed for fuel flow also changes. For maximum range, as fuel is burned, reduce airspeed.
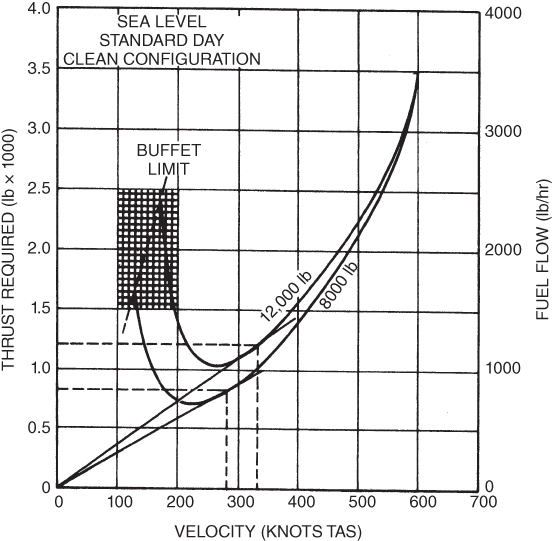
Figure 7.6 Effect of weight change on specific range.
Configuration Change
If it is necessary to fly in the dirty configuration, slow the airplane to the new tangent point to reduce parasite drag.
Altitude Increase
There are several advantages in flying jet aircraft at altitude:
- Up to the tropopause, the lowering of temperature increases engine efficiency (slightly above the tropopause temperature increases as does
 ). This was discussed earlier in our study of specific fuel consumption and was illustrated in Fig. 6.11.
 - A second advantage in reducing specific fuel consumption results from operating the engine at high rpm. As thrust is reduced at altitude, higher rpm is required to produce the thrust required and lower
 results. Remember, a turbojet engine is more efficient with a higher rpm. This is shown in Fig. 6.10.
 - The third advantage can be seen in Fig. 7.7. The fuel flow remains about the same for the three altitudes shown, but the velocity is substantially higher as altitude increases. The angle
 decreases as altitude increases, thus indicating better SR. An 88% increase in SR is shown at 45,000 ft versus sea level.
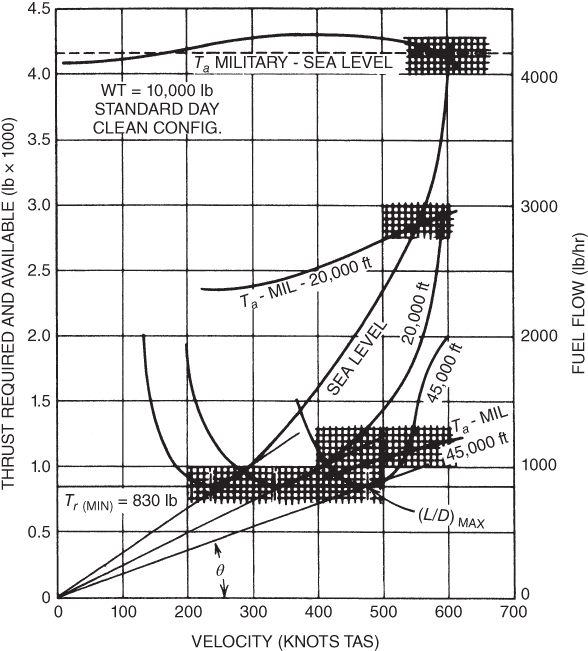
Figure 7.7 T‐38 effect of altitude on specific range.
Cruise–Climb Flight
When air traffic control will allow flight that is not restricted to a set altitude, a further increase in aircraft range (for jet aircraft) can be obtained by using a cruise–climb technique. As fuel is consumed, a higher altitude will offer a higher true airspeed for approximately the same fuel flow. Cruise flight for turbojet aircraft occurs at or above the tropopause. For maximum range an aircraft is flown at  . With values of
  ,
,  , and TAS held constant, both lift and drag are directly proportional to the density ratio,
  .
.
Above the tropopause thrust is also proportional to the density ratio. As fuel is consumed, weight is reduced and, if the airplane was allowed to climb, it would remain in equilibrium because lift, drag, and thrust all vary in the same manner. Constant velocity above the tropopause means constant Mach number. Fuel flow decreases with altitude, as was seen in Fig. 6.12, and thus specific range is increased.
The procedure is then to establish proper maximum range airspeed at the tropopause. Maintain constant Mach number and allow the altitude to increase as weight is reduced. The improvement in range by using cruise–climb flight over constant altitude flight is a function of the weight of fuel used during cruise divided by the aircraft's gross weight at the beginning of cruise (Fig. 7.8).
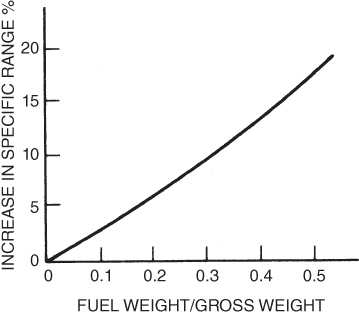
Figure 7.8 Range improvement using cruise–climb.
Note: In our discussion of performance in thrust‐producing aircraft the word “power” was never used. Many pilots use the terms “power” and “thrust” interchangeably. This is a gross error. Thrust‐producing aircraft do not produce power. They do not use power curves. Pilots will often make statements such as “add power” or “backside of the power curve.” All such statements are correct only for power‐producing aircraft (discussed in the next two chapters), not for thrust‐producing aircraft.
EQUATIONS
- 7.1

- 7.2
PROBLEMS
- If the weight of a jet airplane is increased then
- parasite drag increases more than induced drag.
- induced drag decreases more than parasite drag.
- both parasite and induced drag increase by the same amount.
- induced drag increases more than parasite drag.
- If the weight of a jet airplane is reduced as fuel is burned, the
 curve
curve
- moves down and to the right.
- moves up and to the right.
- moves down and to the left.
- moves up and to the left.
- If a jet airplane is in the gear down configuration,
- the increase in parasite drag is more than that of the induced drag.
- the increase in induced drag is more than that of the parasite drag.
- both types of drag are the same.
- If it is impossible to raise the landing gear of a jet airplane, to obtain best range, the airspeed must be _____ from that for the clean configuration.
- increased
- decreased
- not changed
- From Fig. 7.4. the glide ratio
 for the airplane in the full flaps and gear down configuration is
- 12.05.
- 5.4.
- 5.0.
- 4.2.
- The minimum drag for a jet airplane does not vary with altitude.
- True
- False
- Figure 7.5 shows an increase in specific range with altitude because
 decreases while fuel flow decreases.
 remains the same while fuel flow decreases.
 remains the same while
  decreases.
- fuel flow remains about the same while airspeed increases.
- A jet airplane is flying to obtain maximum specific range. As fuel is burned the pilot must
- reduce throttle but maintain the same airspeed.
- maintain throttle setting and let the plane accelerate.
- reduce throttle and airspeed.
- maintain throttle and reduce airspeed.
- A lightly loaded airplane will be able to glide farther but at a lower airspeed than when it is heavily loaded.
- True.
- False.
- Which of the following words should never be used in the discussion of jet aircraft?
- Power
- Horsepower
- Power curve
- All of the above
- Using Fig. 7.2, find the velocity for best range for the airplane at 12,000 and 8000 lb.
- Using Fig. 7.2, calculate the specific range for the airplane at both weights if it is flying at the best‐range airspeed.
- Using Fig. 7.2, calculate the specific range of the airplane if the throttle is not retarded from the 12,000‐lb best‐range position, the airspeed is allowed to increase as fuel is burned, and weight is reduced to 8000 lb. Compare your answer to that for Problem 12 and state your conclusions.
- Using Fig. 7.5, calculate the specific range for this airplane if it is flying at best‐range airspeed at sea level and at 20,000 ft altitude.