When systematic strategic planning was first introduced during the 1960s, the initial focus was on diversification of the firm. But as firms increasingly faced strategic challenges from technological turbulence, changing competition, saturation of growth, and sociopolitical pressures, it became evident that the problems posed by these challenges could not be resolved simply by adding new business areas to the firm.
As a result, in the 1970s the strategist’s attention turned from diversification to optimizing the firm’s competitive strategies in its historical businesses and then to optimizing the firm’s total business portfolio. This shift was accelerated by the fact that the prospects for the different historical businesses of the firm became progressively differentiated from one another with respect to future growth, profitability, and strategic vulnerability .
A major conceptual contribution to strategic analysis was made by the Boston Consulting Group which introduced the well-known BCG matrix . Others elaborated the original concept into different and more comprehensive matrices. All of these matrices apply on turbulence levels 1–3. This chapter focuses on strategy formulation on turbulence levels 4–5.
Strategic Segmentation
.
SBA and SBU
In the early approaches to strategy formulation, the first step was to identify ‘the business that the firm is’. This summary statement reflected the common threads that gave the firm coherence and a distinctive character and, at the same time, put a boundary around its expansion and diversification ambitions. Thus, Theodore Levitt, who in the 1960s criticized railroads and petroleum companies for failing to articulate their business concepts, suggested that the former declare themselves to be in the ‘transportation business’ and the latter in the ‘energy business’.
For early strategists, the definition of the ‘business we are in’ and identification of the firm’s strengths and weaknesses constituted the extent of the attention paid to the historical businesses of the firm. By the 1960s, a majority of middle-sized and all large companies had become a complex assortment of product-market entries. While during the first half century most of the entries had shown positive and attractive growth, by the 1960s, the prospects had become mixed, ranging from excellent to declining. The differences were caused by differences in the stages of demand saturation, in geographic-economic-sociopolitical environments, in competitive climates , and in technological turbulence.
It became clear that diversification into new fields was not going to solve all of the firm’s strategic problems, nor take advantage of all its opportunities, because many new challenges lay in the firm’s historical business areas. As a result, strategic analysis increasingly placed emphasis on the prospects for the firm’s historical portfolio of businesses, and the first step in such analysis became, not defining the ‘business we are in’ but identifying the multiplicity of distinct businesses of the firm.
In order to do this, management had to make a fundamental change in outlook. By the mid-century the firm’s perspective had become introverted, ‘inside out’ the business prospects were viewed through the eyes of the different organizational units and the historical product lines of the firms. Future prospects were typically determined by extrapolating the historical performance of the firm’s divisions. By the 1970s, though, a typical division was involved in an array of markets with very different prospects, and it was not uncommon for several divisions of a firm to be serving the same demand area. In turbulent environments, extrapolation of performance by organizational units became unreliable and, most importantly, failed to provide insights into the differences among the future prospects in different parts of the environment. Thus, it became necessary to shift to an ‘outside-in’ perspective: to analyze the environment of the firm in terms of the distinct areas of trends, threats, and opportunities which it offered to the firm.
A unit for such analysis is a strategic business area (SBA) which is a distinct segment of the environment in which the firm does (or may want to do) business. As the first step in strategy analysis, the respective SBAs are identified and analyzed without any references to the firm’s structure or its current products. The outcome of such analysis is the growth/profitability/turbulence/technology prospects which the SBA will offer in the future to any competent competitor.
- 1.
In which SBAs will the firm do business in the future?
- 2.
What competitive position will the firm occupy in each SBA?
- 3.
What competitive strategy will the firm pursue to gain this position?
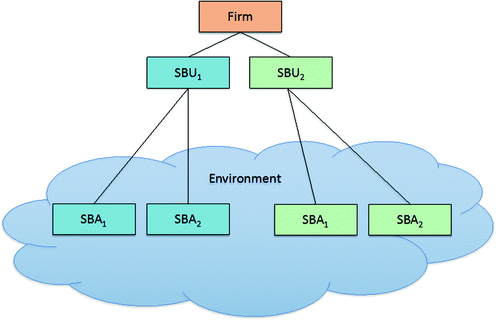
SBA vs. SBU
When the SBA–SBU approach is first introduced into a firm, an important question is how to structure the SBU operating unit relationship. For example, in the original application, Mr. McNamara found that his principal operating departments—Army, Navy, Air force, and Marines—all made overlapping and frequently conflicting contributions to the mission slices : strategic deterrence, air defense of the USA, limited warfare, etc. Mr. McNamara’s solution was to create new units charged with strategic planning for the respective mission slices . The strategic decision made by these new SBUs was ‘cross-walked ’ for implementation to the departments. Thus, in Mr. McNamara’s scheme, the SBUs had only strategic planning responsibility, while the departments were responsible for strategy implementation. This split created conflicts and a lack of coordination, particularly because several departments frequently shared the responsibility for an SBA. For example, both the Navy (with its Polaris missile submarine) and the Air force (with its Minuteman) were made responsible for developing products for the strategic deterrence mission.
To avoid such duality of strategic responsibility, the GE used a different solution. It undertook the difficult task of matching existing operating units to the firm’s SBAs, thus making their SBUs responsible not only for strategy planning and implementation, but also for subsequent profit making. This approach eliminates the crosswalk and unifies profit and loss responsibility in an SBU . But, as GE and other companies have found, the historical organizational structure does not map simply onto the newly identified SBAs and the resulting responsibilities are not clear-cut and unambiguous.
A third solution is to reorganize the firm according to SBAs so that there is a one-to-one correspondence of SBAs and SBUs . This apparently simple solution runs into its own difficulties because effectiveness of strategic development, which is the organizational design criterion used in identifying SBUs, is only one of the key determinants of organizational structure . The others are the effective use of the firm’s technology and the efficiency of profit making. A reorganization according to SBA, which maximizes the effectiveness of strategic behavior may, therefore, compromise the firm’s profit-making performance, or it may be infeasible in light of technological considerations. (We shall be discussing the problem of accommodating strategic and operating activities within the organizational structure in Chapter 17.)
It can be seen from the above that the problem of allocating responsibilities for the firm’s SBAs is far from simple and that solutions will differ from one case to another. Nevertheless, there is enough experience to show that the SBA–SBU concept is a necessary tool for giving a firm a clear view of its future environment, which is essential for effective strategic decisions.
Demand-Technology Life Cycle
During the first part of the twentieth century, most SBAs grew at positive and fairly steady rates. Although growth was interrupted by periodic recessions, the subsequent recoveries restored growth to the prerecession growth rates. Thus, firms developed the habit of comparing industries on the basis of their respective growth rates and of forecasting future performance by extrapolating historical trends.
From the 1930s on, the growth picture began to change. Some industries continued to prosper, for some growth slowed down, and some firms experienced sales declines in some of their SBAs. At the time this first happened, the deviations from the upward growth trend were seen as anomalies and the reasons for them were poorly understood. But the anomalies multiplied and by the mid-1970s a new perception of economic growth began to emerge.
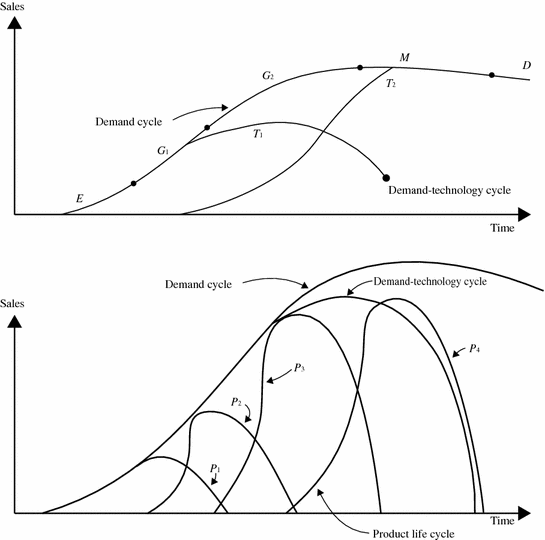
Demand-technology-product life cycles
- 1.
Emergence (E), a turbulent period during which an industry is born, and a number of aspiring competitors seek to capture leadership.
- 2.
Accelerating growth (G1) during which the surviving competitors enjoy the fruits of their victory. During G1, the demand growth typically outpaces the growth of supply.
- 3.
Decelerating growth (G2) when early signs of saturation appear, and supply begins to exceed demand.
- 4.
Maturity (M) when saturation is reached and there is a substantial overcapacity.
- 5.
Decline (D) to a lower volume of demand (or to zero) which is determined by secular demographic and economic factors (such as growth rates in GNP or in population), and by the rates of product obsolescence or product consumption.
In the perspective of the demand life cycle , deceleration of growth and maturity appears not as aberrations but as inevitable consequences of economic development. The question is not whether an SBA will pass beyond G1 but rather when it will do so, or, to put it differently, what will be the length of the demand cycle, measured from the beginning of emergence to the arrival of saturation.
Historical evidence suggests that the duration of industry life cycles has been shrinking, thanks largely to improvements in management and effectiveness of firms: improvements in speed of product development, effectiveness of marketing, and efficiency of distribution systems.
This observable shrinkage of time between the birth and saturation of an SBA poses several new and major challenges to management; a manager must expect to witness birth, growth, maturity , and decline in many of the firm’s SBAs. As a result, if the firm is to maintain growth, then management must be continually concerned with adding new SBAs to the firm and divesting from SBAs which can no longer meet the firm’s growth objectives. This is the first major challenge which, as we shall see later, is a concern central to strategic portfolio management.
The second challenge arises from the fact that, as a life cycle passes from one phase to another, the historical competitive strategies typically become ineffective.
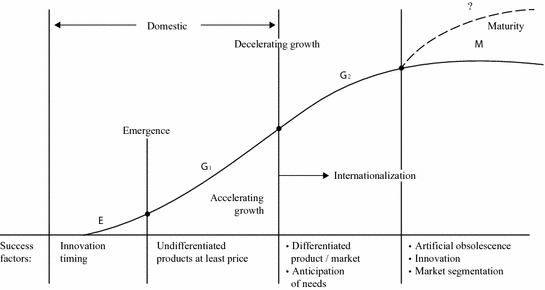
Typical evolution of competitive strategy
Thus, the second challenge to management is to anticipate transitions in the stages of demand cycles and to revise the firm’s strategy to respond to the changing competitive factors.
Returning to Fig. 9.2, the upper part shows another pair of life cycles. These are the demand-technology life cycles (labeled T1 and T2, respectively) which determine the demand for products/services based on a particular technology.
For example, in the mid-1990s the demand for handheld personal computers with a mobile operating system (smartphones) was still in the early G1 stage, and growing at a rapid rate. Since the mid-1970s, this demand had been served by handheld wireless communication devices (illustrated as T1). Toward the end of the 1990s, smartphone technology (T2) began to displace handheld technology. Firms which clung to the historical technology (Nokia) began to lose market share. Curiously enough, the leading companies failed to make a transition to the smartphone technology. As a result, the demand for the relatively simple handheld technology was taken over by newcomers, such as Apple, Samsung, and BlackBerry.
One reason for this ‘changing of the guard’ is illustrated on the lower part of Fig. 9.2 where inside the demand-technology cycle are shown successive product life cycles based on the technology which originally served the demand.
If the technology is fertile (see Chapter 12), the research and development organization becomes a key contributor to success by developing a succession of products (P1, P2, P3, etc.) which incorporate progressive technological improvements. As a result, the firm becomes technology-driven (see Chapter 12): The newest developments by the R&D department determine the pace of the firm’s strategic development.
When, however, as shown in Fig. 9.2 the importance of the original technology begins to decline , the driving force of technology continues to proliferate products which are no longer competitive in the market place. Thus, in technologically turbulent environments, management needs to recognize early signs of technology obsolescence and assure that the R&D function does not continue to proliferate technologically obsolete products. Beyond implications for management of R&D, technology substitution has important consequences for the way in which a firm defines its SBAs. These consequences will be discussed in the next section.
SBA Segmentation
Experience has shown repeatedly that managers have difficulty in segmenting the firm’s environment into SBAs. One reason is the difficulty many people have in changing an ingrained viewpoint: from viewing the environment through the eyes of the firm’s traditional product line to viewing the environment as a field of future needs which any competitor may choose to address.
A procedure which has proved useful is to ask managers involved in SBA segmentation to avoid using the names or characteristics of the firm’s products and focus attention on future threats and opportunities offered by the environment.
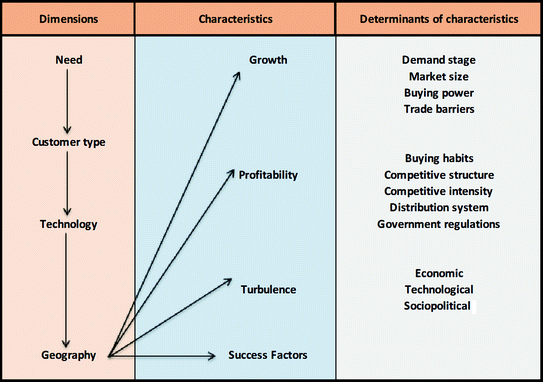
Logic of SBA segmentation
- 1.
A societal need for products or services. For example, personal transportation.
- 2.
Technology which will serve this need in the future. For example, electric, fuel cell, or combustibles.
- 3.
The customer type which will have the need. For example, consumer, industrial, and government.
- 4.
The geographic region in which the need will be served.
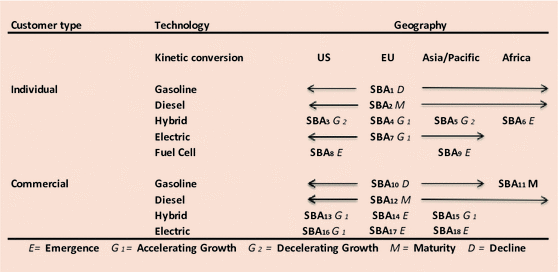
As the examples in l and 2 above show, in the environment of the 2000s, many needs of society will be served by competing technologies, with a new technology displacing the historical one. When this is expected to be the case, each need technology combination should be treated as a distinctive area of opportunity and, therefore, as a separate SBA. Thus, in our example, the need for fuel-cell technology would be an SBA which is different from the SBA of the same need served by electric technology.
The customer type is a category of organization or individuals which have the same need. The differences among customer types are determined by channels of distribution, buying habits, and/or special requirements for products which serve the need. A geographic region is determined by a distinctive economic entity, such as a country. However, whenever two or more adjoining countries have very similar economic and competitive environments, they may be consolidated into a single geographic region.
- 1.
Growth prospects .
- 2.
Profitability prospects .
- 3.
Expected turbulence which may generate strategic threats and/or opportunities and cause major discontinuities in the growth and profitability prospects .
- 4.
Success factors which will determine strategies of the top competitors in the SBA.
The last column of Fig. 9.4 lists the variables which will determine the respective characteristics.
The segmentation process must identify a large enough number of SBAs to permit management to make meaningful competitive and strategic resource allocation decisions. On the other hand, the number of SBAs must be small enough to keep strategic decisions comprehensible and manageable. In practice, it is not uncommon to find thirty to fifty SBAs in large firms. Of course, widely diversified smaller firms may arrive at the same number.
SBA for Kinetic conversion transportation
Strategic Resource Areas
Systematic strategic planning was born in a resource-rich environment. Planners concentrated on choosing markets, technologies, geographic areas, and product lines which offered the most attractive prospects for the firm. They then translated the chosen strategies into requirements for monetary, human, and physical resources with the expectation that the treasurer, the personnel manager, and the purchasing manager would have no trouble in filling the requirements.
Recent events have cast doubts on the validity of this perspective. First, studies from the CATO institute have given the world a theoretical awareness of the finiteness of natural resources. Previous petroleum crisis showed how an escalation of resource costs can undermine and even make invalid the product-market strategy of a firm. Then, the worldwide recession of 2008 made money scarce and stopped growth for firms in which the cost of capital exceeds the return which the firm can earn on it.
The future prospects are for either physical or politically induced resource scarcities and constraints.
As a result, the trend today is to broaden the firm’s strategic perspective to include resources, as well as market opportunities. Increasingly, resource constraints impose limits on what the firm can do in the product-market place. For some resource-constrained firms, the practical sequence for planning is now from the inputs to the outputs: first determining the resource availability and then using it as a guide in formulating the product-market strategy.
From the viewpoint of planning technology, the two-way feedback between resource and product-market strategies complicates the process, but poses no insuperable difficulties. More difficult, perhaps, will be the acceptance of the new outlook by managers. In the industrial age, growth vistas appeared limitless and the objectives were determined primarily by the aggressiveness and adventuresome of the managers. In the resource-constrained postindustrial universe, the managers have to balance what they want to do against what they can do. This does not necessarily mean a passive acceptance of resource limitations. There is as much room for ingenuity for development of entrepreneurial resource strategies as there is in the product-market technology strategies.
For firms confronted with strategic resource challenges, subdividing the firm’s resource needs into the strategic resource areas (SRAs) is a useful first step in the formulation of the firm’s resource strategy.
Strategic Influence Groups
In addition to constraints on input resources, the firm is increasingly subject to legal limitations, social pressures, and involvement of inside and outside non-management groups in the decisions and actions of the firm.
Up until the mid-1970s, this problem was viewed as a secondary one, lying outside the central concerns of corporate managers. The solution to the problem was seen as simple. The pressures on business were due to a ‘misunderstanding’ by the government and the public of the benefits which the firm brought to society and of the necessity of societal noninterference, if these benefits were to be produced. The solution lay through education, ‘explaining free enterprise ’ to the public, and supporting the ‘business viewpoint’ through lobbying activity. This viewpoint was invariably and adamantly against all forms of constraints on managerial freedoms. To paraphrase President Ford, the solution was to ‘get government out of business’ hair’. But, progressively, constraints in one form or another have proliferated. The consuming public has turned from a docile and easily influenced purchaser into a demanding and suspicious critic; governments, particularly in Europe, have become increasingly directive; the public has become increasingly disenchanted with the firm.
Thus, from a peripheral problem, the relationship with society is evolving into a key one. In addition to business and resource strategies , firms will increasingly formulate societal strategies . The first step in societal strategy formulation is to sort out the many social-political influences into distinctive and different strategic influential groups (SIGs). (We shall be discussing the societal strategy problem of the firm in Chapter 13.)
To summarize the preceding three sections, success and survival of the firm in the 2020s will be determined by its ability to shift from its introverted focus on historical markets and products to an extroverted perception of the future trends, threats, and opportunities . The concepts of SBA, SRA, and SIG are useful complexity reduction tools for making this transition.
Strategic Information
.
Environmental Surveillance as an Information Filter
The step following segmentation is to determine the future performance potential which will be available in each SBA to successful competitors. This performance is described by the characteristics shown in the middle column of Fig. 9.4 and determined by the variables described in the right-hand column.
In the early days of strategic planning, it was discovered that the extrapolative accounting-based information system, typically found in firms, was inadequate and misleading for forecasting performance in turbulent environments. As a result, numerous forecasting and environmental analysis techniques were developed, designed to capture nonlinearities, complexity , and unpredictability of future environments.
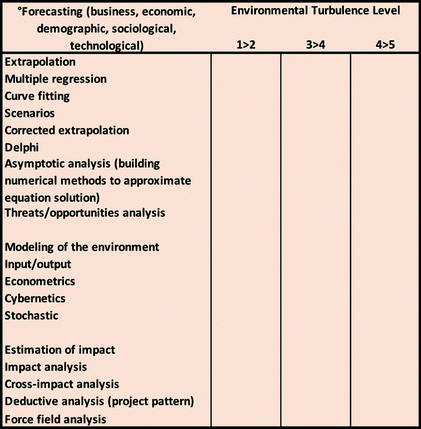
Methods for evaluating the environment
Modeling techniques construct a model of reality which can be manipulated by the planner to produce different futures by changing inputs and relationships among the variables within the model. A famous cybernetic model was used to predict probable futures of the world’s ecological environment in the book Limits of Growth (Meadows 1972-G).
After forecasting or modeling has been used to make predictions about the firm’s environment, it is next necessary to assess the impact of the results on the firm. This is the intent of the last group of techniques.
Impact analysis assesses the consequences of trends and events to the firm’s performance, one at a time, while cross-impact assesses the extent and probability of a simultaneous coincidence of several events.
It is not our purpose in this book to acquaint the reader with the details of environmental analysis techniques; they can readily be found in a large body of literature on forecasting. Our purpose is to call attention to the limits of applicability of some of the techniques. This is illustrated in the three right-hand columns in Fig. 9.5, where the checks signify the conditions under which a technique will accurately reflect environmental reality. Thus, extrapolation (and its close cousins, multiple regression, and curve fitting) will accurately describe an extrapolable environment in which the historically determining variables, and relations among them, are expected to persist into the future. But, extrapolative techniques, as shown by the absence of checks in columns 2 and 3 in Fig. 9.5, will misrepresent the environment when the variables or the relationships change.
Thus, the environmental surveillance and analysis techniques can be viewed as a filter through which the environmental information must pass on its way into the firm. If the filter is sufficiently open to capture the full richness of the environment, the resulting image within the firm will be faithful to the external reality. If the filter is too restrictive, the data which find their way into the firm will distort and oversimplify reality. For example, during the ‘Great Recession’ when the housing bubble burst resulting in $8 trillion dollars of lost value, many firms around the world were using extrapolation-based long-range planning to anticipate the future. Understandably, little advanced indications of the surprise were given in the forecasts used by these firms.
The preceding discussion shows that the choice of the environmental surveillance technique is a decision of great importance which, if made improperly, can make the firm strategically myopic and result in the delayed reactive response discussed in the preceding chapter.
In practice, the choice of the techniques is frequently left to the staff who is environmental surveillance specialist. On the one hand, he lacks the breadth of perspective of the general manager, and on the other hand, his natural inclination is to use the technique in which he is trained. Thus, to paraphrase Clemenceau, the choice of the forecasting technique is too important to be left to the forecasters. The choice must be made by the general manager who is responsible for the development of a strategic business unit.
In making the choice, he need not, and cannot, become an expert in the details and processes of the respective techniques, but he must learn enough about the techniques to understand the restrictions which the respective filters impose on the firm’s image of the external reality.
Mentality Filter
As firms began to use the new environmental surveillance techniques, a curious result was repeatedly observed. Whenever the information presented in the forecasts was consistent with the historical experience, the new data were quickly incorporated into management decisions. But when the data were at substantial variance, or contrary to historical experience, they were neglected or even rejected as irrelevant.
Thus, for example, when distribution of market shares shifted among the firm’s historical competitors, management promptly took countermeasures. But, in market after market the inevitable arrival of Chinese competitors was disregarded until the Chinese arrived on the scene.
History is replete with examples of firm’s failure to recognize an impeding discontinuity: Henry Ford’s refusal to recognize the end of the single model era in the automotive industry, the formation of OPEC and the widespread effects on petroleum prices, and finally, the effects of e-commerce technology on the retail point-of-sale (POS) industry.
The instances of rejection of novel information are numerous enough to suggest the concept of another filter which is applied by the managers to whom surveillance data are addressed. We shall refer to it as the mentality filter . The explanation of this filter is readily found in sociological and psychological literature.
As managers respond to environmental stimuli, they encounter successes and failures. Over time, accumulation of the successes forms a conviction in the manager’s mind about ‘things that do work’, and failures build a conviction about ‘things that do not’. Together, the two sets of convictions evolve into a success model of the environment, or what psychologists call a mindset . The model contains the variables, relationships among them, and action alternatives which are believed to produce success in the environment. Very few managers attempt to make their mental success model explicit by writing it down, or programming it on a computer, but all experienced managers use such models in their daily decision-making work.
The model is essential for managing in a complex and changing environment. When complex information comes in, an experienced manager uses the model to reduce the complexity of the signals and to select appropriate responses. As a result, he reacts promptly and decisively. An inexperienced manager, without a developed and tested world model, becomes swamped by the volume and complexity of the information that comes in.
Thus, an articulated success model is an essential part of the equipment of a good manager. But it remains valid only so long as the variables and relationships in the environment remain unchanged. Whenever the environment undergoes a discontinuous change, as it did during the transition from the mass production to the mass marketing era, the manager’s historical success model becomes the major obstacle to the firm’s adaptation to the new reality.
The manager will filter novel signals which are not relevant to his historical experience and thus fail to perceive the shape of the new environment, the newly important variables, new relationships, and new success factors. As a result, he will delay accepting the new realities until they impact on the firm.
This leads to a widely observable paradox which is described in the phrase: ‘success breeds failure’ in a turbulent world, and the longer the record of successes of the preceding model, the more likely is the manager to cling to it in spite of novel information which is presented to him.
Thus, we can say that the manager’s success model is a second filter which is applied to the incoming environmental data, and that this filter becomes critical whenever the environment moves from one turbulence level to another.
Development of Mentality
In business history, there were two periods of pervasive shifts in environmental turbulence which profoundly changed the character of the success model .
The first transition occurred early in the twentieth century when, entrepreneurial work being done, the key to success shifted to efficient production and distribution. The great founder-entrepreneurs, whose success model was based on creativity, vision, bold risk-taking, and enlargement of the strategic scope of the enterprise, became dysfunctional in the new mass production era in which efficiency of production, stability of the product line, economies of scale, and subdivision of labor became the critical factors of success.
As a result, entrepreneurs with strategic and creative mentalities were replaced by managers who had what came to be known as the production mentality .
The second transition started in the thirties, when the expansive growth of the first quarter century began to slow down and the success model shifted from the introverted efficiency-seeking production mentality to an extroverted marketing mentality , based on identifying and anticipating the needs of the market.
The transition to the marketing mentality was resisted by the entrenched production-minded managers. The transition was slow, accompanied by power struggles between the establishment and the new breed of power-hungry market-oriented managers.
The transition to the marketing orientation was easier in success-hungry firms, which had been ‘also rans’ during the mass production era, than it was in firms which had been the leaders . Thus, it was the ‘small’ General Motors which pioneered and succeeded in introducing the annual model change in the face of the insistence by Mr. Henry Ford on ‘giving it to them in any color so long as it is black’.
A significant difference in the transition of the thirties was that, unlike during the preceding transition, the production managers were indispensable, as were the entrepreneurs. Thus, a new balance of power had to be established between the newly dominant marketing managers and the historically dominant production managers.
A third transition started in the USA in the 1960s, when a need began to grow for reintroduction of strategic and creative mentalities into the firm. But the circumstances accompanying the new transition were significantly different from the two preceding transitions.
Unlike in the 1930s, when there was little understanding of the fact that management mentality and corporate culture are the major obstacles to adaptation to new realities, today there is a widespread recognition of the importance of mentality/culture. The word culture , used here for reference to the collective mentality of a firm, commonly occurs in the business literature as a key variable in the strategic orientation of a firm. Furthermore, several systematic approaches have been developed to help managers to move to the strategic/creative mentality level.
One of these is a diagnostic approach which permits the firm to determine the type of mentality which the firm will need in the future, to diagnose the present mentality within the firm, and then to determine the mentality gap which will need to be closed in certain parts of the firm.
Mentality and turbulence
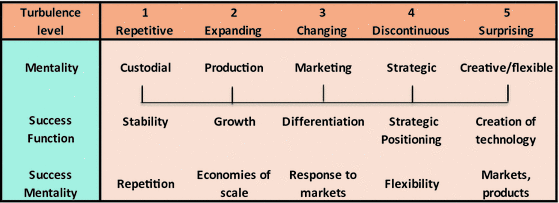
As the figure shows, for each environmental turbulence level there is an appropriate success mentality , which matches the success function at the turbulence level. The respective success functions are described briefly at the bottom of the figure.
This means, for example, that Mr. Henry Ford, who was a huge success in an expanding environment, would have been an obstacle to progress in the Apple company when it created an unpredictable environment in the personal computing industry by introducing the mass-produced PC. But Steve Jobs, the co-founder of Apple, would have been equally dysfunctional in the Ford Motor Company of the 1920s.
Recent experience shows that many firms which find themselves in a discontinuous or unpredictable environment have a difficult mentality-changing task, starting either from the production or from the marketing mentality .
Fortunately, in addition to diagnostic techniques, approaches are now available for helping selected managers develop a new mental success model . Thus, mentality change no longer has to occur through ‘blood, sweat and tears’ of an organic, unmanaged adaptation.
For enhancement of the creative mentality, creativity techniques are available, such as brainstorming, synectics, brain writing, etc. For enhancement of the strategic mentality , there are several mentality-changing techniques. Some of the early techniques, such as Trident (Davous and Deas in Ansoff et al. 1976-F) and strategic orientation round (SOR) developed by the Dutch Philips Company, are primarily oriented toward enhancing strategic mentality of managers. New techniques are dual purpose: They enhance strategic mentality of the participating managers in the course of producing effective strategic responses. We shall be discussing several of these techniques in Chapters 10, 19, 24, and 25.
Just as in the 1930s, the introduction of the strategic/creative mentalities is not a replacement but an addition process. If the entire management were to be converted to the new mentalities, the firm would become creative, but little efficient production would occur and little effective marketing would take place. The firm would be an excellent profit potential generator but very poor profit maker.
The additive character of the need is both an advantage and a problem. The advantage lies in the fact that only selected managers, those charged with the strategic development of the firm, need to undergo the mentality change. This limits the size of the task and permits a careful selection process to identify managers who have the talents and personality necessary to behave strategically.
The problem is the need to assure a constructive coexistence between several mentalities. We shall discuss a process and tools for assuring such coexistence in Chapter 25.
Strategic and Creative Mentalities
Both are focused on the future. In strategic mentality , the past is recognized and treated critically. Managers with strategic mentality are skillful in perceiving the underlying trends that will make the future different from the past. Managers with creative mentality make novel juxtapositions of historical trends and create new ideas.
Both subsist on novel unfamiliar change. The strategic manager has no emotional or intellectual investment in history nor the future. His viewpoint was brilliantly described by CEO of General Motors, Alfred P. Sloan (A. P. Sloan, Jr. 1965-G) who said: ‘The strategic aim of the enterprise is to produce a satisfactory return on investment ; and, if the return is not satisfactory, … then the resources should be allocated elsewhere’. Thus, the strategic manager has no sentimental attachment to ‘our markets’, ‘our products’, and ‘our customers’, which is typically found in the marketing mentality .
The creative manager is focused on novelty . Typically, when asked who are your competitors, the creative managers’ reply is, ‘We have no competition. We are our own competition’.
The strategic manager differs from the creative manager in his preparedness to recognize that mentalities of others (such as production managers) are legitimate and may make an important contribution to the success of the firm.
The creative manager, on the other hand, typically cannot afford the luxury of ecumenism, if he is to maximize the chance that his own unorthodox views are going to be accepted.
In the matter of key success factors, the strategic manager is skilled in identifying the small number of variables, in an unfamiliar and complex problem, which are critical to success. The creator invents new success factors and variables.
Both are guided by an entrepreneurial drive: a vision of a new future for the firm. Both are ‘gamblers’. The strategic manager makes gambles only when they are in the best interest of the firm. The creative manager may gamble because of the excitement of novelty .
Both are tolerant of failure in situations in which the risk has been taken with ‘eyes open’, with a full appreciation of the possibility of surprises. But they are intolerant of managers who avoid risks, or who walk into a risky situation with ‘their eyes closed’. Both refuse to accept a one-time failure as a deterrent to trying again.
The characteristics of the successful strategic/creative manager have been aptly summarized in the Shell Company, where he is said to possess a helicopter mentality: the imaginative ability to rise above the many-variable complexity which novel challenges typically present, and to see the few basic variables and relationships which determine a successful response.
The Power Filter
As already discussed, environmental discontinuities frequently have major implications for the power structure. Thus, in the change from production to marketing orientation , a power transfer occurred from the production to the marketing departments. The current shift to the strategic orientation enhances the power of the corporate office (see Chapter 17), of the R&D department, and of the corporate planning department.
It is, therefore, natural for managers and departments, whose power base is threatened by a discontinuity, to minimize or even refuse to recognize the impact of the discontinuity on the firm. Frequently, such rejection is not an unscrupulous effort to preserve a position of power, come what may. The threatened power centers are usually also representatives of the historical mentality which had brought the original success to the firm. Therefore, they can exercise their blocking influence in good conscience and believe that they are acting for the good of the firm.
When the historical mentality in the firm is politically entrenched, the likelihood is high that, through repeated rejection of threatening environmental signals, the firm will drift into a crisis and will go bankrupt unless external influence and/or new management is brought in.
When the representatives of the new mentality have enough power to begin eroding the power of the dominant mentality, and if the threat/opportunity develops slowly enough, a protracted power struggle may bring about a shift of power as defenders of the old mentality/culture are repeatedly discredited by failure of their responses to arrest the decline of the firm’s performance.
Thus, there is a third filter which can delay and impede acceptance of novel environmental signals. We shall call it the power filter.
Novel information will not find its way into management responses, unless the managers with the strategic/creative mentalities have the power to assure its acceptance.
For example, many ‘progressive firms’ invest substantial efforts in development of middle and lower managers. Either through in-company or external programs, these managers typically undergo a change in mentality, while the senior managers who send them to the programs continue to adhere to their historical mentality. When the middle managers return to work, their new mentality encounters hostility from their peers and indifference or rejection from their bosses.
Three patterns of reaction have been observed. In the first, the returnees conform to the historical mentality and forget their ‘book-learning’. In the second, they leave the firm. In the third, they begin to fight the system, but are ineffective because they lack the necessary power base and skills in change management.
Therefore, to assure a firm-wide acceptance of a new mentality, it is essential that top management be the leading practitioners of this mentality.
A Model of Strategic Information
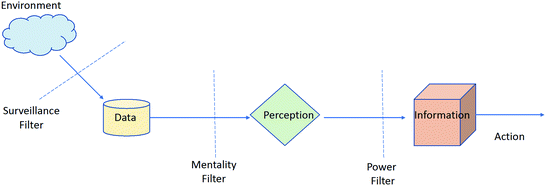
Management information
For a faithful reflection of the environmental reality, it is necessary to use a technique which can capture the essential elements of that reality. The more complex the reality, the more comprehensive must be the technique.
Data brought into the firm do not become a part of information on which decisions are based until it passes two additional filters. The first is the mentality filter based on the mental success model which is used by managers to identify parts of the data which they perceive to be relevant.
Managers build their private success models through experience, trial and error, and successes and failures. When the environment is undergoing a discontinuous change, the historical success model becomes invalid and acts to block the newly relevant data. Thus, development in key managers of a mentality which will be responsive to future turbulence is a critical part of the strategic information problem. Today, techniques are available for both diagnosing the needed mentality and helping managers to acquire it.
The third filtering of data is imposed by the power structure. If the powerful managers lack the appropriate mentality, they will persist in preventing vital novel signals from affecting decisions. This explains the phenomenon of procrastination discussed in the last chapter.
Competitive Positioning
.
The BCG Matrix
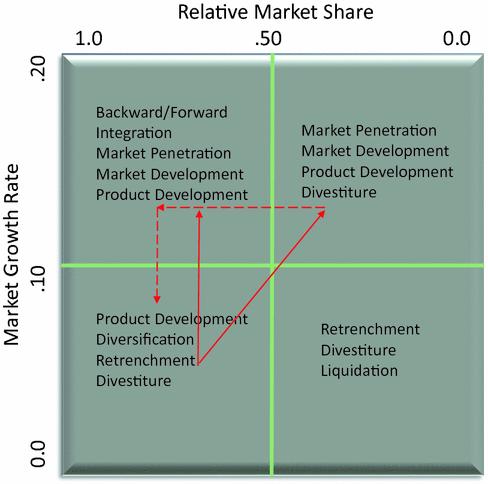
The BCG matrix
A useful technique is to represent each SBA as a circle whose diameter is proportional to the expected size of the demand. A shadowed segment within the circle can represent the market share the firm expects to capture. Additional information which can be written alongside the circle is the percentage of sales and profits which the firm expects to derive from the SBA. The resulting scatter diagram presents a comprehensive view of the entire firm on a single piece of paper.
The star should be cherished and reinforced.
The dogs should probably be divested, unless there are compelling reasons for keeping them.
The cash cows should be made to control (severely) their investments and send excess cash to the headquarters.
The question marks need to be analyzed to see whether the investment necessary to convert them into stars is worthwhile.
As the dotted line indicates, the question marks may be promoted to stars, and the stars, because of eventual maturity , will become the cash cows of tomorrow. The solid arrows indicate the flows of cash from cash cows.
- 1.
The future prospects in all the firm’s SBAs should be measurable by a single growth rate index. This is true in SBAs which, for the foreseeable future, can be expected to remain in the same life cycle growth stage, and/or when the expected level of turbulence is low, which is another way of saying that the growth is not likely to be perturbed by unexpected events. But when the SBA is expected to move into another growth stage in the foreseeable future, and/or high-level turbulence is forecast, the single growth rate measure of prospects becomes inaccurate and dangerous.
- 2.
The future competitive dynamics within the SBA should be such that relative market share is the only determinant of its competitive strength. This is true in the G1 stage of growth, under conditions when technology is stable , the rate of growth of demand exceeds the rate of growth of supply, and competition is not cutthroat. But when these conditions do not hold and/or an SBA is in G2 or M, factors other than market share typically acquire dominant importance to continued competitive success.
The conclusion to be drawn from the above remarks is that before the BCG matrix is used, it is essential to make sure that the future prospects are adequately measured by volume growth and the firm’s relative competitive position by its relative market share. Reference to Chapter 6 will suggest that these conditions exist when environmental turbulence is on levels 1 or 2. At these levels, the BCG has the advantage of simplicity and is an effective tool for analysis of the firm’s portfolio.
When environmental turbulence rises above level 2, appropriately more complex measurements are needed for the two dimensions of the matrix. The growth rate should be replaced by the concept of SBA attractiveness , and relative market share by the firm’s future extrapolated competitive position. In the next two sections, we show how to estimate the attractiveness and the competitive position, and in the section following, we shall use them to introduce a version of the matrix which takes explicit account of future uncertainty.
Estimating SBA Attractiveness
- 1.
Because of possible life cycle effects, two estimates of growth are needed, one for the remainder of the current growth stage and another for the following stage.
- 2.
Because of probable changes in competitive dynamics, it should not be assumed that inherent profitability in the SBA will remain as in the past, or will positively correlate with future growth. It is possible for profitability to remain the same or to decrease as an SBA grows. Thus, two independent estimates of short- and long-term profitability are needed.
- 3.
Because of probable social, political, economic, and technological shifts, estimation of attractiveness should take account of the future turbulence.
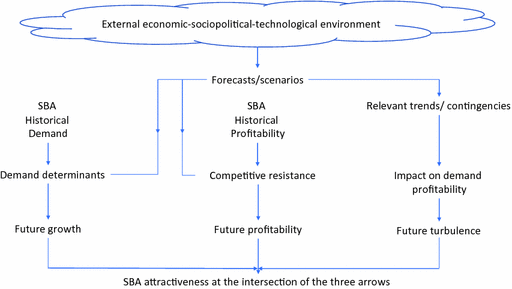
Estimating SBA attractiveness
- 1.
The process starts with a global forecast of economic-sociopolitical-technological environments in which the SBAs of interest to the firm are located. A list of techniques for environmental forecasting was discussed in this chapter.
- 2.
As the next step, an impact analysis of the key trends and contingencies on the respective SBAs is made. The result is a measure of the probable future turbulence in the SBA. This technique is described in this chapter. In making the estimate, it is important to recognize that turbulence manifests itself in two ways: welcome opportunities (0) which may develop in the SBA under analysis, and unwelcome threats (T).
- 3.
Thirdly, both the historical growth and historical profitability trends are extrapolated into the future.
- 4.Next, the probable changes in the historical demand trend are estimated for each of the demand determinants which are illustrated in Table 9.3; +5 and −5 shifts represent major increases or decreases. Two profiles of the shifts in the intensity of the demand determinants are constructed: one for the near and another for the long term.Table 9.3
Appraisal of changes in SBA prospects growth
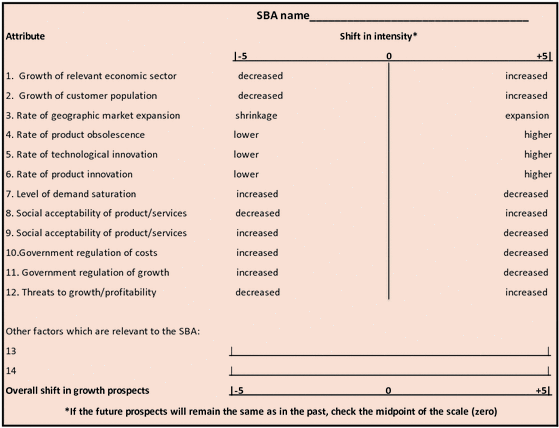
- 5.
At the bottom of the figure, using the two profiles, a summary estimate is made of the overall shifts of growth prospects in the near and the long term. This estimate can be made by averaging the shifts in each line. A more sophisticated approach is to assign to each line an index of its relative importance to future growth, and then use the indices to compute weighted average shifts in the overall growth prospects .
- 6.
The overall shift is applied to correct the extrapolation to produce numerical estimates of future growth.
- 7.A similar procedure is followed to estimate the future shifts in the profitability by estimating the change in the competitive resistance, using Table 9.4 and applying it to the extrapolated profits.Table 9.4
Shift in profitability of an SBA
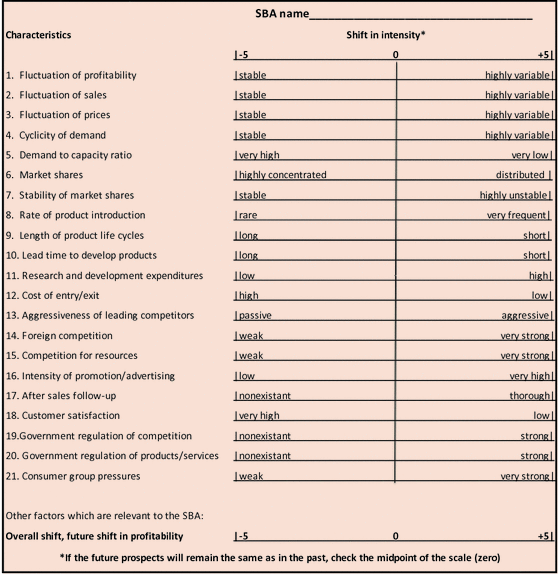
- 8.
Returning to the bottom of Fig. 9.8, an overall estimate is made of the future attractiveness of the SBA by combining the growth (G), profitability (P), and turbulence prospects (T/0) in the following formula:

where α, β, γ, and δ are coefficients whose sum is 1.0 and which are relative importance weights assigned by management to the respective contributions to attractiveness. These coefficients are the relative priorities of the firm’s objectives (see Chapter 11).
Two independent estimates are to be made, one for the long and the other for the short term. The first of these estimates is used to replace the volume growth dimension in the BCG matrix . The second is used in the long-term portfolio balance which will be discussed in Chapter 11.
While a good deal more complex than the simple BCG measure of volume growth, the estimate of SBA attractiveness provides a more realistic basis for the comparison of the complex and interacting factors which determine the relative attractiveness of different SBAs to the firm.
Estimating Strategic Investment Ratio
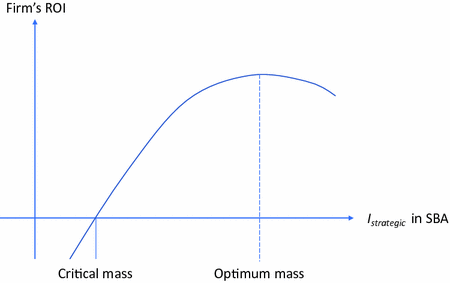
Competitive position and strategic investment
As the figure shows, in each SBA there is a minimal critical mass which is the strategic break-even point : No matter how brilliant a firm’s strategy, or how excellent its capability, a strategic investment below the critical mass level will not be profitable.
Critical mass is difficult to estimate and, until recently, has not been in the forefront of management attention. As a result, numerous well-intentioned plunges into new SBAs have floundered simply because the firm discovered, usually too late, that it did not have the resources to raise its investment in the SBA above the critical mass.
A current example of the importance of critical mass is the future prospects in the electric-automotive industry, which indicates that many of the present competitors will not be big enough to succeed in the global market of the next five years.
- 1.
To withdraw from the SBA rather than facing the inevitable losses.
- 2.
Find a niche within the SBA. An example for a firm in the automotive industry would be to focus its business on a segment of the total demand for personal transportation, such as the demand for luxury transportation. In fact, this is the approach which the Volvo Company took in order to bring its resources in line with critical mass .
- 3.
To form a strategic alliance with another firm (or firms). A recent dramatic example was an alliance between two companies: Nestle’ company the Swiss food giant and Pastificio Rana from Italy. As announced by the two partners, the alliance was formed to pool complementary capabilities to enable them to exceed the critical mass of investment which will be required to succeed in the future global food business.
Figure 9.9 shows that there is also an optimum mass which is a level of investment beyond which profitability begins to decline due to decreased speed of organizational response and bureaucratization of the firm.
We shall use the ratio of a firm’s expected profitability in an SBA to the optimal possible future profitability as one of the key factors which determine the firm’s future competitive position in an SBA.

where If is the firm’s strategic investment level, Icr, critical mass level, and Iopt, the optimum level. We shall refer to the ratio on the right-hand side of the equation as the strategic investment ratio .
Expressed in words, the formula says that, provided the firm’s strategy and capability are optimal (α = β = 1), the firm’s competitive position will be in proportion to the ratio of the firm’s investment into an SBA to the level of investment which will produce optimal profitability. But, frequently, the firm’s strategy and capability are not optimal. In such cases, the competitive position must be reduced by factors α and β which we shall discuss in the following sections.
As mentioned before, the recognition of the importance of the strategic investment level is relatively recent. Therefore, satisfactory techniques for estimating it are yet to be developed. A starting point is to identify the relevant categories of investment.
- 1.
Investment in capacity. This is the cost of facilities and equipment needed to provide the necessary capacity of: production facilities; distribution network; the marketing organization; and research and development.
- 2.
Investment in strategy. This includes the costs of: strategic planning; market research ; product development; and product launching.
- 3.
Investments in capability: This includes the costs of: acquisition of personnel; training of personnel; acquisition of technology; and learning cost of development of competent functional organizations in each of the categories under item (1) above.
Thus, the first step in evaluating the firm’s future competitive position in an SBA is to determine its future relative investment position by:
- 1.
Estimating the firm’s present and presently planned strategic investment by the firm.
- 2.
Estimating the future critical and the optimal masses.
- 3.
Determining the ratio of the firm’s investment to the optimal investment, according to the formula presented above.
*Determining the Future Effectiveness of Present Strategy
- 1.
The firm’s growth thrust which describes the way in which the firm will assure its future growth in an SBA.
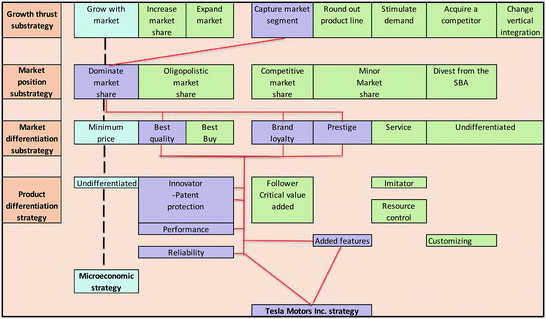
Growth thrust becomes an important component of strategy whenever the SBA growth prospects are not sufficient to meet the firm’s growth objectives. Different ways in which a firm can exceed the market growth prospects are illustrated in the top line of Fig. 9.10.
Competitive strategy factors
- 2.
Market position sub-strategy which describes the market share the firm will seek to occupy. Alternative choices are described in the second line of Fig. 9.10.
Market position sub-strategy becomes the only component of competitive strategy in SBAs in which future growth is excellent and the demand is for undifferentiated products (such as cement).
- 3.
Market differentiation sub-strategy which describes the distinctiveness of the firm’s products/services which the firm will seek to establish in the minds of its customers. This is described in line three of Fig. 9.10.
- 4.
Product/service differentiation sub-strategy which is the manner in which the firm will seek to differentiate its products/services from those of their competitors.
At first glance, product and market differentiation sub-strategies may appear to be identical. Brief reflection will show, however, that they are different. Thus, for example, promotion and advertising are commonly used to create distinctive images of virtually identical products (e.g., distinctive images of breakfast cornflake cereals).
On the other hand, the only ‘marketing’ required for some high-technology products, such as advanced weapon systems or scientific computers, is to inform the customers of the superiority of the products’ performance.
When properly chosen, the two sub-strategies must complement and be consistent with each other in inducing a potential customer to choose a firm’s product or service in preference to that of its competitors.
The GE-McKinsey matrix
A competitive strategy can be constructed with the aid of Fig. 9.10 by selecting mutually consistent components for each of the major sub-strategies. Two examples are given in the figure. The first of these, connected by a double line, is the classical success strategy prescribed in microeconomic theory. As can be seen, this strategy is ‘grow with the market, capture a dominant market share, and offer an undifferentiated product at the minimum price’. As discussed before, this strategy works in a non-turbulent G1 growth stage of the life cycle.
Another strategy, illustrated by the elements connected by the single lines, is the ‘Tesla Motors’ strategy: ‘segment the market, occupy dominant share in your segment, offer service, performance features, and reliability which together project an image of exclusivity, comfort, and styling’.
This sample strategy illustrates the important fact that, to be effective, the sub-strategy components must be consistent with and supportive of one another. For example, the firm cannot hope to gain a dominant market share, if its growth strategy is to grow with the market. As another example, it is difficult, if not impossible, to pursue a minimum price sub-strategy while seeking to be a product innovator.
- 1.Using Fig. 9.10, select the elements of each sub-strategy which describe the firm’s present strategy. Enter these into the second column of Table 9.5. The example in the figure illustrates the classic microeconomic strategy.Table 9.5
Determining future effectiveness of present strategy
Sub-strategies
Firm’s present strategy:

Future success strategies


Strategy element
Sub-strategy ratio =

Strategy
element
Sub- strategy ratio =

Strategy
element
Sub- strategy ratio =

Growth thrust
Grow with the market
Increase market share
0.2
Market position
Dominate market share
Competitive
0.5
Market differentiation
Undifferentiated
Follower
0.5
Product differentiation
Minimum price
Minimum price
1
Firm’s overall effectiveness ratio
0.55
- 2.
Construct a future success strategy by selecting from Fig. 9.6 a set of consistent elements which, in your judgment, will be used by top competitors in the SBA during the next five to seven years.
- 3.
Estimate the future effectiveness ratio of the firm’s sub-strategy relative to the success sub-strategy Si. In the example illustrated in Table 9.5, the growth sub-strategy ratio is estimated to be 0.2.
- 4.
Average the ratios of the four sub-strategies to obtain the overall effectiveness ratio of the present strategy of the firm.
- 5.
Follow the same procedure to construct two (or more) additional future success strategies, S2 and S1, which are expected to be comparably successful to S1.
- 6.
Determine the firm’s overall effectiveness ratios for S2 and S3.
- 7.
Compare the three effectiveness ratios. The largest ratio is the value of the factor a which should be used to substitute for the factor in the equation for determining the future competitive position. In the example in Table 9.5, the effectiveness of strategy S1 is 0.55.
The success strategy which produces the highest effectiveness ratio is the closest to the present strategy and is, therefore, the optimal future strategy for the firm.
If the largest effectiveness ratio is close to one, the present and the optimal strategies are virtually identical, and little more than fine tuning needs to be applied to the present strategy.
If the effectiveness ratio is substantially less than one, major changes in the present strategy will be required if the firm is to become one of the leading competitors in the SBA.

*Estimating Future Competitive Position
To explain the residual factor β, we turn our attention to the third determinant of the competitive position, the capability which the firm brings to the execution of strategy. A comprehensive list of capability factor choices is available for general management: finance, marketing, production, and R&D.
- 1.
General management must focus its attention on growth and efficient production. It must also control and minimize disruptive changes which interfere with minimization of the unit costs of the product.
- 2.
Financial management must manage cash and exercise strict controllership.
- 3.
Marketing should focus on sales and on sales analysis.
- 4.
Production is the key function under the microeconomic strategy. It must receive maximal support from general management and be focused on mass production and maximally cost-effective automation.
- 5.
R&D is a potentially dangerous function under the microeconomic strategy. It must be limited to improvements in production technology and to incremental evolution of products in response to moves by competitors. R&D must be prevented from causing loss of economies of production.
Determining the effectiveness of present capabilities
Capability components | Firm’s present capability | Capability needed for optimum strategy | Capability ratio = |
|---|---|---|---|
General management Finance Marketing Production R&D Other | |||
Overall ratio | |||
- 1.
In the second column, enter sub-capabilities which determine the firm’s present capability profile.
- 2.
In the third column, enter the profile necessary to support the optimum strategy which has been determined in Table 9.5.
- 3.
In the last column, compute and average the ratios to produce the overall capability ratio .
- 4.
Using the investment, the strategy, and the capability ratios , compute their product which is the future competitive position which the firm will occupy if it pursues the present strategy:


When all three of the ratios have the value of one, the firm’s future competitive position will be outstanding, and it will be among the top performers in the SBA. When any factor is zero, the firm will not be profitable.
Readers who are not mathematically trained are warned that in the above formula the scale in between 1 and 0 is not linear, because the formula is in the form of a product. To translate the numbers into positions in the matrix, the following approach can be used.


![$${\text{ROI}}_{f} = {\text{ROI}}_{\text{opt}} \left[ {\frac{{{\text{Strategy}}_{f} \times {\text{Capability}}_{f} \times {\text{Strategy}}\,{\text{investment}}_{f} }}{{{\text{Strategy}}_{\text{opt}} \times {\text{Capability}}_{\text{opt}} \times {\text{Strategy}}\,{\text{investment}}_{\text{opt}} }}} \right]$$](../images/435756_3_En_9_Chapter/435756_3_En_9_Chapter_TeX_Equj.png)
The term in brackets will be referred to as the firm’s relative competitive posture in an SBA. Competitive posture is defined as the combination of factors which determines a firm’s ROI in an SBA.
The GE-McKinsey Matrix
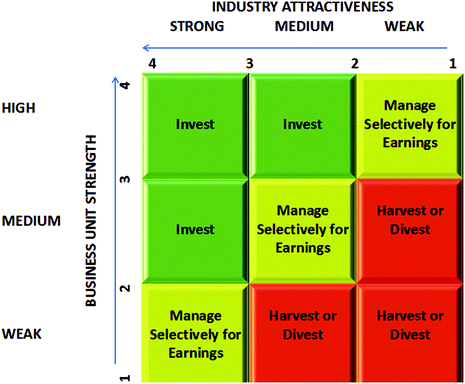
The results of the preceding two sections enable us to position the SBA in a version of the positioning matrix which meets the fundamental criticism which has been advanced against the BCG matrix , namely, that it uses oversimplified measurements along its two principal dimensions. The matrix, shown in Fig. 9.11, uses industry attractiveness to replace the BCG’s market growth and business unit strength to replace the relative market share. The method of entering SBA data used in the BCG matrix applies also to this new matrix. We name it after the McKinsey company which was one of its co-inventors. As is shown in the new matrix, it is usable for the same types of decision as the preceding one.
Unlike the BCG, the new matrix is applicable in all stages of the demand life cycle and in a wide range of competitive climates (we shall be discussing its limitations in this chapter), but as the preceding pages have shown, the labor involved in using the new scales is considerable. Therefore, the Boston matrix remains a valid and simpler alternative for SBAs which expect stable non-turbulent growth and in which relative market share will determine the firm’s competitive strength.
A criticism of early versions of both matrices is that they oversimplify the complex reality of the firm by dividing it into four neat piles. This objective was met by firms like Shell (and others) which began to use a 3 × 3 or even 4 × 4 format.
Such a matrix is illustrated in Fig. 9.11. As the figure shows, the finer sub- division robs the matrix of the appearance of unambiguous prescriptions found in three of the four cells of the 2 × 2 (optimized, milk, divest).
Both the BCG and the McKinsey matrices raise the natural question of the origin and validity of the commands contained in the matrix: optimize, divest, etc. The GE-McKinsey matrix increases the number of these commands to nine and also adds an additional question of how to choose between the alternative commands in each box (e.g., invest or hold). It does not answer the question of their validity though.
A star may be inferior to other SBAs of the firm and should be milked by transferring resources to them.
The future prospects of a cash cow SBA may be so poor that even the firm’s superior competitive positive will produce no profits. Thus, there will be nothing to milk and divestment is indicated.
The implications of the question mark are that it should be promoted to a star, but the firm may not have the necessary resources, or may be too far behind the competition to catch up in time, or may never recover the very high cost of catching up with the leading competitors.
Finally, the dog may have very strong synergistic links with other SBAs and should be kept if only for the reason that it absorbs a part of the overhead which it shares with other/more attractive SBAs.
The preceding remarks suggest the desirability of replacing the arbitrary commands suggested in the matrices with a decision-making method which takes into account the realities of business in each particular situation. Such a method is described in the following section.
*Choosing the Preferred Competitive Position
The method bases the decision to change the firm’s competitive position on the improvement in the return on investment which will be brought about by the change.
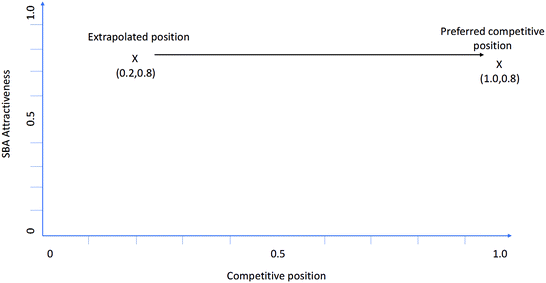
The four or nine cell matrix is replaced by a two-dimensional plot, with scales of attractiveness and competitive position ranging from 0.0 to 1.0.
SBA positioning plot
The decision process starts with management making a preliminary choice of the future competitive position in an SBA and analyzing the impact of this choice on the firm’s return on the investment in the SBA. The figure illustrates a decision to try for a leading competitive position in this very attractive SBA.
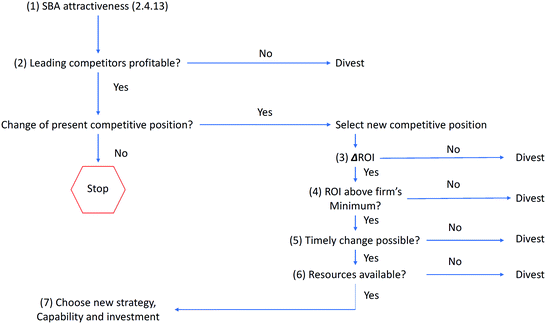
Choosing the preferred competitive position
- 1.
The results derived in estimation the SBA attractiveness determine whether leading competitors in the SBA will be profitable.
If the leaders will not be profitable, the firm must divest from the SBA.
- 2.
If the top competitors will be profitable, estimate:
P, which is the profit which will result from maintaining the present competitive position.
I, which is the firm’s current investment in the SBA.
ΔI, the additional investment which will be required to reach the chosen competitive position.
ΔP, the increase in profit which will accrue to the firm.
- 3.
Using the above estimates, compute:

If ΔROI is positive, move to the next step. If ROI is negative, change the target competitive position and try again.
If repeated trials for different competitive positions are all negative, the firm should not try to change its competitive position in the SBA.
- 4.
Check the best possible ROI from the preceding step against the minimum ROI which the firm requires from all of its SBAs.
If the highest possible ROI is below the minimum acceptable to the firm, the firm must divest from the SBA.
If the firm is going to be too late to capture the desired market shares, a less ambitious target position may be tried, or
A decision must be made to divest from the SBA.
- 6.
If the timing is right, make a feasibility test by comparing the resources which will be needed to attain the target position to the resources which will be available in the firm.
If the position change is unfeasible, either another target position should be tried, or
The firm must divest from the SBA.
- 7.
If the change is feasible, the next step is to determine the strategy, capability, and strategic investment which will enable the firm to reach the chosen competitive position. This is discussed in the following section.
The procedures outlined above help management to make its positioning decisions on the basis of key business variables (ROI, resource availability, timing of market development, etc.) instead of arbitrary commands.
*Choosing the Competitive Posture
Referring to the competitive posture equation, the multiplicative relationship among strategy, capability, and investment means that the firm’s ROI depends on all three, and that the ROI is severely reduced if one of the three components is mismatched.
Thus, a brilliant strategy and a matching capability design cannot be implemented if the investment is not available. Similarly, large amounts of money thrown at an SBA, without the guidance of strategy and capability, are highly unlikely to assure an attractive ROI for the firm.
A reader familiar with the early literature on strategic planning will recognize that the concept of competitive posture is quite new. In fact, even today, the bulk of research and literature is focused on the problem of strategy formulation.
The reason for the historical neglect of capability in determining the firm’s success in an SBA is due to the fact that the original concept of strategic planning was formulated at a time when the environment of a majority of firms was on turbulence level 3. As discussed in Chapter 6, in level 3 environments the past is extrapolable into the future. As a result, historical strengths of the firm could be expected to remain strengths in the future and thus there was no need for concern with the firm’s capability.
The reason for the historical neglect of strategic investment (the last factor in the posture equation) is due to the fact that firms were not financially constrained. Apple finds itself in this position of strength with a free cash flow of over $53 billion for 2018, allowing the firm to pick and choose its opportunities without the limitation of cash.
As the environment moved toward turbulence level 4, historical strengths typically became weaknesses. At the same time, firms increasingly found that financial demands from their SBAs exceeded the available resources (see the critical mass discussion). Thus, an effective strategy promised, but did not guarantee success.
- 1.
When the future turbulence level is expected to be on level 3 or lower.
- 2.
When the available financial resources exceed the sum total of demands from the SBUs of the firm.
However, when the environment is expected to be on level 4 or higher, strategy formulation must be broadened to include design of the matching capability and determination of the level of investment which will be needed to enable the firm to implement the strategy and build the capability.
- 1.
The firm’s present competitive posture has been diagnosed.
- 2.
Several future alternative success postures have been identified.
- 3.
The relative competitive position which the firm will seek to attain in the SBA has been chosen.
The above results are used as inputs to the selection of optimum competitive posture for the firm.
- 1.
The present strategy of the firm is compared to each of the future success strategies to identify the success strategy which requires the minimum additional strategic investment by the firm.
- 2.
If the firm seeks to become a top competitor in the SBA, the minimum investment success strategy is relabeled the best fit strategy.
- 3.
If the firm seeks a competitive position which is less than a leadership position in the SBA, the minimum investment strategy is scaled down appropriately and labeled best fit strategy.
The next step in analysis depends on the nature of the competitive environment which the firm expects to encounter in the SBA.
If the market is expected to be multi-competitor, which means that strategies of the firm’s competitors will not significantly affect the success of the firm’s own strategy, the best fit strategy is chosen as the optimum strategy for the firm. This is illustrated at the top of Fig. 9.13.
If the SBA’s market is expected to be oligopolistic and competitors few, the firm’s success is usually dependent on strategies of the other competitors. In this case, the best fit strategy may not be the optimal one for the firm and choice of the firm’s preferred strategy must be made in light of the probable strategies of the competitors.
- 1.Decide which of the success strategies are most likely to be used by the firm’s most important competitors. The example in Fig. 9.14 shows that the competitors are expected to use different success strategies.
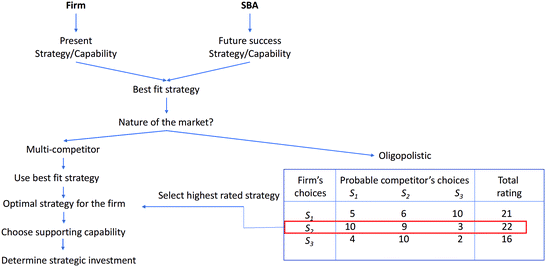 Fig. 9.14
Choosing best fit strategy
- 2.Estimate the success which the firm is expected to achieve if it uses each of the success strategies. An entry of 10 in Fig. 9.15 identifies the strategy which will be the most successful against the strategies adopted by the respective competitors.
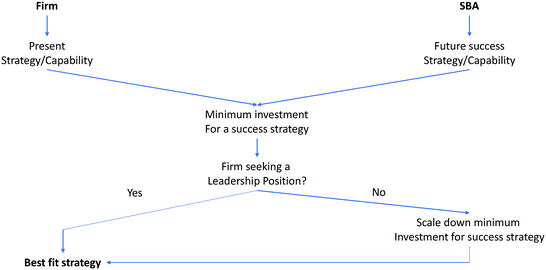 Fig. 9.15
Choosing the firm’s competitive posture
- 3.
Add the expected success ratings for each of the potential strategies for the firm and enter the result in the right-hand column of the matrix.
The strategy with the highest rating is the optimal strategy for the firm.
Once the optimal strategy has been chosen, the final step in competitive analysis is to determine the capability which will be needed to support the strategy and the required strategic investment.
Competitive strategy
Organizational capability
Strategic investment
Before the position is accepted for implementation, it is necessary to test it against several practical constraints, and this is discussed in the next section.
*Testing the Feasibility of the Preferred Posture
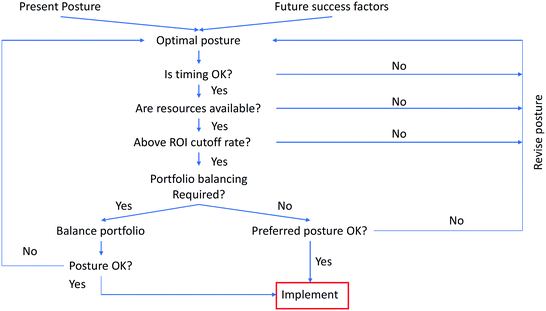
Choosing the preferred posture
- 1.
The first is the timing test. This involves comparing the time which is needed to implement the posture to the time which is available before the market is preempted by competitors.
If the required time exceeds the time available, the firm is in danger of being a late entry in the market, and the firm’s ambitions in the SBA must be scaled down. As the figure shows, this is done by choosing a posture other than the optimum.
- 2.
If the time test is passed, the next test is for availability of resources. If the required strategic investment cannot be provided by the firm, the optimum posture must be scaled down. This test is particularly important in SBAs which rave a high critical mass , or which are R&D or asset intensive.
- 3.
If resources are available, the rate of return on investment promised by the optimum posture may be lower than the minimum rate which the firm normally requires from all of its SBAs. Again, this requires a revision of the posture.
- 4.
Finally, a decision needs to be made whether a rebalancing of the entire SBA portfolio is necessary before the optimal posture is accepted for implementation. This situation typically arises when the strategic investment requirement of the SBA represents a significant portion of the firm’s resources which will be available for future strategic investment. (The next section discusses portfolio rebalancing.)
*Balancing the SBA Portfolio
- 1.
Rank the SBAs in the order of the expected ROI the firm can obtain from time feasible preferred positions.
- 2.
Determine the total strategic investment resources which will be available to the firm during the next five to seven years. This will include investment available (above the needs of maintenance and replacement) from retained earnings, borrowings, and equity expansion.
- 3.
Starting at the top of the ROI list, fund the successive SBAs to the optimum (or reduced optimum, because of timing) level and proceed until the money runs out.
The analysis will almost certainly exclude funding for some SBAs which rank way down the list, because their near-term ROI is low, or even negative. And yet, these SBAs may be in the early stages of their life cycles and an important source of profit in the longer term. To correct such omissions, the procedure described above needs to be supplemented by a life cycle balance, which we shall discuss in the next chapter.
The analysis may lead to the conclusion that an SBA should be retained and milked. Frequently, however, firms will find that such SBAs tie up scarce and trained managerial talent which can be put to more profitable use elsewhere in the firm. It may be advantageous to sell the cash cow to another firm and transfer the key talent to other SBAs.
These distortions can be avoided, if the procedure described above is supplemented by the following steps:
If dog shares important overheads with other SBAs, a synergy audit (discussed in the next chapter) should be made to make sure that the penalty imposed on profitable SBAs by the liquidation of the dog will not offset the benefits of liquidation of the losses.
- Some of the SBAs funded for additional investment may be less attractive than diversification opportunities which will be uncovered during the period for which budgets are being committed. To provide for this, firms have used a twofold solution:
- a.
A cutoff ROI rate is established below which the present SBAs are not funded for strategic investment. The same rate is used to screen diversification opportunities.
- b.
A strategic reserve is set aside for funding future diversification opportunities.
- a.
The comprehensive strategic investment allocation requires that all the SBAs be analyzed before the process starts. But in many firms, it is imperative to make decisions in certain SBAs at the early stages of the planning process, before all of the SBA analyses are completed. The cutoff rate of ROI described above is a useful approach in this case. It permits the SBA decision to be made without reference to all others.
A development in one of the SBAs which does not justify a laborious re-examination of the entire portfolio may occur after the portfolio is balanced. Again, a cutoff rate of ROI is a solution.
The preceding discussion shows that there are two ways to decide on the optimal posture in an SBA. One is to perform a complete portfolio rebalance, and the other is to test the acceptability of an SBA’s posture against the cutoff ROI rate.
Periodic (every three to five years) rebalancing.
Whenever new environmental developments call for a rebalancing.
Whenever a particular SBA presents threats or opportunities of a magnitude which upset the portfolio balance.
In between such major occasions, the cutoff rate of return should be used for individual SBAs. As shown in Fig. 9.16, the decision in both cases is either to reanalyze the optimal posture or to proceed with implementation of the optimal posture.
Limitation of Competitive Analysis
- 1.
The process of choice of the firm’s future strategic posture described above is anticipatory in the sense that it is based on anticipating the future prospects and success factors, and positioning the firm to take advantage of them. But entrepreneurial firms not only do not limit themselves to anticipating the future, but also create novel futures: novel demands, novel products, and novel technologies. A procedure for handling novel technologies is described in Chapter 12.
- 2.
The second limitation of the competitive positioning method described above is of a different nature. It originates with the way by which uncertainty and unpredictability are treated. The implied assumption in the above method is that the future state of an SBA can be predicted accurately enough to position it as a point (even if represented by a circle to show the size of the market), in one of the quadrants. In mathematical terms, this implies a dual assumption: (a) that the most probable prospects and competitive position can be estimated, and (b) that the probability of this estimate is so high that lower probability estimates can be neglected in making positioning decisions.
- 3.
The third limitation is inherent not only in the positioning process but also in all logical analyses whose outcome affects lives of managers. The limitation comes from the fact that real-life managerial decision making contains three rationalities: the cognitive rationality based on the logic and facts; a behavioral rationality based on managers’ perceptions and feelings; and a political rationality based on ambitions, power drives, and prestige.
The first two assumptions are not unreasonable when the expected turbulence level in the SBA is relatively low (between l and 3). However, as turbulence level increases, both assumptions lose validity. Above level 3, alternatives other than the most probable become just as likely (the probability distribution curve is no longer peaked at the most probable outcome).
Above level 4, not only are there several comparably probable alternatives, but the alternatives themselves are difficult to describe accurately enough to permit the firm to make a clear-cut posture choice.
Thus, the method of determining the future competitive position by using a single most probable estimate for each SBA becomes not only infeasible but also dangerous at higher turbulence levels.
To deal with positioning at high turbulence levels, it is necessary to introduce a major revision into the positioning method. We shall be describing such a revision in Chapter 10.
In processes, such as competitive positioning, in which all three rationalities are brought into play, facts, logic, and reason will be only some of the determinants of the outcome. For example, managers of dogs who stand to lose power, prestige, and even their jobs cannot be expected to be impartial in estimating the future prospects and future competitive positions of their divisions. Managers of cash cows , who frequently have a record of recent, distinguished successes behind them, will not submit easily to the conclusion that their operation ought to be milked. In bidding for continued strategic investment, they will use the often-heard argument that recovery of growth in their SBAs is ‘just around the corner’. Managers in charge of new question marks without a record of success and without a power base are likely to be the losers in the resource allocation process, even if their SBAs are the savior stars of the future.
Thus, the limitation of the logical positioning process is that it is likely to become a ‘paralysis by analysis ’ in which conclusions are distorted by political forces, and implementation of politically and behaviorally threatening conclusions will languish.
This does not imply as some proponents of organic evolution are quick to suggest, that rational analysis should be abandoned in favor of a muddling through unsystematized progress. It implies that successful systematic strategic positioning will occur only when the behavioral and political rationalities are made a part of the process. We shall be discussing how this can be done in Part VI and in the next chapter.
Summary
When the different markets of the firm are all growing and are not turbulent, the future prospects can be determined through extrapolation of the historical trends. But when the growth prospects are mixed and turbulent, before future prospects can be estimated, it becomes necessary to segment the firm’s environment into distinctive areas of trends, threats, and opportunities, which are called strategic business areas (SBAs). It further becomes necessary to identify units within the firm which are to be responsible for the strategic development of the respective business areas. Such units are called strategic business units (SBUs) .
Complexity , uncertainties and turbulence in the resource technology and, sociopolitical environments may also make it desirable to segment these environments into strategic resource areas (SRAs), and strategic influence groups (SIGs), respectively.
The next step in strategic analysis is to determine the firm’s prospects in each of the business areas. These are determined, in part, by the potential which will be available within the SBA to competent competitors, as measured by the future growth of demand in the SBA, profitability, and economic, technological, and sociopolitical turbulence .
The second determinant of the firm’s prospects is its future competitive position within the SBA. This is measured by the product of three ratios: the ratio of the firm’s investment relative to the optimum investment level for the SBA, the ratio of the firm’s strategy to the optimal strategy, and the ratio of the firm’s capability to the capability which will be needed by top competitors in the SBA.
Having determined its future prospects, the firm has the options of accepting the prospects, exiting from the SBA, or changing its future competitive position.
- 1.
The competitive position which management of the firm would like to occupy in the SBA is chosen.
- 2.
The effects on the firm’s ROI as a result of choosing this position in the SBA are computed.
- 3.
If the ROI is satisfactory, the likelihood of a timely arrival in the new position is next tested.
- 4.
Finally, availability of resources necessary to attain the chosen position is tested.
- 5.
If all of the preceding tests yield positive results, the firm’s strategy by which the new position will be reached, the necessary supporting capabilities and the required resources are chosen.
- 6.
If one or more tests do not yield satisfactory results, a new competitive position is chosen and re-analysis is undertaken following the above steps.
- 1.
Future success strategies in the SBA are compared to the firm’s strategy to select the best fit strategy for the firm.
- 2.
If the environment is expected to consist of many competitors, the best fit strategy is chosen.
- 3.
If the environment is expected to be oligopolistic, the future success strategies are compared to the strategies which will probably be used by the most powerful competitors in the SBA. The success strategy which will perform best against all competitors is chosen as the strategy for the firm.
- 4.
The capability and strategic investment which will be needed to assure success of the chosen strategy are selected.
- 5.
The selected strategy is tested for timing, availability of resources, and rate of return on the firm’s investment.
- 6.
If necessary, the firm’s entire SBA portfolio is rebalanced.
The method of strategic positioning described in this chapter has three major limitations:
- 1.
It does not apply to creation of new SBAs,
- 2.
It distorts environmental reality when turbulence levels are high, and
- 3.
It neglects behavioral and political influences on the decision process. Consideration of these limitations is deferred until later.
Exercises
- 1.
What is the difference between a strategic business area and a strategic business unit? How are the two related? What criteria should be applied to determine whether strategic segmentation of a firm has proceeded far enough? What conclusions would you draw when segmentation of a small firm produces a large number of SBAs?
- 2.
Under what conditions does it make sense to organize the firm into SBUs each responsible for a cluster of coherent SBAs? Under what conditions does a dual structure (an SBU structure for the firm’s strategic development and another structure for the profit-making activities) become necessary? What problems arise from using a dual structure?
- 3.Using a firm with which you are very familiar (or a case suggested by your instructor), segment the environment of the firm into SBA, SRA, and SIG.
- a.
On what basis would you judge whether the firm is ‘over diversified’ or ‘under diversified?’
- b.
Choose one key SBA and follow the procedure outlined previously to estimate its future attractiveness.
- c.
Estimate the strategic investment ratio in the SBA.
- d.
Estimate the future competitive position of the firm and position the firm in the McKinsey matrix.
- a.
- 4.As a member of the corporate planning department, you have been given an assignment to assure that the firm’s environmental surveillance , forecasting , and analysis system will reflect accurately the characteristics of its future environment.
- a.
Outline the process of analysis by which the characteristics of the system should be determined.
- b.
Prepare a preliminary list of specifications and criteria for the system.
- c.
Describe the organizational structure for the system (roles, tasks, authority, responsibility, reporting relationships, etc.)
- d.
Prepare a flowchart of environmental information through the system.
- a.
- 5.
Under what conditions should the BCG matrix be used and when should the McKinsey matrix be used?
- 6.
How would you go about competitive posture analysis of an SBA which is totally new?
- 7.
How would you analyze the firm’s future competitive position within an established SBA for which the firm has developed a revolutionary technology?


