Competitive posture analysis determines the future strategy and capability for each SBA of the firm and the strategic investment which will be required.
In this chapter, we enlarge our perspective from individual SBAs to their totality. The following questions are answered: (1) What are the alternative approaches to integrating and interrelating the SBAs? (2) Under which conditions should the respective approaches be chosen? (3) What are the principal components of an SBA portfolio strategy? (4) What are the objectives and goals commonly used by business firms? and (5) What are the processes by which the firm’s SBA portfolio can be optimized?
Three Approaches to Portfolio Management
Analysis presented in the last chapter developed competitive postures for the firm’s SBAs, one at a time. The next step in strategy formulation is to integrate the SBA results into an overall strategic portfolio.
Three different ways of managing the strategic portfolio are observed in practice:
- 1.
To manage by exception: so long as satisfactory financial results are produced. The SBU (or divisional or subsidiary) managers are left to develop and implement their own strategic plans. Whenever the results turn unsatisfactory, corporate management applies one of the following corrections: financial controls, replacement of management, or divestment from the SBA.
- 2.
The second way to manage the strategic portfolio is through portfolio balancing. Corporate management periodically examines SBU performance forecasts and allocates additional reserves to the most promising SBAs, cuts back investment in mediocre SBAs, and divests from SBAs which will be unprofitable for the firm (these are the dogs in Table 9.3).
- 3.
The positioning matrices discussed in the previous chapter are very useful in portfolio balancing, since they plot the entire portfolio of the firm on a single sheet of paper and offer suggestions for repositioning of the strategic resources .
- 4.
The third and most complex way to manage the SBA portfolio is through portfolio optimizing: corporate management formulates a corporate portfolio strategy which specifies portfolio evolution over time, new SBA additions, divestments similarities, and differences which will be maintained among the firm’s SBAs.
A key difference between portfolio optimization and the other two portfolio management methods is that optimization uses the historical SBA portfolio as a point of departure for designing a different future for the firm, whereas both management by exception and strategic budgets accept the historical portfolio as the basic core of the firm’s future business.
Which Approach to Use
Managers whose prior experience is in human resources management are likely to choose management by exception.
Managers experienced in finance, legal, accounting, and production functions gravitate to portfolio budgeting.
Managers from marketing and research and development are likely to opt for portfolio optimization. However, letting key managers’ preferences be the only criteria in choosing the portfolio management style may endanger a firm’s success and even survival. Other important determinants in the choice of the portfolio management method are the following:
The objectives and goals of the firm.
The characteristics of the future business environment in the firm’s SBAs.
The characteristics of the technological and political environments which surround the SBAs.
The following criteria should be added to the managerial propensities in selecting the portfolio management style for a firm:
- 1.
All SBAs of the firm offer comparable and attractive prospects.
- 2.
Management is prepared to accept the sum total of the SBAs’ prospects as the corporate goal.
- 3.
It is safe to assume that no major surprises will occur in the firm’s SBAs.
- 4.
Management is not interested in establishing synergies among the firm’s SBUs (or divisions, or subsidiaries).
Portfolio balancing must replace management by exception whenever all of the above conditions are met with the exception of condition 1, which becomes a case where SBAs of the firm have widely differing prospects. In this case, to assure efficient utilization of resources, corporate management must become active in strategic resource allocation among the SBAs.
- 1.
Corporate management is entrepreneurial and seeks financial performance which substantially exceeds the sum total offered by the firm’s present portfolio.
- 2.
Corporate management seeks to develop a synergistic, coherent firm with an identifiable comparative advantage.
- 3.
The firm’s SBAs have different growth and profitability prospects . Some will be attractive in the near term and others in the long term.
- 4.
The environment of the firm is expected to be unpredictable.
- 1.
Preferences of the corporate management.
- 2.
Prospects in the future markets of the firm.
Two approaches to portfolio optimization are observable in practice: informal/judgmental/intuitive and formal/analytic. In the spirit of this book, we will focus our attention on the latter.
- 1.
Portfolio strategy
- 2.
Objectives and goals
We discuss these concepts in the following two sections.
Portfolio Strategy
Portfolio strategy is a set of decision rules which guide the composition and development of a firm’s SBA portfolio. It consists of three sub-strategies: scope, coherence, and diversity.
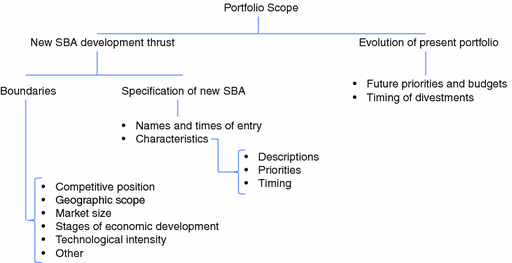
Portfolio scope
- 1.Evolution of the present portfolio:
Assignment of priorities to the present SBAs which the firm intends to retain.
Timing of divestment from SBAs from which the firm intends to exit.
- 2.Specification of new SBAs which the firm intends to enter:
Names of SBAs which can be identified at this time and target entry dates.
Types of SBAs unidentified at this time and which the firm will seek to identify.
Some firms intend to do business only in SBAs in which they can become one of the top competitors. This has immediate consequences to the size of the SBAs which the firm will enter. They must be small (or large) enough to take advantage of the firm’s resource base.
Some firms confine their interest to certain regions of the world and exclude others.
- 1.
Sharing of capabilities which will be developed and maintained among the productive functions of the firm, such as production, marketing, R&D, and purchasing. We shall refer to this aspect of coherence as the functional synergy.
- 2.
Commonalities among the future competitive sub-strategies which the firm will pursue in its respective SBAs. For example, basing the market differentiation sub-strategies on ‘best buy for the money’ pricing of the firm’s products or services. Since this is an environmentally visible aspect of the firm’s coherence, it is a poor instrument for projecting a distinctive image to the firm’s customer groups. We shall refer to this aspect of coherence as the strategic synergy.
- 3.
Commonalities and complementarities between the capability of the corporate management and the general management of the firm’s operating units. As we shall presently see, this aspect of complementarities is very important in highly competitive environments in which appropriate guidance and responsiveness from corporate management to the needs of SBA managers become a key determinant of the firm’s success. We shall refer to this aspect of coherence as the management synergy.
- 1.
Geographical localities in which the firm does business.
- 2.
Key technologies in the firm’s respective SBAs.
- 3.
Sociopolitical climates among the firm’s SBAs.
- 4.
Differing stages of economic development in the firm’s various SBAs.

Dimensions of portfolio strategy
Mission, Goals, and Objectives
The firm is the primary instrument for generating society’s economic wealth. Historically, the behavior of the firm was determined by the wealth aspirations of its owners, who were also its managers. During the twentieth century, owner-managers were replaced by professional managers employed by the firm. As these managers became powerful, they increasingly directed the firm in ways which satisfied their personal aspirations (for prestige, power, security, ‘fun of the game,’ etc.) which were different from aspirations of the owners.
After World War II, other constituencies (white- and blue-collar workers within the firm, environmental lobbies, suppliers, and governments from outside of the firm) increasingly forced the firm to serve their aspirations. As a result, today and in the future, the firm will be, in fact, a servant of many masters. This is contrary to the currently popular fiction in the USA that the firm should and does single-mindedly serve the interests of its owner-shareholders.
Therefore, a realistic process of formulating goals and objectives must start identifying the mission of the firm: the list of aspirations of the influential constituencies (commonly called stakeholders in the USA) which the firm serves. In Chapter 13, we will describe a process of stakeholder analysis under the title ‘power field analysis.’ This process can be used to determine the impact which each stakeholder group might exert in the determination of the mission of the firm.
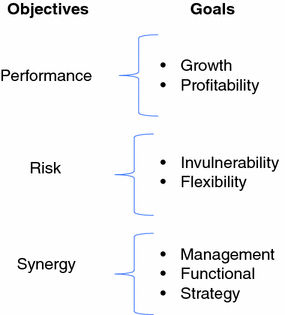
Once the mission is formulated, the second step is to translate the mission into criteria which management can use for guiding the firm’s performance. The results of this translation are the goals and objectives of the firm.
- 1.
Performance objectives attained through activities which assure the desired trends of growth and profitability.
- 2.
Risk objectives attained through activities which assure strategic invulnerability of the firm’s growth and profitability on the one hand and the firm’s participation in areas of major opportunities on the other.
- 3.
Synergy objectives attained through activities which assure sharing of capabilities among the SBUs of the firm.
- 4.
Social objectives include philanthropic activities which are outside the profit-making behavior and typically absorb a part of the profit made by the firm .
Each of the categories is discussed below.
Performance Objectives
- 1.
The growth objective. The goal for the growth objective is typically expressed as the future annual percentage growth rate of sales.
- 2.
The profitability objective. During the first half of the twentieth century, the commonly used goal, particularly in single industry firms, was expressed in terms of the ratio of profit to sales. Today, the general practice is to use the ratio of net profit to the equity investment as the profitability goal.
Risk Objectives
- 1.One of these is the strategic invulnerability objective which seeks to limit the damage to the firm’s performance which may be caused by a strategic threat. It may be described as insurance against strategic surprises . Examples of strategic threats are:
Invasion of one or more of the firm’s markets by new technologies.
Invasion of the firm’s markets by new competitors.
Economic collapse of one or more regions in which the firm does business.
A political revolution which brings to power a government hostile to a market economy.
Nationalization of the firm’s assets in one or more countries in which it does business.
Protectionist measures which limit the firm’s access to one or more of its major markets.
- 2.
The second risk objective which must be given consideration is the strategic opportunity objective.
The invulnerability objective must be pursued by all prudent firms whose future is expected to be turbulent and surpriseful. Another risk objective is needed in firms whose management is entrepreneurial and seeks to position the firm in SBAs with potentially attractive strategic opportunities. We shall call this the strategic opportunity objective. Whereas the invulnerability objective seeks strategic insurance from threats, the opportunity objective places strategic bets on opportunities.
Birth of a new industry spawned by a new technology.
Major demographic shifts which create new markets.
An economic growth takeoff in a developing country.
Deregulation of an industry.
Denationalization of an industry.
A shift of power to a pro-business government.
Emergence of a national industrial strategy .
The goal for the strategic opportunity objective can be specified as the probable percentage of profits which will be contributed by the firm’s investments in future opportunity SBAs.
Synergy Objectives
- 1.
The first is the management synergy objective which seeks to optimize the similarities between the capabilities of the corporate management and the managements of the respective SBUs . Examples of such similarities are skills in managing the following:
In highly turbulent environments.
High-technology businesses.
Market-driven businesses.
Aggressive strategic risk-taking businesses.
Mature businesses.
The goal of management synergy can be stated as the average degree of capability overlap between the corporate management capability and the SBU general management capabilities .
- 2.
The second synergy objective is a functional synergy objective which seeks to maximize the common threads among functional capabilities in different parts of the firm.
Examples of common threads are:Technological know-how.
Product development skills.
Production facilities.
Purchasing know-how.
- 3.
The third synergy objective is strategy synergy which seeks to maximize commonalities among the competitive strategies of the respective SBAs of the firm.
Social Objectives
Finally, firms which choose to serve constituencies whose needs cannot be satisfied entirely through economic performance would enunciate their social objectives.
- 1.An employee well-being objective which seeks to serve the needs and aspirations of the employees of the firm. Examples are:
- a.
Guarantee of job security.
- b.
Providing opportunities for advancement.
- c.
Assuring satisfying and self-fulfilling work.
- d.
Respect for the individual.
- a.
- 2.
Societal objectives which seek to respond to the needs of society such as education or preservation of the environment. These objectives are not necessarily enhanced by the growth and profit-seeking activities of the firm.
The goal of the societal objective may be expressed as the percentage of the firm’s operating profits which will be used to pursue the various societal objectives .
Objectives and goals
The profusion of goals shown in the figure is a fairly recent phenomenon. During the first half of the twentieth century, growth was commonly the only goal pursued by the firm. In part, this was due to the fact that in those days superior growth inevitably produced superior profitability. This relationship between growth and profitability began to break down when some low-growth areas offered excellent profitability (e.g., in oligopolistic industries), and some exhibited the phenomenon of ‘profitless prosperity’ (excellent growth and very low to no profitability, as exampled in 2001 when General Motors offered rebates of up to $8000 as well as historically low financing on its SUVs, it was ‘giving up its profit in exchange for sales volume’).
Once the causal link between growth and profitability was broken, it becomes imperative to identify which of the two was the more important to the firm’s prosperity and survival. Any student of business would immediately be able to identify profitability as the vital performance goal because a highly profitable low-growth firm can survive forever, but a high-growth, negatively profitable firm will soon go bankrupt.
This conclusion is supported by the action of a great many firms during the Great Recession (2008–2010) which used strategic restructuring (sometimes called strategic rationalization) to reduce the size of the firm through divestment from unprofitable SBAs and became impressive profit performers.
Figure 11.3 presents a master list of objectives/goals which are observed in business practice. In each firm, the objectives are determined by its mission. The goals established for particular objectives depend on two factors: the preferences of the stakeholders of the firm and the performance opportunities offered by the firm’s markets.
As we shall presently see, determination of the goals, which respond to the stakeholders’ preferences and which are at the same time realistic in light of the environmental opportunities, is a complex feedback process. An effective way to start this process is by determining a set of provisional goals which reflect the aspirations of the stakeholders of the firm.
Strategy, Objectives, and Corporate Vision
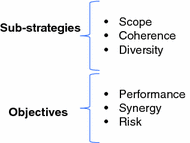
Coupling of strategies and objectives
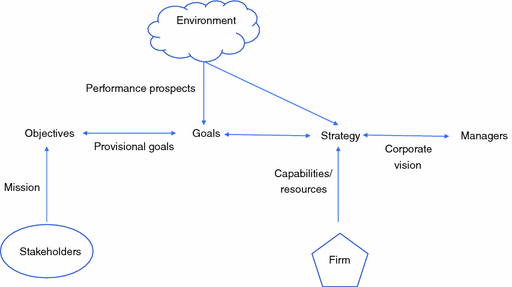
Logic of portfolio analysis
- 1.
The environment in which the firm does business which determines the maximum goals which the firm could attain in a particular SBA. As the figure shows, this environment is chosen by the portfolio strategy.
- 2.
The stakeholders who determine the firm’s mission and hence its objectives.
- 3.
The firm’s future resources and present capabilities which limit the range of strategies that the firm can afford.
- 4.
The key corporate managers who set and control the firm’s goals.
Corporate vision affects the choice of strategy; the firm’s strategy chooses the environment; the environment determines the attainable objectives and goals; the goals affect the strategy and are subject to the resource constraints.
The role of corporate management is to strike a balance between vision, objectives, goals, and strategy which will result in the optimum attainment of the objectives for which they are held responsible by stakeholders. As the figure suggests, the triangular influence among environment, goals, and strategy makes such a balance a very complex process. In the following section, we show a process which reduces Fig. 11.5 to a linear process.
But just as in the case of the provisional goals, the process must start by a diagnosis of the present portfolio strategy of the firm. This diagnosis is described for each sub-strategy in the following sections.
Portfolio Scope
- 1.
Assuring that the firm’s future SBA portfolio is the best that the firm ‘can buy for its money.’
- 2.
Assuring that the firm meets its objectives both in the near and in the long term.
The problem of assuring a cost-effective portfolio is a relatively recent one. During the first half of the twentieth century, economies in the industrialized part of the world all enjoyed a continuous thrust of growth. To be sure, periodic recessions caused slowdowns, but every recession was usually followed by a recovery to the original growth curve. As a result, as late as in the 1960s, it was customary to characterize the quality of different industries by a single index: their growth rates. In addition, the growth rates were expected to remain the same for the indefinite future.
- 1.
Making sure that SBAs which will offer poor future prospects to the firm are divested in a timely manner.
- 2.
Making sure that the growth/profitability deficiencies caused by the divested SBAs (and by SBAs whose future growth/profitability prospects are likely to be less attractive than in the past) are corrected through adding new SBAs to the firm’s portfolio.
These two imperatives changed the firm’s SBA portfolio from a permanent set of ‘the businesses we are in’ to a dynamically changing mix (not unlike a portfolio of stocks and bonds). The key concern in changing the mix is to assure that preoccupation with optimizing near-term performance does not depress investment in SBAs which will assure continuity of performance in the long term.
Life Cycle Portfolio Balance
The BCG, McKinsey, and dispersed positioning matrices discussed in Chapters 9 and 10 focus on optimizing the near-term performance of the firm. If the attractiveness analysis shows that the total prospects offered by the current SBA portfolio are unsatisfactory or that short-term prospects differ significantly from the long term, it is necessary to complement the positioning analysis with an appropriate long- vs. short-term portfolio balance.
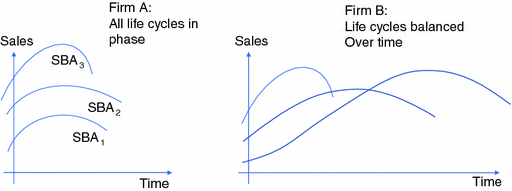
Comparison of two SBA portfolios
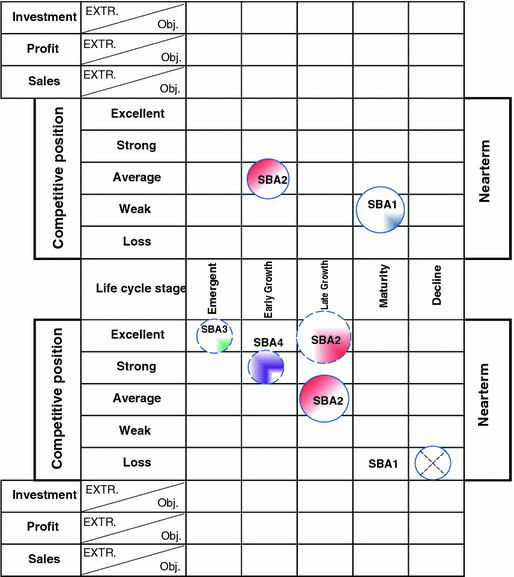
Life cycle balance
The simple example illustrated in the figure shows a firm which has only two SBAs. Following our earlier example, this may be a technology firm who sells components in the US market (SBA1) and has established a strong position in one of the South American countries (SBA2).
The solid circle entries in the lower part of the table are the estimated long-term positions of the SBAs. The example suggests that the domestic market will shrink to replacement demand (because of technology substitution) and the firm’s previous weak competitive position will degenerate into a loss. The South American market will expand and pass into late growth stage. If the firm continues its present marketing strategy, it will keep the market share, hence will have larger sales, and will retain its near-term competitive position.
In the example shown, the firm plans no changes in its strategic posture during the near term and devotes its energy to improving the long term. The dotted line crossing through SBA1 represents a decision to divest. The firm has made the drastic decision to get out of the shrinking, unprofitable domestic demand for components rather than try to master new technology. On the South American market, it plans to increase its market share and improve its competitive position from average to excellent. This decision corresponds to ‘development of present portfolio’ specification in the first line of Fig. 11.2.
After decisions are made about the present SBAs, it becomes obvious that in ten years’ time, unless additions are made to the portfolio, the firm will have shrunk. The management decides that two new SBA entries must be in place in ten years’ time: one in the emerging phase (SBA3) and another in the early growth (SBA4).
These are shown by dotted circles. The firm wants a significant market share in SBA4. In both SBAs, the total market must be small enough (indicated by the diameter of the circle) to permit the firm to become a significant competitor.
Nothing is said at this time about the specifics of these SBAs: What specific products will be developed, what markets, or what technologies will be acquired. But SBAJ and SBA4 are sufficiently specified to permit management to start a search for opportunities. This decision corresponds to ‘new SBA development thrust’ of Fig. 11.2.
*Balancing Life Cycle Positions
- 1.The first step is to spot the SBAs together with the necessary information into the respective near- and long-term boxes of the matrix. The information to be entered for each SBA (refer to Chapter 9) is the following:
- a.
life cycle stage;
- b.
future competitive position;
- c.
size of the market (size of circle);
- d.
firm’s market share (the shaded part) as well as the sales the firm will derive from the SBA;
- e.
the profits the firm expects from the SBA; and
- f.
presently planned strategic investment in the SBA life cycle stage.
- a.
- 2.
The second step is to summarize the sales and profits for each and enter the results into the ‘extrapolated’ half-boxes in the long- and short-term growth/profit lines. The summary of the summaries, which are expected average sales and profits of the firm over the near and long-term periods, are entered at the end of each line.
- 3.The third step is to determine the objectives for sales and profits for both the long term and near term and enter these into the lower half-boxes at the end of the ‘objective’ profit and sales lines. The objectives will be determined by:
- a.
the aspirations and aggressiveness of the management and influential shareholders in the firm;
- b.
the resources which will be available for closing the gap between the expected results and the objectives. These will be the strategic investment resources, over and above the resources which will be used to support near-term profit making.
- a.
- 4.The fourth step is to allocate the contributions to objectives among the life cycle stages, using two criteria:
- a.
the annual contributions from SBAs in each life cycle stage must add up to the objectives for sales and profits;
- b.
the overall portfolio must have continuity: There should be a sufficient commitment to emergence (which is frequently unprofitable) to assure later growth; enough in G1 and G2 to provide the backbone of profits and growth; and enough, but not too much, in maturity to provide cash flow for the firm.
- a.
- 5.
The fifth step is to determine the presently planned pattern of the firm’s investment in the respective life cycle stages. This can be done by adding up the presently anticipated investments, by stage, entering in the external part of the investment line and summing up the line.
- 6.
The sixth step is to rebalance the investment by entering into the ‘objective’ line the investments that will be required in each stage to support the results of steps 3 and 4 above.
- 7.
The seventh step is a resource feasibility check. This is done by adding and comparing the totals in the investment lines with the anticipated available strategic investment resources. If the total exceeds the resources, steps 3–7 must be repeated until the balance is attained.
- 8.
The eighth and final step is to identify from Fig. 11.7 the characteristics of the portfolio changes which will be made. This will include contractions, expansions, divestments of the present SBAs, as well as targets, size, and profitability for new SBAs to be acquired in the respective life cycle stages. Thus, the scope (see Fig. 11.1) of the firm’s strategic portfolio is specified.
It should not be assumed that all of the additions will be in the emergence and growth stages. A firm which already has a very strong investment in the emergence stage may, for example, seek additional entries into profitable low-risk maturity in order to develop a strong cash flow base.
The example discussed above involves a firm which has only two SBAs. In firms which have multiple SBAs, the ‘eyeball’ judgmental approach used in the example quickly becomes impossible as the number of SBAs increases. Here, as in the case of competitive analysis , an interactive computer program becomes desirable to help management master a level of complexity which cannot be spanned by an unassisted human mind.
Functional Synergy
The early prescription for strategic planning advised managers to start the process by identifying the holistic concept of ‘the business we are in,’ that is, identify the characteristics of coherence among the various SBAs of the firm.
As discussed in the preceding chapter, the modern approach starts with an anatomical analysis of the diverse businesses, in which the firm is already participating, using SBA/SBU concepts. But when the anatomic work of strategic segmentation is done, there still remains the question of coherence: What relationships should exist among the various SBUs and SBAs as the firm develops its portfolio over time (see Fig. 11.2).
Coherence is not an essential condition for a firm’s survival or indeed for success, since many managements have successfully chosen to disregard coherence by building conglomerate firms .
A spectacular example is found in the Walt Disney Company, a widely diversified conglomerate whose businesses ranged from television to parks and resorts, to retail, to cruise lines, to movie studios, to cable broadcasting.
As the conglomerates blossomed, a different, larger, and also successful group of firms committed itself to coherence. Such firms included a specific definition of the ‘business we are in,’ in their strategies, and managed their growth and diversification according to this definition.
In the 1960s, a working concept called synergy was proposed for evaluating the coherence of the firm. As originally proposed, it was an extension of the principle of manufacturing economies of scale to a broader concept of economies of overheads which result from mutual sharing of overheads among the functional areas of the firm’s SBUs .
Functional synergies may come from mutual sharing of facilities or competences. Subsequently, two additional types of synergy received increasing attention: strategy synergy and general management synergy.
The advantage claimed for functional synergy is that it produces a ‘2 + 2 = 5’ effect, which is another way of saying that the combined return on investment of the firm is higher than the return which would result if each division (or SBU) operated without taking advantage of sharing and complementarity. (For a more complete discussion of the concept of functional synergy, see Ansoff [1988-B] and see management synergy.)
In the early days of the synergy concept, some observers of mergers and acquisitions claimed that synergy was not a useful concept, because potential synergies, diagnosed during merger investigations, failed to materialize after the merger. But subsequent experience showed that the difficulty lay not in the synergy concept, but in the failure by corporate managements to exercise sufficient authority to make sure that the potential synergies were realized by SBU managers, whose natural inclination is to ‘row their own boat’ and to avoid dependence on other parts of the firm.
It must be recognized, however, that the desire of SBU managers to avoid synergy is not capricious, because excessive sharing of capabilities with other SBU managers and with the corporate management can curtail the degree of freedom which a manager needs to respond quickly, decisively, and effectively to the demands of his environment. Therefore, the degree of sharing with other SBUs must stop short of the level at which SBU performance begins to be degraded. In later discussion, we shall refer to this level of synergy as the maximum acceptable synergy level.
Synergy was also challenged on the grounds that conglomerate firms seemed to perform as well as firms which insisted on coherence among their SBUs. To test this assertion, an empirical comparison of the performance of conglomerate and synergistic firms was made (Ansoff and Weston 1962-B). The conclusions showed that in good times synergistic firms did perform about as well as conglomerate ones. But under stress, and/or recession, synergistic firms were more resilient and maintained better performance than the conglomerates.
- 1.
Potentially, functional synergy is a powerful tool for assuring coherence of the firm which can substantially enhance its profitability.
- 2.
However, synergy is inherently unstable.
- 3.
Therefore, in synergy seeking firm’s corporate management must make a continual effort to develop and maintain functional synergy.
- 4.
The degree of synergy enforced by the corporate management must be below the maximum acceptable level in all of the SBUs.
Even a casual observation of the business scene reveals that, while many firms pursue synergy, many others use a conglomerate style of management, under which synergy receives little or no attention.
The style of management is a part of the management vision shared by the key corporate managers which describes the kind of firm they want to build in the future. This vision is typically determined by the personalities, training, and prior experience of the key managers. Thus, as an example, technically trained managers may be more likely to seek synergy and managers with a financial background more likely to opt for the conglomerate style.
However, if attention is focused on the long-term success of the firm, pursuit of synergy must also be determined by the future conditions in the marketplace. If the future is expected to be highly competitive and if synergy will be an important success factor, the preferences of the corporate management must yield to the demands of the market.
Experience shows many instances in which a failure to recognize the future need for synergy is a part of the strategic myopia which we have discussed in Chapter 9. The reader will recall from these sections that the mentalities of the key management group must be changed before unbiased attention can be given to the problem of synergy.
*Choosing Functional Synergy
Before starting analysis of synergy, it is vital to ascertain whether the key management group in the firm is interested in synergy. Further, it is vital to ascertain whether the key management is prepared to commit its energy to bringing about and subsequently to maintaining the synergy. If the response to either of the above questions is negative, it is highly likely that the synergy exercises will result in ‘paralysis by analysis ’ and little synergy will be practiced within the firm.
If the response is positive, or provisionally positive, the synergy analysis described below should be carried out and the results presented to the key management group as part of the SBA portfolio strategy. The input into the functional synergy determination process is the functional capability plans developed by the firm’s SBU managers during competitive analysis (see Fig. 9.10).
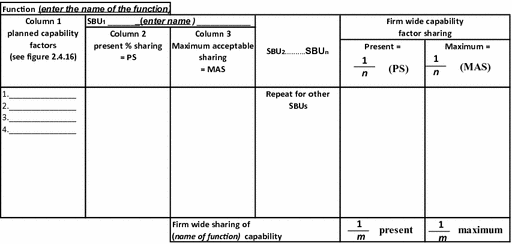
Determining present and maximum functional capability sharing
- 1.
Enter the planned capability factors into column l (the reader will recall that the capability profile will consist of one or more capability factors).
- 2.
For each success factor, estimate and enter into column 2 the percentage of the capacity of the factor which is presently shared by SBU1 with other SBUs of the firm.
- 3.
In consultation and negotiation with the SBU manager determine in column 3 the maximum acceptable percentage of capability sharing which will not deprive him of the degree of freedom and control which he needs to succeed in managing his SBU.
- 4.
As shown in Fig. 11.8, repeat the preceding steps for each SBU of the firm.
- 5.
For each capability factor, compute the firm-wide average sharing of the capability factor. This is done both for the present capabilities and for the maximum acceptable capability sharing. The formulas for computing the averages are shown at the top of the last two columns of Fig. 11.8.
- 6.
Compute both present and maximum acceptable firm-wide sharing of the functional capability by averaging the last two columns and entering the results at the bottom of the respective columns.
- 7.
Repeat steps 1–6 to obtain the average present and maximum acceptable firm-wide capability sharing for the other key functions of the firm which can benefit from functional synergy.
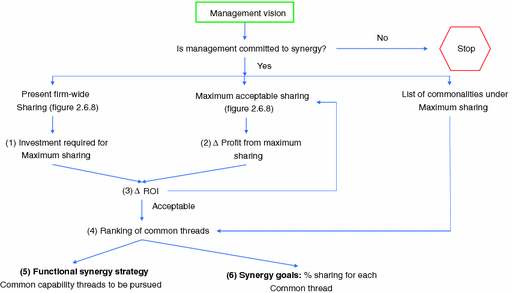
Choosing functional synergy strategy and goals
- 1.
As shown in Fig. 11.9, the first step in the synergy choice process is to estimate the investment which would be required to increase the sharing from the present to the maximum acceptable level.
- 2.
The second step estimates the improvement in the firm’s profits from advancing them sharing to the maximum acceptable level. An experienced reader will readily recognize that accurate estimates of investment and profit improvements from synergy are at best very difficult to make. Therefore, approximate and qualitative estimates are the best that can be hoped for. Experienced line managers must participate in making these estimates.
- 3.
The third step is to estimate the improvement in the firm’s return on investment which will result from maximum acceptable capability sharing throughout the firm.
If the increase in ROI is not acceptable to management, the maximum acceptable sharing level must be re-evaluated.
- 4.
If the increase in ROI is acceptable to management, the fourth step is to rank the common capability thread factors according to their contributions to the profit improvement. A rough approximation is to rank them according to their average percentage of firm-wide sharing.
- 5.The fifth step is to select the high ranking common capability threads which the firm will vigorously pursue in its strategic development:
- a.
by moving these threads from the present to maximum acceptable sharing level;
- b.
by testing new SBAs which the firm plans to enter for their potential for strengthening the selected common capability threads.
We shall refer to the list of the selected common threads as the functional synergy strategy of the firm.
- a.
- 6.
The final step in functional synergy analysis is to establish a synergy goal for each common capability thread which is the firm-wide percentage of sharing which the firm will strive to achieve.
Synergy Among Strategies
Strategy synergy is described by the similarities among competitive strategies which a firm pursues in its respective SBAs.
One benefit of strategy synergy is that it creates a potential for functional synergies. Thus, a strategy synergy which insists that the market differentiation sub-strategies in all of the firm’s SBAs should be to offer ‘the best buy for the money’ (see Fig. 9.9) creates a demand for the following functional common threads: low-cost production, quality cost-effective products, and ‘no frills’ distribution facilities.
Another benefit of strategy synergy is the contribution it makes to the image of the firm in the minds of managers, workers, customers, and investors. The managers and the workers perceive the ‘best buy for the money’ synergy as an element of the firm’s culture: to offer high quality at the least possible price. Investors and investment advisors perceive ‘where the firm is going’ and what to expect from its behavior. As a result, they are better equipped to make decisions on whether to invest in the firm.
Conglomerate firms which do not have an articulated strategy synergy frequently invest substantial resources into trying to project a coherent image through logo images and advertising slogans (e.g., ‘Let the power of the pyramid work for you’).
*Choosing Strategy Synergy
As in the case of the functional synergy, strategy synergy is a part of the management vision of the firm.
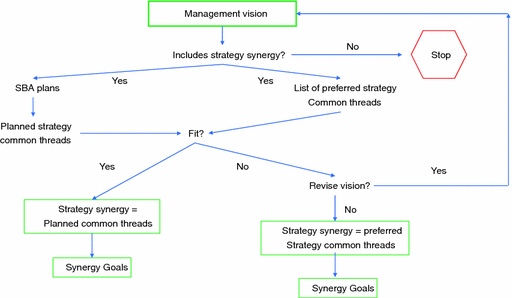
Choosing strategy synergy
- 1.
A list of the planned strategy common threads among SBA strategies. This list is prepared by comparing competitive strategies contained in the competitive posture plans for the respective SBAs.
- 2.
A list of the preferred strategy common threads contained in the management vision.
- 1.
If the lists are identical, the planned common threads become the strategy synergy of the firm, and synergy goals are set. These goals specify the SBAs of the firm in which the respective common threads will be made a part of the competitive strategies.
- 2.
If the planned and preferred common thread lists are different, the corporate management group decides whether the management vision should be modified in light of the reality of the historical and planned competitive postures in the respective SBAs.
- 3.
If the decision is to have the future strategy synergy comply with the management vision, the preferred common threads become the strategy synergy, and the goals are set accordingly.
Management Synergy
During recent years, an increasing number of firms have engaged in strategic behavior which would have been unthinkable some twenty years ago: Instead of getting bigger, these firms got smaller by divesting from some of their business areas. As a result, profitability increased in a majority of these firms. Thus, growth was displaced from its position as the driving objective which was supposed to guarantee success of a firm. Two labels are being used in business literature to describe this phenomenon. One is ‘going back to the core business,’ and the other is ‘strategic rationalization.’ In announcing strategic rationalization moves, corporate managements typically say: ‘We are divesting from these businesses because they do not fit our management style.’
One recent example of the largest reductions in the size is found with the General Electric Company. John Flannery, CEO, is continuing the divestments of GE units carrying on from Jack Welch’s divestment plan of roughly one-third of the company. The divested parts, which were acquired by Flannery predecessors, were all in natural resource businesses. The reasons given by Mr. Welch and Flannery were that GE management had little competence or interest in managing low-technology, slow-growing, low-turbulence businesses. The future focus of the firm’s portfolio strategy would be on growing, high-technology businesses.
This phenomenon calls attention to a third type of synergy which management must consider in planning the firm’s future strategic development: management synergy. Management synergy is the degree of responsiveness of the corporate management capability to the needs of its respective SBAs. (The phenomenon of management synergy can be understood using concepts of strategic diagnosis which were developed in Chapter 6.)
The reader will recall that the empirically proved strategic success hypothesis states that a firm’s performance in an SBA is optimized when the firm’s organizational responsiveness matches the turbulence level in the SBA (see Table 6.4). As the gap between the responsiveness and the turbulence increases, the firm’s performance progressively deteriorates (see Fig. 8.2). As was shown in Chapter 9, organizational responsiveness is determined by the management capability. Thus, as the gap between the turbulence level and management capability increases, the performance of a firm drops off.
A mismatch between turbulence and the corporate management capability has been one of the major causes of strategic rationalization. It typically occurred in firms which did business in several SBAs which were on different turbulence levels. The general management capability in such firms was typically aligned with SBAs called the core business, which were the original SBAs of the firm. Many other SBAs, which were on turbulence levels different from the turbulence in the core businesses, were receiving corporate guidance which was misaligned from the guidance needed to optimize the firm’s success. In simpler words, the noncore SBAs were being mismanaged by the corporate office . As such mismanagement depressed the overall performance of the firm, many firms sought to solve this problem by divesting from the noncore SBAs.
A highly visible example of such behavior was the Exxon Corporation. At a time when its historical core SBAs in the petroleum business were on turbulence level 3, Exxon diversified into the office automation business which, at the time of the diversification move, was on turbulence levels ranging between 4 and 5. The diversification was spectacularly unsuccessful, and Exxon closed the office automation division some ten years later, but not before accumulating a huge financial loss in the division. Subsequent analyses of Exxon’s venture into office automation, published in business literature, showed that the failure was due not to the quality of management or technology within the division, but to the failure of the corporate management to provide quick and appropriate response to the needs of the division.
To summarize the preceding discussion, the problem of management synergy arises in firms whose SBA portfolio contains SBAs on different turbulence levels, and different turbulence levels require different guidance from the corporate office . So far, we have focused discussion on one strategy for dealing with this problem: strategic rationalization through reducing the diversity of the firm’s SBA portfolio to SBAs which experience the same turbulence, thus raising management synergy to the highest possible level.
Strategic rationalization has the advantage of simplicity. But by narrowing its portfolio, the firm pays the penalty of having to forego opportunities to gain protection from risk through diversity of its portfolio. In addition, the firm may lose the opportunity to position itself in the growth industries of the future which in their early days experience very high turbulence levels.
- 1.
One alternative is to disregard the problem of synergy and accept suboptimal performance from the noncore SBAs. Until recently, many firms have been content with this solution. This strategy is called the dominant corporate capability strategy.
- 2.
Another strategy is to avoid the problem of management synergy by minimizing corporate management’s influence on the strategic development of the SBAs. This is accomplished by delegating strategic authority to the general managers on the SBU level. As we have already discussed, this is the conglomerate strategy which has also been widely used.
- 3.
A third alternative is the multi-capability strategy which seeks to design a multifaceted and flexible corporate management capable of ‘tuning into’ the SBA with which it is currently interacting. To date, there have been only a few instances of this strategy being successful. But in the complex world of the future, the multi-capability strategy will appear increasingly attractive, because it enables corporate management to remain an influential guide of the firm’s strategic development without sacrificing the diversity of its strategic portfolio.
The three strategies described above are optimal under different conditions. A discussion of the procedure for choosing the best management synergy for a firm can be found in Chapter 9.
Formulating Coherence Strategy
The ultimate purpose of the coherence sub-strategy is to make the firm more profitable in its chosen strategic areas. However, pursuit of this purpose may be diluted by the management vision which, in part, is determined not only by the growth/profitability objectives of the firm but also by the personalities, drives, and experience of the key managers. Thus, a financially oriented chief executive officer, who enjoys the game of ‘playing chess,’ with companies as his pieces, may choose to neglect synergies in favor of a conglomerate assembly of unrelated operating units.
Estimating future diversity
- 1.
The present functional, strategic, and management synergies of the firm.
- 2.
The key success factors in the SBA competitive posture plans which offer opportunities for synergies.
- 3.
The synergies desired in the corporate management vision.
The two-way arrows in the figure call attention to the fact that coherence strategy is the result of a tradeoff between the key success factors and synergy elements, which will optimize the firm’s profitability, and the management vision, which reflects the style of the corporate management.
Portfolio Diversity
Portfolio scope and coherence are based on the probable trends of the firm’s future, but the ‘Great Recession’ housing bubble highlighted the danger of exclusive reliance on probable trends. An economic event—lax lending standards in subprime mortgage loans contributed to high levels of household debt and the real estate bubble—introduced a discontinuity into the growth and profitability to many industries due to tightening of lending practices.
The ‘Great Recession’ caused strategic discontinuity that was particularly visible, because it was dramatic and its impact widespread. But a backward glance at the last thirty years shows a series of technological breakthroughs , political events, changes in market structure, and changes in consumer behavior which caught firms by surprise, frequently forcing them into crisis responses .
As our previous discussion of turbulence showed, there is a reason to expect that the incidence of strategic discontinuities will accelerate in the future. For some aggressive, risk-seeking managers, they present an opportunity to get in on the ground floor of new vistas and opportunities. For a majority of firms, though, discontinuities are an unpleasant fact of life which disrupt orderly progress and growth, and in the 2000s, this majority faces the problem of strategic vulnerability which needs to be controlled and reduced.
Discontinuities represent sharp breaks with the familiar past. Frequently, prior to their occurrence, their nature and extent of the impact can be defined only vaguely. Their very occurrence, as well as timing, remains uncertain before the event. As a result, it is difficult and sometimes impossible (see Part V) to plan and prepare for discontinuities in the same way one plans for trends.
- 1.
The first option is to react to the discontinuity after it has begun to impact on the firm. In environments in which discontinuities impact slowly, relative to the firm’s reaction time, this is a valid option. As our previous discussion has indicated, this option is effective on turbulence levels 1 and 2 (see Table 6.1).
- 2.
The second option is to develop and use management systems which seek to anticipate and respond to discontinuities before they impact on the firm. Such systems become progressively necessary as the environmental turbulence rises above level 3. We have briefly discussed such systems in Chapter 2. We will discuss them in greater detail in Part IV.
- 3.
The third option is to assure diversity of the firm’s SBA portfolio so that surprising discontinuities will not exceed the impact which management is prepared to accept.
While options l and 2 are mutually exclusive, option 3 is complementary to the other two, but its usefulness is mainly under the conditions when option 2 becomes necessary, namely at turbulence levels above 3.
We have previously defined the components of the portfolio strategy which assure diversity as the diversity strategy (see Fig. 11.2). There are two complementary factors in this strategy: external diversity and internal diversity.
External diversity can have two objectives. The first is to assure a desired level of the firm’s invulnerability to surprising threats. The other is to assure a desired level of flexibility which will enable the firm to capture surprising opportunities such as technological discoveries and favorable political changes.
- 1.
Making sure that the firm is not dependent on any one SBA to the extent to which a surprising threat will cripple the firm.
- 2.
Assuring that the political/economic/competitive/technological environments of the firm’s SBAs are different enough to make it unlikely that occurrence of a major threat in one would coincide with major threats in the other SBAs.
All firms, conservative and entrepreneurial alike, in environments above level 3, must give consideration to the invulnerability objective. The flexibility objective is a characteristic of the entrepreneurial firms. This objective is attained by positioning the firm in SBAs and in technologies which are expected to be turbulent and promise positive breakthroughs which will offer major opportunities to the firm. A current example of flexibility-seeking behavior is firms that have been taking positions in the biogenetic and artificial intelligence technologies.
Internal flexibility is attained by configuring the firm’s resources, capacities, skills, and capability in such a way that, in case of need, they can be quickly and efficiently transferred from one SBA/SRA to another. The ultimate flexibility is, of course, total financial liquidity—having the firm’s assets quickly convertible into money. But this path is possible only in the very few firms which are neither capital nor technology intensive. For most, the potential for enhancing internal flexibility is limited by the inherent convertibility of technology, skills, equipment, facilities, and inventories from one SBA/SRA to another.
*Analysis of Diversity
SBA performance
% of sales | % of profits | % of cash flow | % of invested capital | |
|---|---|---|---|---|
Top SBA | 40 | 52 | 45 | 35 |
Top two SBAs | 62 | 70 | 68 | 55 |
Top three SBAs | 81 | 77 | 82 | 60 |
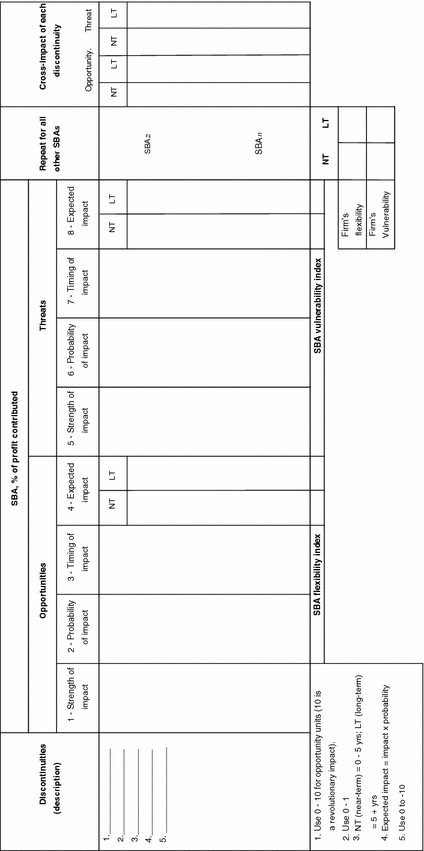
The high concentration of sales, profits, cash flow, and investment in the top three SBAs is cause for concern. However, it does not necessarily mean that the firm is strategically vulnerable. Therefore, a further analysis is indicated. A technique known as impact analysis , which is useful for this purpose, is illustrated in Fig. 11.10.
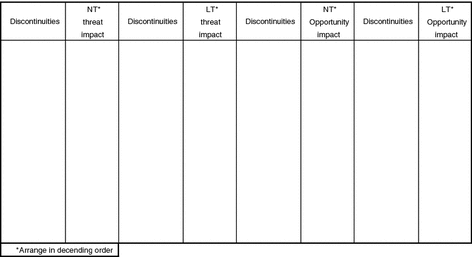
- 1.
The first step is to enter into the first column a list of possible discontinuous events which may have a major impact on the firm. Today, most firms would list: political instabilities in many parts of the world, petroleum politics, terrorism, inflation, technology of energy generation, changing consumer attitudes, changing attitudes toward work, government regulation of business, a growing demand for worker participation in decision, etc.
Many of these issues are shared by all firms, but each firm would find important issues which are specific to its industrial setting. Thus, firms in the automotive business would certainly add automotive safety legislation, production cost disparities among nations, and market protection measures as potential sources of major discontinuities.
- 2.The second step is to estimate the impact of each discontinuity on each SBA.
- a.
At the top of Fig. 11.11, enter the average percentage of the firm’s profits which has been contributed by each SBA during the past five years.
- b.
Using a scale from 0 to 10, enter into the ‘strength of impact’ columns a number which describes the probable strength of each discontinuity’s impact.
- c.
Using a scale from 0.0 to 1.0, enter into the ‘prob.’ (probability) columns an estimate of the probability that the discontinuity will occur.
- d.
In the columns labeled ‘timing,’ enter NT (near term) if the impact is expected to occur within the next five years. Enter LT (long term) if the impact is expected to occur beyond the next five years.
- e.
For each SBA, compute the column average of ‘expected impact’ entries in column 4 and enter it at the bottom of the column. We will call this entry the SBA flexibility index.
- f.
Repeat the above procedure for threat ‘expected impact’ entries (column 8) to compute the SBA vulnerability index. Enter the result at the bottom for each SBA.
- a.
- 3.
The third step is to determine the firm’s flexibility and vulnerability. They are computed (twice, once for flexibility and once for vulnerability) using the following equation:

Enter the results at the bottom right-hand side of the figure.
- 4.The fourth step is to compute the cross-impact of each discontinuity on the firm. The cross-impact measures the firm-wide impact of each discontinuity.
- 5.The fifth step in the diversity analysis is to compute the percentages of the firm’s historical profits which will be exposed to different levels of vulnerability and flexibility.
- a.
- b.
Alongside each SBA enter the percentage of historical profit contributed by it. (Obtain from top of Fig. 11.11.)
- c.
Add the profits for each level and enter into the ‘total profit’ column.
- a.
- 6.
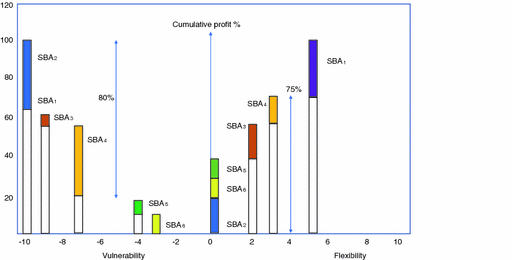
The sixth step is to construct a graph of the percentage of the firm’s profit which will be exposed to different levels of vulnerability/flexibility.
*Choosing Diversity Strategy
Eighty percent of its historical profit came from four SBAs (SBA1, SBA2, SBAJ, and SBA4) which are likely to suffer a serious loss of profit.
Thirty percent of the historical profit is likely to be transformed into losses in SBA1 and SBA2.
Seventy-five percent of the profits are in five (out of the total of six) SBAs, which, at best, are likely to experience only minor opportunities to increase profits as a result of opportunity breakthroughs .
The profile illustrated in Fig. 11.14 is characteristic of firms that have been historically successful in low-turbulence environments in which discontinuities have been rare and are now confronting a turbulent future. The remedial measures depend, in part, on the management vision of the firm. Conservatives’ risk-averse managements would not be concerned with lack of flexibility, while entrepreneurial risk-seeking managers (who may have recently bought into this historically conservative firm) would emphasize flexibility.
While concern with flexibility may vary among firms, the grim vulnerability picture must be of concern to all firms because it threatens major losses of profit and even survival of the firm.
- 1.One approach is to use a strategy which imposes the same limitations and expectations on all SBAs of the firm. Under this approach, the following complementary strategies may be chosen:
- a.
Limit the percentage of profits which each SBA contributes to the corporate profit stream.
- b.
Require that all SBAs comply with the same diversity limits.
- c.
Require that all SBAs of the firm be highly likely (or highly unlikely) to be affected by specified discontinuities (e.g., technological breakthroughs or political upheavals).
- a.
This approach does not imply that a firm pursuing it is necessarily conservative. For example, technology-driven firms deliberately seek to confine themselves to SBAs on turbulence level 5 (see Chapter 6), in which the probability of breakthrough opportunity is very high.
- 2.The second approach to formulation of the diversity strategy is to seek to maintain an average firm-wide vulnerability and flexibility, but allow different levels in different SBAs. Under this approach, the following complementary sub-strategies may be chosen:
- a.
Maintain average firm-wide levels of flexibility and vulnerability.
- b.
Specify percentage of future profits which will be contributed to the firm by SBAs in different flexibility/vulnerability categories.
- a.
This approach to diversity strategy gives management a greater freedom in selecting SBAs for the firm’s future portfolio. However, as discussed in sections on management synergy and on multi-capability (see Chapter 9), SBAs with significantly different flexibility and vulnerability potentials require different styles of corporate management.
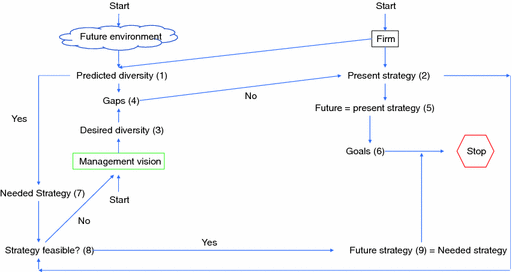
Logic of diversity strategy formulation
- 1.
The predicted diversity which has been determined in the preceding section.
- 2.
The present diversity strategy of the firm which is the logic which has guided the evolution of the firm’s diversity. If the firm has no explicit statement of the strategy, the strategy can be inferred by analyzing the present SBA portfolio.
- 3.
The future diversity desired by the controlling management group. If the management vision of the firm does not include a statement of the desired level of diversity, it should be elicited from the key corporate managers.
- 4.
The development of future strategy starts with a comparison of the predicted and desired diversity.
- 5.
If there is no gap between the two diversities, the present strategy becomes the future diversity strategy of the firm.
- 6.
The final step in this branch of analysis is to set future goals which are, in this case, the results of the predicted diversity analysis.
- 7.
Returning to step 4, if there is a significant gap between the desired and predicted diversity, a needed diversity strategy is created which will assure attainment of the desired diversity.
- 8.
Next, the financial feasibility of the strategy is tested, as well as its consistency with the other components of the portfolio strategy. For example, if the strategy synergy commits a firm to participation in turbulent high-tech SBAs, the diversity strategy should assure a high degree of flexibility.
If the strategy is not feasible, it must be changed. The first step is to have the management vision modified, and the second step is to create a new needed strategy.
- 9.
A needed strategy which is feasible becomes the future strategy of the firm and the appropriate goals are set.
Integrating Sub-strategies
Dimensions | Components |
|---|---|
Portfolio scope | • Plan for evolution of the present portfolio |
• Plan for entry into new SBAs | |
Coherence | • Synergy among functional capabilities |
• Synergy among firm’s strategies in its SBAs | |
• Management synergy between corporate management capabilities and management capabilities required for the respective SBAs | |
Diversity | • Invulnerability of the portfolio to surprising threats |
• Flexibility of the portfolio for participating in unforeseen opportunities |
In the preceding pages, we have developed logical procedures for determining the strategies for each of the above components. The next step is to integrate these strategies into the overall portfolio strategy.
- 1.
Thus, there is a strong link between the strategy and functional synergies. By defining the common strategy threads, the strategy synergy also defines the functional capabilities which will be needed to support the strategies.
- 2.
Similarly, the strategy synergy defines the turbulence common threads. As we previously discussed, the strength of the turbulence threads determines the level of management synergy. As the reader will recall, a large diversity of turbulence levels among SBAs suggests a conglomerate organizational structure which has very weak management synergy.
- 3.
Strategy synergy also interacts with the diversity synergy. The latter specifies the degree of dispersion of the firm’s portfolio among SBAs which are subject to various surprising threats and opportunities which will require different response strategies. Thus, the higher the diversity, the more difficult is to identify common strategy threads.
- 4.
The portfolio scope which specifics the SBAs in which the firm will do business in the future implicitly specifies both the diversity and coherence of the portfolio.
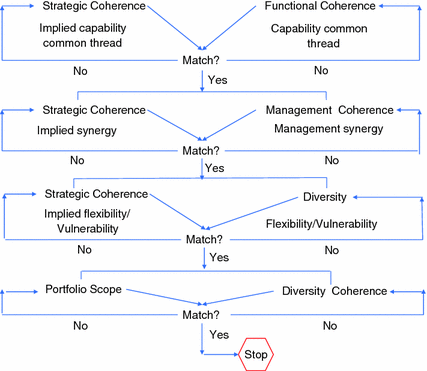
Assuring consistency of portfolio strategy
Alternative Approaches to Portfolio Optimization
The building blocks of portfolio optimization—the strategy and the objectives—described in the preceding sections can now be brought together in the process by which the optimum portfolio strategy is selected.
- 1.
The objectives of the firm are multidimensional, aimed at optimizing several distinctive aspects of performance.
- 2.
In the language of management science, the objectives are not collinear, which means that enhanced performance in pursuit of one of the objectives does not guarantee performance improvements on other objectives. On the contrary, performance on other objectives is typically reduced. For example, maximization of near-term performance depresses investment in the future and hence the long-term performance; or increase in strategic invulnerability and flexibility may depress growth and profitability.
- 3.
Measurements of performance on respective objectives are non-commensurate which means that they are not directly comparable. For example, a 5% increase in the sales growth is not directly comparable to a 5% increase in the return on investment .
As a result of these complexities, it is not possible to construct a fully quantitative model which will automatically select the optimum portfolio for the firm. The process depends as much on managerial judgments as it does on quantitative data.
Two ways to insert judgment into the optimization process are described here. One is to ask the ultimate decision makers to make all the necessary judgments at the outset. For example: to assign priorities to the respective objectives. Once the judgments have been made, a computational model is constructed incorporating the judgments. The model is then ‘run’ in an optimizing mode so that it compares alternative strategies and determines the best portfolio strategy. The result is presented to management.
A modification of the above approach is to run the model in a what-if mode: The model is used as a ‘black box’ with alternative sets of inputs and assumptions made by management fed into the model to produce the best strategy. If the output is not satisfactory to management, a new set of inputs/assumptions is tried.
Both of the foregoing procedures are called off-line or non-interactive or black box approaches which means that management does not participate in the process by which the strategy is analyzed. Both approaches are consistent with the classic staff line roles in managerial decision making: The staff gathers the inputs, processes them, and presents the results to the line decision makers. The line managers provide judgmental inputs and preferences and accept or reject the results.
As the reader will readily recognize, the same approaches are typically used when external consultants replace the internal staff as data gatherers, analysts, and recommendation makers.
The optimizing mode has been widely used and continues to be used in business firms. The what-if mode came into use with the advent of the personal computer. Both methods proved to be effective in solving problems which produce no surprises to the decision makers, and are consistent with their model of the world and their mentality (see Chapter 9). But, experience shows that, when the solutions are contrary to the manager’s world model and when these solutions recommend difficult organization—disrupting actions—the decision makers typically neglect or reject the recommendations. Examples of such decision-making situations are: divestment from an SBA which for many years had supplied a major profit stream to the firm, or acquisition of a new technology which is totally alien to the firm’s R&D competence, or shifting of power from an historically entrenched function of the firm.
An explanation for this behavior has already been offered in Chapter 9 and will be elaborated upon in detail in Part V. For the present, it will suffice to recognize that such behavior occurs whenever the environment shifts from one level of turbulence to another. When this is the case, a third and different type of approach to portfolio optimization becomes necessary which involves the decision makers, together with the staff, in a step-by-step process of strategy analysis and decision making. We shall call this the interactive strategy formulation or the on-line approach to strategy optimization.
*Selecting the Optimum Strategy
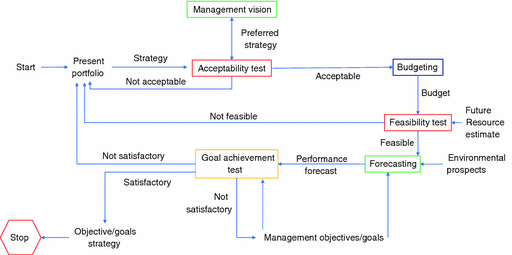
Selecting optimum strategy
- 1.
Planning staff prepares essential inputs and facilitates the process of analysis and decision making.
- 2.
The computer guides the logic of the process and performs computations.
- 3.
Key corporate managers add their judgments and preferences, and progressively make a series of decisions which terminate in the choice of the portfolio strategy.
- 1.
If, prior to portfolio optimization, the respective SBUs had prepared strategic plans for their SBAs, the corporate staff consolidates the SBA plans and diagnoses the proposed portfolio strategy implied by the plans.
- 2.
If SBA plans are lacking, the present portfolio strategy is diagnosed. This is a staff responsibility.
- 3.
Assisted by staff, senior corporate managers, working as a group, formulate their collective strategic vision.
- 4.
Assisted by the staff, the corporate managers compare the corporate vision with the proposed portfolio strategy. Lacking a proposed strategy, the comparison is made between the present strategy and the corporate vision.
- 5.
If the strategy is responsive to the vision, the analysis moves to the next stage.
- 6.
If there are minor discrepancies between the strategy and the vision, as the feedback arrow in Fig. 11.17 shows, the strategy is revised. If the discrepancies are major, a new proposed strategy is created by the staff.
- 7.
The feedback is repeated as many times as necessary until the proposed strategy matches the vision. A way to minimize the number of the feedback passes is to have staff create several alternative strategies on the first pass.
- 8.
The staff, assisted by the computer program, prepares the strategic investment budget required to implement the strategy(s).
- 9.
The staff also prepares an estimate of the future resources which will be available for future strategic development of the firm.
- 10.
Corporate managers compare the budget to the future resources and decide whether the strategy is feasible.
- 11.
If the strategy is unfeasible, it is either scaled down (in the case of minor infeasibilities) or a new strategy is created.
- 12.
New strategies are also created if the proposed strategy is feasible, but does not make full use of the future resources. In this case, the strategy is scaled up.
- 13.
As the preceding discussion indicates, the process to this point can be applied to one strategy at a time or several alternative strategies.
- 14.
Corporate managers assisted by the staff identify the firm’s objectives and set provisional goals for each objective.
- 15.
For each strategy which has passed the feasibility test, performance forecasts are prepared by staff for each objective.
- 16.The forecasts are compared to the provisional goals to produce goal achievement profiles for each objective. An example of a goal achievement profile is illustrated in Fig. 11.18, and the decision alternatives are illustrated in Fig. 11.19.
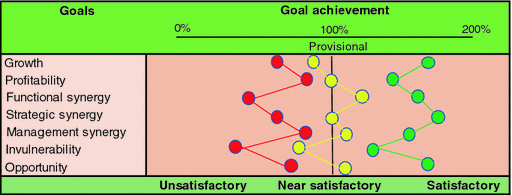 Fig. 11.18
Profiles of goal achievement
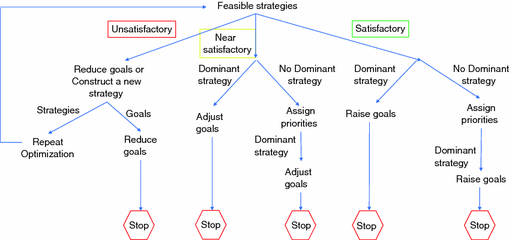 Fig. 11.19
Logic of strategy/goals
- 17.If there is no feasible strategy, whose performance is near or above the provisional profile, management makes one of the two decisions:
- a.
To create new provisional strategies and submit them to the complete analysis.
- b.
To reduce the provisional goal profile to the forecast profile. If this decision is made, portfolio optimization is completed.
- a.
- 18.
If there is a near-satisfactory profile, as illustrated in Fig. 11.19, the provisional goal profile is modified and optimization is completed.
- 19.
If there is a satisfactory profile which exceeds the provisional profile for every goal, the provisional goals are adjusted upward.
- 20.
If the feasibility test produces more than one near-satisfactory profile, none of which clearly dominates the others, the final profile is chosen by assigning relative importance weights to respective goals and computing weighted profiles.
Overview of Strategic Posture Planning
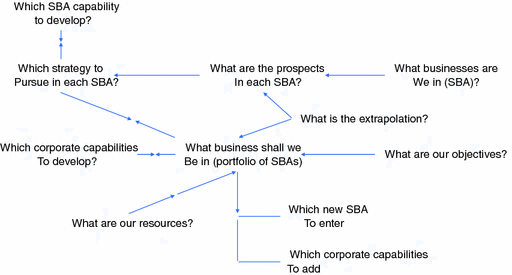
Logic of strategic posture planning
- 1.
The first step is SBA segmentation which identifies the distinctive areas of opportunity in which the firm participates.
- 2.
The second step is determination of prospects in each SBA (see Chapter 9) including near- and long-term growth, near- and long-term profitability, and economic/technological/sociopolitical turbulence.
- 3.
The third step is identification of strategy and capability which the firm will pursue in each SBA. This starts with estimating the extrapolated future competitive position for each SBA (see ‘estimating future competitive position’ Chapter 9). These estimates are compared to the SBA prospects, using an appropriate matrix (BCG, McKinsey). The matrices are used to select the preferred competitive position and to then determine the preferred future investment level, strategy, and capability (see Chapter 9).
Readers will recall that early prescription for strategic planning asserted that strategic analysis cannot start until the management had made clear its objectives and goals. Experience in the use of strategic planning has shown that pragmatic managers are frequently not prepared to choose objectives and set goals until they have an idea of the future potential available to the firm. Given an estimate of the potential, aggressive managers can identify the priority objectives and set goals which are realistically above the present performance, but which require the firm to operate at full stretch. Less ambitious managers would set more moderate objectives.
Thus, the first line of Fig. 11.13 determines the maximum potential performance which the firm can attain within the limits of its present SBA portfolio. The determination of this potential does not depend on an early clarification of objectives and goals. As shown below the first line of the figure, however, objectives and goals become necessary for determining the shape and balance of the future SBA portfolio. A physical limit on goals and objectives will be set partly by the potential of the present competitive posture and partly by the strategic resources which will be available to the firm. As seen in the preceding sections, it is at this point that ‘the business we will be in’ can be realistically determined.
As the figure shows, the selection of the portfolio must be made in conjunction with the corporate (general management) capabilities. We shall be discussing corporate capability diagnosis and planning in Part III.
- 1.
Identification of the future common threads (‘the business we are in’).
- 2.
Establishment of performance objectives, goals, and their priorities.
- 3.
Establishment of priorities among SBAs.
- 4.
Strategic resource allocation among SBAs.
- 5.
A program for the development of the SBA portfolio, including changes in emphasis, entries, and exits.
- 6.
Identification of the characteristics of the new SBAs which the firm will seek to add to its portfolio.
- 7.
A forecast of the resources which will be devoted to strategic development.
2.6.22 Summary of Techniques for Strategic Analysis
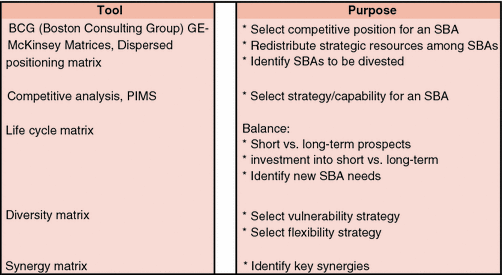
Tools for portfolio management
As the figure shows, three distinctive types of matrix are available for position analysis and strategic resource allocation in the near term. We have discussed two of them in Chapter 9. The dispersed positioning matrix was discussed in Chapter 10.
In addition to the competitive posture analysis discussed in the preceding chapter, another popular approach is PIMS (profit impact of market strategies), developed by the General Electric Company and the Harvard Business School. It is based on a historical correlation of the firm’s performance with key resource allocations and strategies used by firms in a given SBA.
The essential difference between PIMS and the competitive posture analysis approach is: PIMS uses historical data to establish future success behaviors, while the competitive posture analysis uses trend data and judgments of experienced managers. Thus, if the firm’s future environment is confidently expected to be on turbulence level 3 or below, PIMS offers the advantage of conclusions drawn from a large data sample. But if turbulence is expected to be at level 4 or above, the more complex competitive posture analysis becomes necessary.
From Strategy to Action
- 1.
Specification of the future strategic posture (strategy, capability, and strategic investment) for the firm’s historical SBAs.
- 2.
A balanced portfolio which specifies the future composition of the portfolio, the synergies, the timing of SBA entry and exit, and the future strategic resource commitments.
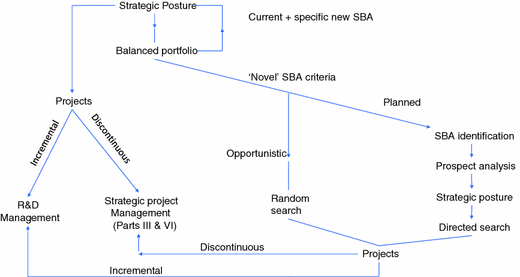
Opportunistic vs. planned implementation
Once the future preferred posture of the historical SBAs is modified, the next step is to identify strategy, capability, and capacity development projects and to launch their implementation. This path is shown at the left of the figure. When the changes in posture are evolutionary and incremental, the process of R&D management, which is usually well developed within firms, assures effective implementation. But when the changes are massive and discontinuous, the ‘conventional’ decentralized R&D management runs into difficulties and a new way of managing implementation through strategic projects is needed (see Chapter 25).
- 1.
It may be that during portfolio analysis, a range of attractive new SBAs is sufficiently well known to the firm to permit planned selection of specific new entries: for example, an entry into gene-splicing for cattle breeding, or an entry into the fifth-generation computers for scientific analysis.
In this case, the firm can choose the preferred strategic posture for each of the new SBAs, following the procedure for already existing SBAs. This step is shown at the top of the figure by the ‘specific new SBA’ feedback arrow to posture analysis. The chosen strategic postures guide directed search for projects. As shown in the figure, these are assigned to R&D management.
- 2.
Frequently, only a few or even no SBA alternatives will be identified at the time of portfolio balancing. Instead, diversification criteria are to be derived from the analysis of deficiencies in the current portfolio. The criteria specify characteristics of the ‘novel SBA’ which will be sought, for example, ‘a large-scale entry into one or more new high-technology businesses, or in growing service businesses’ (these are the criteria which have recently been enunciated in the General Electric Company).
Figure 11.22 shows two approaches to novel SBAs. In the opportunistic approach , shown on the left, the criteria for the desired SBAs are made known to people who are in a position to identify suitable opportunities. These will be the marketing, and R&D departments within the firm, and outside agents such as investment bankers and diversification brokers, who have frequent contacts with acquisition and merger possibilities.
The opportunities identified by these agents are typically screened, one at a time, on two sets of criteria. The first are the strategy criteria for new opportunities, and the second are the basic financial soundness and fit with the management of the firm.
The opportunistic approach is probably the dominant mode which has been used by firms in search of diversification. In many cases, particularly that of the conglomerate firms , the criteria which are enunciated to the public are in purely financial terms, without the benefit of prior portfolio analysis.
When acquisition opportunities are brought to the attention of the corporate management, it is typical in the opportunistic approach to focus evaluation on the merits of the particular acquisition opportunity rather than on the SBA which it represents. Further, the evaluation is based on the historical performance of the proposed acquisition, the quality of its management, and its fit with the parent firm.
So long as the acquisition comes from an SBA in which historical trends are safely extrapolable into the future, a historically successful performer can be expected to succeed in the future.
But in emerging SBAs, SBAs undergoing transition into a new life cycle stage, SBAs whose level of turbulence is expected to change in the future, and, particularly, in SBAs whose key success factors are expected to change significantly, historical success of the acquisition candidate is no guarantee of its future success nor of the future attractiveness of the SBA. If anything, as we shall see in Part III, the longer lasting the past success, the more likely it is that the acquisition candidate is headed for future difficulties.
Thus, by focusing on the historical characteristics of the proposed acquisition, with little understanding of the future of the SBA from which it comes, management takes great risks of acquiring a ‘Cinderella.’ History of the acquisition movement in the USA shows that the Cinderella effect has been a frequent phenomenon.
- 1.
A broad scope of potentially interesting SBAs is identified and then reduced to a relevant subset by application of the portfolio criteria.
- 2.
The prospects of each new SBA in the set are analyzed in depth using the procedures of Chapter 1 or Chapter 10, and several new SBAs are selected for inclusion in the portfolio.
- 3.
A preferred strategic posture is selected for each SBA.
- 4.
A directed search is conducted for specific entries (such as companies available for acquisition or product lines) and each is subjected to a detailed analysis.
- 5.
Entries which pass the strategic and financial criteria are next launched (through approaching attractive merger partners or initiating internal development projects).
As shown at the bottom of the figure, to ensure success, the implementation process has to be handled differently depending on whether the new entry is evolutionary or discontinuous from the firm’s historical SBAs. The differences in handling will be discussed in detail in Parts II and V.
Under the planned approach , the firm does not enter an SBA until it has assured itself that the prospects are attractive and chances of success are good. Furthermore, the firm makes the entry in accordance with a preplanned strategy.
- 1.
An early limitation of the scope of interest may exclude potentially attractive SBAs. This was the case in a major diversification study in which the chosen scope (the entire manufacturing industry in the USA), which appeared to offer a comprehensive field of opportunities, turned out to exclude attractive internationalization opportunities as well as opportunities in the service industry.
- 2.
The second disadvantage of the planned approach is its obvious high cost and duration. Therefore, it is usable primarily in large firms, which have the necessary resources and which seek major diversification.
- 3.
The third disadvantage, which became increasingly prominent since the 1950s, is the growing unpredictability of the future, which makes it difficult to make accurate assessments of both prospects and opportunities.
Diversification Through Strategic Learning
The opportunistic and the planned approaches can readily be seen as extremes, whose respective merits have been argued for years in management literature: to plan or to muddle through, to use the ‘right or the left side of the brain,’ to act deliberately or to evolve organically, etc.
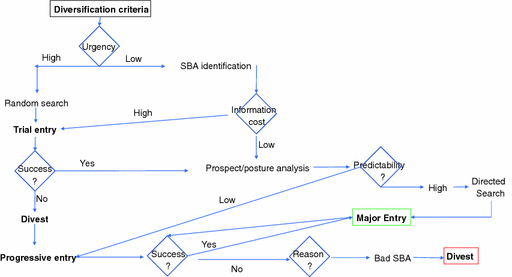
Diversification through strategic learning
Once the diversification needs and criteria have been identified, the next step is to determine whether these needs are pressing. If urgency is low, the planned approach is taken: a comprehensive analysis aimed at identification of potential new SBAs. If urgency is high, ‘random search’ is started: The firm uses its many contacts with the environment to identify specific opportunities (typically mergers and acquisitions).
The choices of the approach are not mutually exclusive. For example, a firm which has a pressing near-term diversification need as well as long-term needs would use both approaches.
The random search, started at the left of Fig. 11.23, results in trial entries which, on the one hand, do not require major resources commitment and, on the other hand, permit quick strategic learning .
The operating profits obtained through the trial entry are not important at this point. What is important is the future attractiveness of the SBA and its general fit with the firm.
If the SBA turns out to be unattractive, the firm should divest from the trial entry. If it is attractive, the next step is to shift into the planning mode and formulate the preferred strategic posture .
Returning to the top of the right-hand side of the figure, the second step depends on the cost of acquiring the data needed to select the posture in an attractive SBA. At one extreme, the cost may be prohibitive or even infinite. The latter will be the case, for example, in SBAs which are in the early stage of emergence during which very little is known about the ultimate prospects, technology, and shape of competition.
If the cost of information is high, the firm should make a trial entry and monitor the evolution of information about opportunities in the SBA. If the cost of the SBA analysis is judged to be lower than the cost of trial entry, the next step is to formulate the preferred strategic posture , in the manner discussed earlier.
The posture analysis must shed light on the predictability of both the prospects and the firm’s future success. For this reason, it is necessary to use the uncertainty preserving dispersed-portfolio positioning (see Chapter 2.4) rather than uncertainty reducing techniques, such as the BCG or GE matrices.
If the predictability is high, the firm can use directed search to identify a specific opportunity and make a major entry into the SBA.
If the SBA is unpredictable, as Fig. 11.23 shows, the firm is well advised to plan a progressive entry in several steps. At each step, strategic control is applied: (1) If the performance improves, the firm proceeds to the next step and eventually to a major entry; (2) if the results are poor, the question is raised whether the lack of success is due to the poor quality of the SBA or to a poorly chosen strategy. In the former case, divestment is considered; in the latter, a revision of the strategic posture is made.
Historically, a combination of a trial entry followed by progressive commitment has been used by firms which internationalized their operations by entering poorly understood foreign markets. We shall be discussing this process in Chapter 14.
The strategic learning process described above is clearly more complex, costly, and demanding, than either the opportunistic or planned processes. Returning to our scale of turbulence, the simpler opportunistic approach can be used safely on turbulence levels 1–2; the more complex planning approach becomes necessary between levels 2 and 3, and the complex strategic learning is essential for responding to turbulence levels above 4.
The reader will recognize that in strategic learning the time-honored concept that implementation follows planning disappears and is replaced by parallel planning and implementation. We shall be returning to the parallel planning/implementation management in Chapter 24.
2.6.25 New Workload for General Management
When systematic strategic analysis is introduced into a business firm, a substantial new workload is imposed on management. This workload consists not only of strategic planning but also of assuring the implementation of the new strategic departures.
The new strategic work comes in conflict with the daily profit-making activities. Experience has shown that unless new management capacity is provided and strategic responsibilities are clearly assigned, the conflict is typically resolved in favor of the profit-making work. We shall be discussing this problem in detail in Parts III and VI. In this section, we limit attention to the responsibilities for strategic analysis.
In the formative days of strategic planning, it appeared logical to concentrate strategic planning at the corporate levels of management. Experience quickly showed that, with one exception, this was an unworkable solution which typically produced a phenomenon which became known as ‘paralysis by analysis ’: Plans made at the headquarters languished and remained unimplemented.
The exception was when the firm’s strategic activity was confined to mergers and acquisitions. In this case, the corporate headquarters engage in a self-contained strategic activity: It both plans and executes the strategic moves.
Whenever strategic implementation was from within the firm, experience shows that the process of strategic development must be participative and interactive, which assigns important roles to both the corporate office and the SBUs .
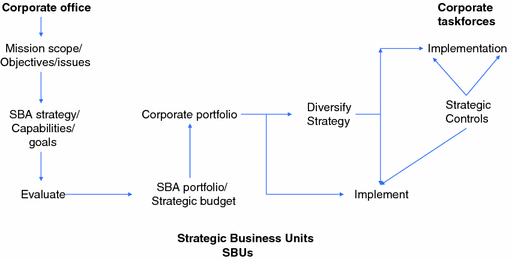
Organizational flow of planning
The SBU managers are responsible for strategies and capabilities in SBAs assigned to them, for balancing their own portfolios, and for expanding these portfolios within the mission scope assigned to them.
A strategic staff is needed to support line executives at both levels: to design and supervise the planning process, provide environmental inputs, identify new portfolio opportunities, analyze SBAs and portfolios, and develop investment and divestment plans and budgets. (For a discussion of staff roles, see Sect. 4.3.11.)
- 1.
Assuring prompt recognition and timely responses to strategic challenges.
- 2.
Assigning strategic responsibilities (missions) to the respective SBUs of the firm.
- 3.
Setting the objectives and goals of the firm.
- 4.
Selecting the corporate SBA, SRA, SIG portfolios.
- 5.
Assuring transfers of strategic resources among the SBUs.
- 6.
Selecting the mix of means for changing the portfolio: strategic development from within, as opposed to acquisitions and mergers.
What we have described above is the fully strategic role for the headquarters. It is in sharp contrast to two different roles which were prevalent prior to the 1960s and are still widely observable in practice.
- 1.
When the corporate management accepts the sum of its present SBU contributions as sufficient to meet the objectives of the firm.
- 2.
When there are no transfers of strategic resources nor a need for cooperative efforts among the SBUs.
The other observable role is the financial or conglomerate role . The corporate office leaves strategy formulation and implementation, as well as organization building, to the SBUs (which are usually organized as subsidiaries) and limits itself to consolidation and monitoring of budgets and of financial performance, acquiring new subsidiaries, and divesting from subsidiaries which chronically malperform. This role is effective when all of the SBAs are growing, non-turbulent, and competition is not intense.
As already discussed in this chapter, the choice of the role to be played by the corporate office can be determined, in part, by the preferences, skills, and ambitions of the incumbent managers. But in the environment of the 2000s, the choice must also be determined by environmental conditions which the firm expects to confront in the future. If, as so often in the past, the firm expects a quiescent strategic environment, if its SBAs have promising long-term demand-technology cycles, if the sociopolitical pressures do not threaten, if technology is not expected to be turbulent , and if strategic input resources are secure—if all these conditions are satisfied, then corporate management is free to choose any of the three roles. In fact, the firm will probably be more successful if the corporate office stays out of the strategic role and does not ‘meddle’ with the SBUs.
If, however, the life cycles are short, technology turbulent , sociopolitical pressures are expected to be severe, and the SBUs compete for strategic resources , the corporate office must begin to take on strategic work which cannot be done at the lower levels and also make sure that the lower levels of general management take on comparably demanding strategic responsibilities . A failure to do so during the turbulent remainder of the twentieth century will imperil both success and survival of the firm. (For a detailed discussion of corporate line roles, see Chapter 17.)
Summary
When, as occurred during the first half of the century, the markets of the firm are in long growth stages, technologies are stable , and turbulence is low, management can focus its attention on optimizing near-term growth. If growth is optimized, profitability will follow, and long-term growth prospects are guaranteed.
However, as life cycles shorten and the environment becomes turbulent, profitability no longer follows growth, and near-term growth is no guarantee of long-term prospects. As a result, management has been giving increased attention to balancing investments into the near-term performance against investments into the long-term prospects.
As another result, the likelihood of both positive (opportunity) and negative (threat) discontinuities has made it necessary to minimize strategic risks through building into the portfolio internal and external flexibility. Third, increasing competitive pressures makes it increasingly necessary to optimize strategic effectiveness of the firm through synergies among the firm’s SBAs.
If optimized separately, each of the three dimensions of performance (long- and near-term profitability, flexibility, and synergy) would depress the performance on the other two.
This chapter has presented a portfolio balance technique which permits a simultaneous consideration and balance among the three dimensions of performance as well as others which the firm may want to pursue.
It involves setting objectives and goals for each of the dimensions, assigning priorities to each, and then evaluating the total portfolio of SBAs for its individual and combined contribution to the objectives. If the contribution is unsatisfactory, the gaps in the portfolio are identified, and a new portfolio is specified and evaluated. The final portfolio is tested for feasibility against the firm’s resources.
The chosen portfolio will specify the evolution of the firm’s SBAs over time, including investments and withdrawals from the present SBAs, as well as characteristics of new SBAs which will be sought. In addition, the portfolio specifies the common threads (synergies) among the SBAs and SBUs which will be maintained and developed.
This and the preceding chapter have presented a systematic approach to strategic posture planning . The first major step is strategic segmentation (presented in Chapter 9) which analyzes the SBAs separately, chooses the firm’s preferred posture in each, and determines strategic resource balance in the long term. The second major step is strategic integration, which develops the characteristics of the future portfolio in both the long and short term.
Strategic planning defines the future shape of the firm, but its only output is plans. The next step is to generate and take concrete steps which will implement the plans.
Historically, two approaches have been used for converting strategy into action. One of these is the opportunistic approach which dispenses with planning of entries and focuses on random generation of specific steps. The other is the planned approach which converts the portfolio strategy into preferred strategic posture for each of the firm’s SBAs and uses directed search to develop new opportunities.
In the environment of the last quarter century, a third approach has become increasingly necessary. This is the strategic learning approach which dispenses with the usual sequence of implementation after planning and mixes planning and implementation steps according to the urgency felt by management, costs of developing the necessary information, and predictability of the future prospects in an SBA. The learning approach incorporates a process of progressive commitment by a firm, through which the firm simultaneously enters the marketplace and develops strategic information about the SBA.
The advent of systematic strategic analysis adds new workload and new roles to general management . Experience has shown that authority and responsibility for strategic development of the firm should be shared between the corporate office and the SBU managers, and that the strategic planning process should be both participative and interactive.
Exercises
- 1.
Under what conditions does growth of a firm’s sales cease to be a guarantee of profitability?
- 2.
Why is there a conflict between short- and long-term focus of management attention? What is the nature of the conflict? How should it be resolved?
- 3.
Identify five to ten probable discontinuities in the future environment which will pose major threats to firms in the developed nations. Select five industries which are most likely to be affected, and estimate the extent and the nature of the impact on each.
- 4.
It has been argued that the conglomerate firm is the firm of the future. It has also been argued that it contributes nothing to the economic development of a country and is therefore socially undesirable. What is behind these arguments? What are your views on the future role of the conglomerate?


