This chapter presents a procedure by which a firm can determine its future general management capability profile. The first version of this procedure appeared in 1976 (Ansoff et al. 1976-F). The revised procedure presented here has been repeatedly tested in practice with satisfactory results.
The Effect of Strategic Mismatch on Profit Potential
Previously, a short version of strategic diagnosis was introduced. At this point, a longer version of strategic diagnosis will be described which can be used to determine the specific action programs for developing the strategy and capability which will succeed in the future environment.
This chapter is based on one part of the strategic success paradigm introduced in Chapter 6. The part of interest at this point is the relation between turbulence and management capability. It states: for optimum profitability, the responsiveness of general management capability must match the turbulence of the firm’s environment.
Tables 6.1 and 6.3 were used in the short version of strategic diagnosis to determine whether the firm’s historical response to the environment will be adequate or whether the firm has a strategic problem.
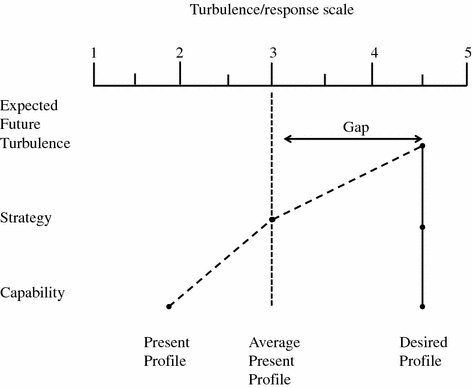
Mismatch between present and desired future profiles
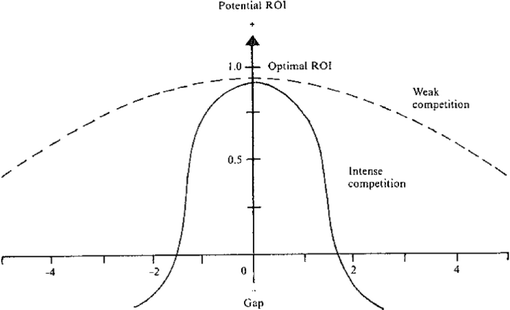
Effect of strategic mismatch on profit potential
The graph plots the firm’s ROI potential as a function of the gap between the environmental turbulence and the firm’s capability. Two hypothetical curves are shown: The upper curve is ROI in a market in which competition is weak. The lower curve shows the case of a strongly competitive environment.
The upper curve indicates that in weakly competitive environments, the penalty for being out of tune with the environmental turbulence is relatively small. But, in the case of intense competition, the firm’s performance deteriorates rapidly. In the example shown, a gap of more than ±2 in a weakly competitive environment would degrade the firm’s ROI potential to 75% of the optimum. But in an environment of intense competition, a gap of ±2 makes the firm chronically unprofitable, regardless of its competitive aggressiveness.
Figures 8.1 and 8.2 suggest that the decision to undertake the long version of the diagnosis depends on the competitive intensity which a firm expects to encounter in the environment.
If the short strategic diagnosis predicts a substantial capability gap, but management expects competition to be weak (e.g., the firm expects to occupy a near-monopoly position in the market), the need to undertake the long version of diagnosis would be relatively low in other words, the firm can remain a profitable performer even if its capability is out of tune with the environment.
On the other hand, if management expects competition to be intense, the ‘intense competition’ curve in Fig. 8.2 suggests immediate attention to the long version of diagnosis.
Differences Between the Long and Short Versions of Strategic Diagnosis
The short version describes general management by a single phrase which characterizes the kind of behavior (responsiveness) a particular capability will produce. In the long version, discussed in this chapter, we turn our attention to the components of capability which will be described in detail in the following pages.
- 1.
It permits a better evaluation of the present capability of the firm.
- 2.
It focuses attention on the specific components of capability which will need improvement.
- 3.
The focus on the components makes it possible to identify programs which will be needed to improve the capability.
Just as in describing capability, the short version describes turbulence by a single phrase. In the long version, turbulence is analyzed in greater detail.
Another significant difference between the short and long versions is in the treatment of unpredictability . In the short version, it is implicitly assumed that future unpredictability is going to be low and it is possible to characterize future turbulence by a single number.
In the long version, this assumption is abandoned and a range of probable turbulence is estimated in a manner consistent with the dispersed positioning approach described in Chapter 10. Specifically, two estimates are made of the level of future turbulence : a low probable level and a high probable level.
*Step in a Strategic Diagnosis
In the following sections, we present a procedure for assessing the gaps between the firm’s present capability profile and the future success profile. While the procedure may at first appear to be complicated, the reader can be reassured by the fact that it has been successfully used by many practicing managers.
More importantly, the reader can also rest assured that the diagnostic instruments have been validated by exhaustive research (see Salameh 1987-H; Hatziantoniou 1986-H; Sullivan 1987-H; Chabane 1987-H).
- 1.
Select a specific SBA for analysis.
- 2.
Choose the future time horizon for the analysis. This will vary from one SBA to another. A useful time horizon is the lead time needed in the SBA to develop a new generation of products/services or to introduce a novel technology.
- 3.
Diagnose the future low probable turbulence in the selected SBA of the firm.
- 4.
Diagnose the future high probable turbulence in the selected SBA of the firm.
- 5.
Select the average of the lower and the average of the higher to describe the overall range of future turbulence.
- 6.
Identify the present responsiveness of the firm’s capability.
- 7.
Diagnose the capability gap between capability and turbulence.
- 8.
Choose the firm’s future general management capability profile.
*Diagnosing Turbulence
Diagnosing future turbulence is, at best, an imprecise process. Although quantitative forecasts and multiple scenarios can provide a useful input to the diagnosis, the final estimate must be based on the judgment of managers who have a substantial record of experience in the SBA.
- 1.
To enhance reliability of judgment, turbulence diagnosis is best performed by a group of managers who bring to the process a combination of unique experiences, knowledge, and viewpoints. An ideal team would consist of an SBU manager of the SBA being analyzed, and his key functional managers from R&D, marketing, finance, production, and corporate planning.
- 2.
Secondly, the team should not be required to seek consensus on the precise level of future turbulence, but rather on a range within which the turbulence will probably fall. Thus, the group should seek consensus on the ‘low probable’ and ‘high probable’ values of future turbulence. Managers familiar with statistics can think of the low and high probable judgments as including the two-standard-deviation range of the probable future turbulence.
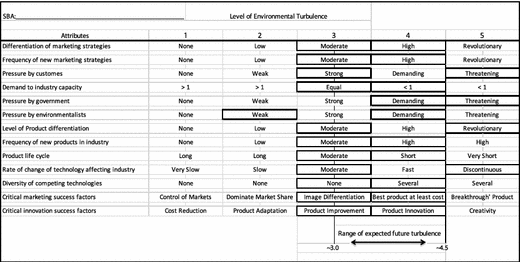
Worksheet for diagnosing the expected level of future turbulence
- 1.
Since the list of variables changes from one SBA to another, in practical use of these and subsequent tables, the first step is to examine the list of attributes; delete any attributes which are not relevant to the particular SBA and add any that are missing.
Repeated use of the tables by practicing managers has shown that only small modifications of the list are usually needed. For example, in defense-oriented industries, a major factor contributing to innovation turbulence might be ‘level of government support of R&D.’ For many strategic business areas in the western world, a key factor in marketing turbulence may be ‘invasion by Chinese competitors.’
- 2.
The second step is to circle two descriptions of each attribute in Table 8.1: The description which is judged to be the low probable, and the description which is judged the high probable in the future environment. The reader is reminded that the chosen descriptions should characterize the SBA during the chosen future period.
- 3.
The third step is to average the low probable and high probable descriptions by drawing two vertical lines in the manner shown in Table 8.1. The pair of lines represents respectively, the possible low and the possible high level of expected future turbulence. Thus, the two lines enclose the range of turbulence which is expected to be observable in the SBA’s future environment.
- 4.
*Diagnosing the General Management Capability of the Firm
For the purposes of capability diagnosis , general management capability is described by four components:
- 1.Managers’ profiles (Table 8.3).Table 8.3
Managers capability type attributes
Capability type
Attibutes
Custodial
1
Production
2
Marketing
3
Strategic
4
Flexible
5
1. Mentality
Custodial
Production
Planning
Entrepreneurial
Creative
2. External vs. internal orientation
Introverted

Balanced

Extroverted
3. Time orientation
Precedent
History
Extrapolated future
New Futures
Invented futures
4. Model of success
Stability/repetition
Production efficiency
Balance of internal efficiency and marketing responsiveness
Investment in most profitable available opportunities
Creativity
5. Risk propensity
Reject
Accept familiar risks
Seek familiar risks
Seek unfamiliar risks
Seek novel risks
6. Power of general management
Strong

Moderate

Strong
7. Leadership style
Political
Disciplinary/ controllership
Inspirational/ common purpose
Charismatic
Creative
8. Problem solving
Trial/error
Diagnostic
Optimization
Alternative search
Alternative creation
9. Knowledge
Internal politics
Internal operations
Traditional markets/competitors/technology
Global opportunities
Emerging environment
10. Leadership skills
Political Custodial
Controllership
Goal achievement
Entrepreneurial
Charismatic
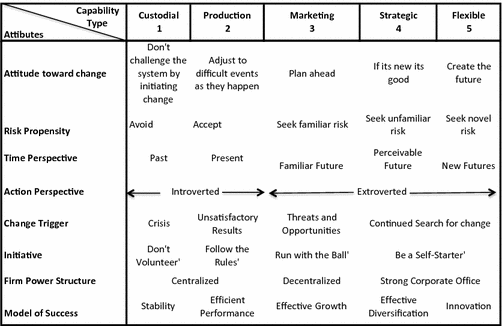
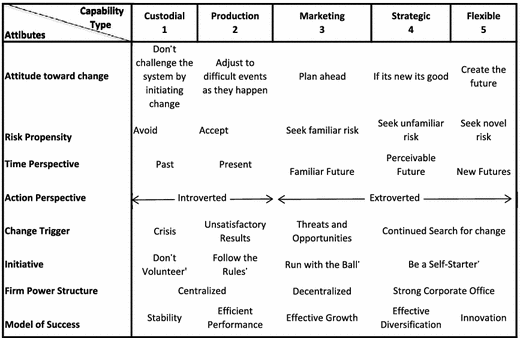
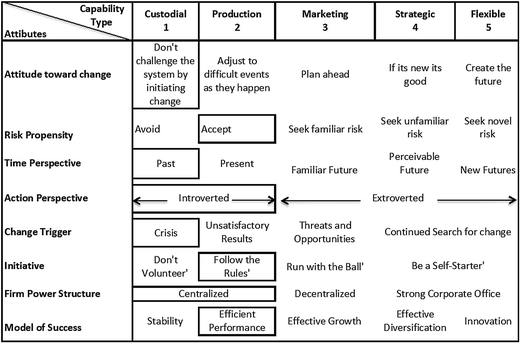
- 2.Management climate profiles (Table 8.4).Table 8.4
Manager’s climate profiles
- 3.
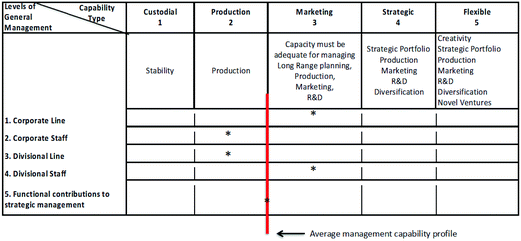
- 4.Management capacity (Table 8.6).Table 8.6
Management capacity
Capability type
Levels of general management
Custodial
1
Production
2
Marketing
3
Strategic
4
Flexible
5
Stability
Production
Capacity must be adequate for managing long range planning, production, marketing, R&D
Strategic portfolio production marketing R&D diversification
Creativity strategic portfolio production marketing R&D diversification novel ventures
1. Corporate line
2. Corporate staff
3. Divisional line
4. Divisional staff
5. Functional contributions to strategic management
- 1.
The first step in diagnosis of capability is to use Tables 8.3, 8.4, 8.5, and 8.6 to identify and circle, on each figure, the description of each attribute which best describes the present capability of the firm.
- 2.
The second step is to average the values of the attributes and draw a vertical line representing this average. Examples are shown in Tables 8.3, 8.4, 8.5, and 8.6.
- 3.
The third step is to enter the average level of each attribute in the lower part of Table 8.2. The entries are then joined by a single line to produce a profile of the firm’s capability.
- 4.
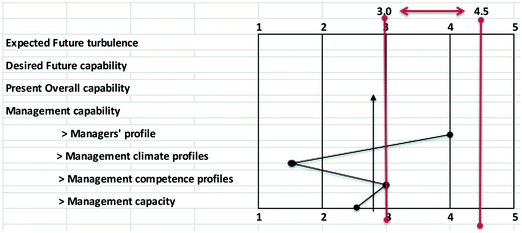
The final step is to draw, on Table 8.2, a single vertical line which will be an approximate average of the points drawn in step 3 just above. Take the vertical line up until it connects with the line ‘present overall capability.’ The point of intersection represents the evaluation of the level of management’s present capability.
A study of the illustration shows that the firm’s present capability is well outside of the range of probable future turbulence .
Capability diagnosis may need to be performed by all management units which directly or indirectly affect the firm’s strategic behavior in the SBA.
In a divisionally structured firm, in addition to the SBU management, divisional management, group level management (if any), and the corporate management may need to participate in the diagnosis.
The importance of involving general management units above the SBU level depends on the management style of the firm. If the style is conglomerate, in which upper levels of management do not interfere with strategic management of the SBU , only the SBU level diagnosis needs to be performed.
If the management style is synergistic, in which there is substantial guidance from above offered to the SBU managers, it may be necessary to make sure that capabilities of the higher management are responsive to the turbulence in the SBA under analysis (see Sect. 3.4.8).
As mentioned earlier, some parts of capability diagnosis , particularly those which evaluate skills, talents, perceptions, and attitudes, are subject to perceptual distortion and personal bias. As a result, there is a danger of producing a capability diagnosis which is biased toward the way individuals would like to be perceived, but which is not necessarily descriptive of the way in which they actually behave.
A method for minimizing distortions due to biases and misperceptions was pioneered by Revans. He applied this method to diagnoses of hospital management. The process involved two sister units from two similar hospitals, the unit which was to be diagnosed and another, similar unit.
Firstly, the unit from one of the hospitals evaluated itself. Secondly, it was evaluated by the peer; and thirdly, they jointly compared self and peer evaluations in an effort to eliminate biases. The roles were then reversed and the process repeated.
The Revans approach has been successfully applied to small business firms in New Zealand where top management groups from a pair of firms followed an identical procedure. The same method can be applied to ‘sister’ units in larger firms. An alternative, and preferable, method which is usable in synergistic firms, is to submit the results of a strategic diagnosis to the higher-level management for challenge, criticism, and modification.
*Choosing the Future Capability
The final step in strategic diagnosis is to select the firm’s target future general management profile. According to the strategic success hypothesis, the future capability of the firm must match the future level of turbulence. However, Table 8.2 illustrates a likely case in which the range of probable future turbulence includes two turbulence levels, namely 3.0 and 4.5.
As the figure shows, the capabilities required by each of the turbulence levels are, respectively, marketing and strategic, which, as our previous discussion has shown (see Fig. 2.1.4), are very different from each other. Therefore, in cases when the range of future turbulence in Table 8.2 is greater than 1, it is not evident which of the two capabilities should be chosen as the target for the firm. This situation is similar to the one we encountered in which it was not possible to choose a specific target for the firm’s competitive position in cases in which the region of uncertainty is large.
- 1.
The range of possible future turbulence levels may be narrow enough to point to a specific capability type which the firm should develop. In this case, the future capability choice is unambiguous and made automatically by the strategic diagnosis.
- 2.
The range may be wide enough to make it impossible to select a particular target capability for the firm. Such cases are typical in environments of low predictability. In such cases, the firm should avoid a commitment to a particular capability, a choice which it could live to regret. Instead, the choice is to follow a path of gradual step-by-step commitment.
Managers’ profiles
Management climate profiles
- 1.
Early steps in capability development should be ‘general purpose’—applicable to a range of different capability profiles . For example, development of environmental surveillance capability.
- 2.
Early steps should also be selected for their ‘learning value’—the extent to which they contribute to a reduction of part of the range of uncertainty due to the firm’s lack of available information about the future environment.
- 3.
The firm’s capability should be made flexible and adaptable to turbulence changes through development of:
Continuous scanning of the firm’s environment for changes in the turbulence level (see Chapters 5.2, 5.3, and Sect. 1.3.6).
Sensitivity to changes in the environment.
Continual challenging of historical success precedents.
A flexible power structure.
Rewards which are focused on the future success of the firm.
Systems and structures which are flexible.
Continual re-evaluation of future prospects, strategies, and capabilities.
- 4.
The firm’s portfolio strategy should provide for a high level of strategic invulnerability (see Sect. 2.6.13).
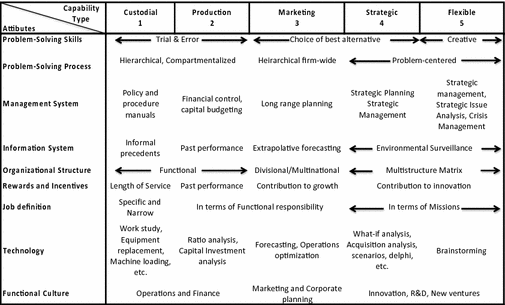
Management competency profiles
Capability type Attributes | Custodial 1 | Production 2 | Marketing 3 | Strategic 4 | Flexible 5 |
|---|---|---|---|---|---|
Problem-solving skills | Trial and error | Choice of best alternative | Creative | ||
Problem-solving process | Hierarchical, compartmentalized | Heirarchical firm-wide | Problem-centered | ||
Management system | Policy and procedure manuals | Financial control, capital budgeting | Long range planning | Strategic planning strategic management | Strategic management, strategic issue analysis, crisis management |
Information system | Informal precedents | Past performance | Extrapolative forecasting | Environmental surveillance | |
Organizational structure | Functional | Divisional/multinational | Multistructure matrix | ||
Rewards and incentives | Length of service | Past performance | Contribution to growth | Contribution to innovation | |
Job definition | Specific and narrow | In terms of functional responsibility | In terms of missions | ||
Technology | Work study, equipment replacement, machine loading, etc. | Ratio analysis, capital investment analysis | Forecasting, operations optimization | What-if analysis, acquisition analysis, scenarios, delphi, etc. | Brainstorming |
Functional culture | Operations and finance | Marketing and corporate planning | Innovation, R&D, new ventures | ||
Management capacity
The Multi-capability Problem
If the capability analysis described in the preceding sections were to be performed on a typical successful firm during the first half of the twentieth century, the number of SBAs would have been few, with one or two usually contributing a dominant percentage of the firm’s profits. Most of the SBAs would have been in comparable stages of growth, with similar competitive challenges and, therefore, on the same turbulence level.
The present capability profiles of different units have been very similar. Thus, during the production-oriented period, key managers would all have shared the production mentality and skills, a firm-wide reward system would have rewarded production efficiency, and the budgeting/control system and functional structure would have assured attention on economies of scale and minimization of costs.
Applications of the capability analysis to firms in the 1990s often showed that the general management capability profile, although different from the first half century, was typically still uniform throughout the firm. All general managers are selected, developed, evaluated, and rewarded according to the same set of criteria. A single information/planning/control system is used to manage all units of the firm, and all parts of the firm are organized on the same principle (functional, divisional, etc.).
Analysis of the SBAs, though, typically produces a range of different turbulence levels and, therefore, the need for different capability profiles , only some of which match the profile of the firm.
In part, this is due to the fact that, since mid-century, SBA growth stages have become differentiated and their competitive, sociopolitical-economic-technological, turbulences have become different. In part, the diversity of needed capabilities is due to the fact that most medium and large firms have diversified from their original businesses. Furthermore, we will discuss in Chapter 2.6, that, to assure long-term success and survival, the firm’s SBA portfolio should be a mix of different life cycle positions, different environments, and different technologies.
Thus, capability analysis frequently reveals that the firm should have not one but several different general management capabilities , each attuned to the needs of its diverse SBAs. As shown in Fig. 8.2, this need is made imperative by intense competition.
These imperative raises what we shall call the multi-capability problem : How can the needs for different management capability profiles be accommodated within a single firm?
One solution is to preserve the historically dominant capability attuned to the SBAs which are the major profit contributors and to accept suboptimal performance in other SBAs. The solution may produce satisfactory results, if the diversity of the portfolio is not great and the competition in them is weak (see Fig. 8.2). This solution offers the advantage of maximum simplicity, least confusion, an opportunity to develop managers imbued with the common culture of the firm, and easily transferable from one part of the firm to another.
A second solution is to reduce the diversity of the firm’s SBAs through divestment to form a coherent portfolio which can be served equally well by the same general management capability . Drastic as it may appear, this solution was being used in the early 2000s by some firms which had been divesting from SBAs which did not fit their historical management capability. It was not unusual to read announcements that a diversified firm was divesting from a particular line of business because it did not fit the management style (e.g., Bayer, Merck, P&G, GE).
A third solution is to manage the firm as a genuine conglomerate in which each subsidiary company is left to develop its own capability profile. In this solution, there are no synergistic links among the subsidiaries, and the overall performance of the firm is a sum of the performances of the subsidiaries. The corporate capability is essentially legal and financial, and both strategic and operations management are left to the subsidiaries. When a subsidiary malfunction chronically, it is sold off, or its top management is replaced.
The fourth solution is to develop distinctive capabilities for different coherent clusters of SBAs, but to continue to manage the firm as a coherent and integrated whole. This is the multi-capability solution .
- 1.
The firm is organized according to the SBU (see Chapter 11) with each SBU matched to a coherent SBA cluster. Each SBU is encouraged to develop a capability profile appropriate to its environment.
- 2.
The corporate management continues to manage the firm strategically as an integrated SBA portfolio. It approves unit strategies, balances the overall strategic portfolio, allocates strategic resources on a global basis, including transfers of resources among SBUs , encourages and develops commonalities and synergies between strategies and capabilities of the distinctive units.
- 3.
The capability profile of the corporate office is flexible, responsive to the different cultures, reward, and management styles of the SBUs.
- 4.
The corporate office uses appropriate interface systems which permits it to integrate the results produced by the systems of the SBUs.
There is evidence that firms are beginning to use the multi-capability solution . For example, the Disney Company, regrouped itself into four different organizational segments, each responsive to a distinctive set of business areas.
Different firms will use different solutions to the multi-capability problem according to the management style and ambitions of their controlling managers. But there are also objective criteria which dictate different choices in different situations. These are illustrated in Table 8.11.
For an explanation of the capability design choices recommended in the figure, we need to refer to Fig. 8.2. That figure shows that, when competition is weak, a firm’s performance in an SBA is relatively insensitive to the capability gap. If the diversity in turbulence levels among the firm’s SBAs is small, use of the capability designed for the SBA which contributes a dominant percentage of the firm’s profits will not substantially degrade the overall performance of the firm.
If the diversity of turbulence levels is high, the conglomerate organizational form is likely to produce a better average performance than the dominant form.
As Fig. 8.2 shows, when competition is strong, performance is highly sensitive to the size of the capability gap. If turbulence diversity is small, we will discuss in Chapter 11, divestment from non-synergetic SBAs becomes desirable.
Finally, if in strongly competitive environments, management desires to maintain a high level of diversity, the new multi-capability solution becomes desirable.
The capability choice
Competition | Weak | Strong | ||
|---|---|---|---|---|
Diversity of turbulence levels | Low | High | Low | High |
Capability | ||||
*Dominant | * ✓ | |||
*Conglomerate | ✓ | |||
*Coherent portfolio | ✓ | |||
*Multi-capability | ✓ | |||
Managing Strategic Posture Transformation
- 1.
The case, which is unlikely today, in which there is no gap in either capability or strategic aggressiveness and, further, the future key success factors are not expected to change significantly. This result gives the firm a clean bill of health: It is strategically ready for the future.
- 2.
The more likely case in which one or more gaps exists: in strategic aggressiveness, in competitive posture , in portfolio, in competition.
When both strategy and capability changes are necessary, a logical approach would be to develop the necessary capabilities first, and change the strategic behavior subsequently. But, as will be recalled from the preceding chapter, Chandler’s and other studies have shown that both strategy and capability transformation are multiyear processes which, on occasion, have lasted as many as ten to twenty years. During the 2020s, few firms will be able to afford the luxury of such slow sequential strategy-capability development.
Therefore, in practice, numerous strategy and capability programs will have to be conducted in parallel. As a result, the required organizational capacity and the budget needed for the programs will be substantial, and strategic work will come into conflict with the profit-making activities.
Furthermore, substantial changes in the strategic posture produce a phenomenon known as organizational resistance to change . Thus, the process of strategic posture transformation is complex, costly, and resistance laden. We shall discuss the management of this process in Part V.
Summary
When a firm’s environment moves to a new turbulence level, the responsiveness of the firm’s capability to the environment stimuli must also move to a different level. If the capability fails to keep pace with the environment, the firm is in danger of losing its competitive position and becoming unprofitable.
At this point in the book, it is appropriate to summarize the results of Parts I, II, and III, all of which have been devoted to the task of selecting the strategic posture that the firm will seek to occupy in the future environment.
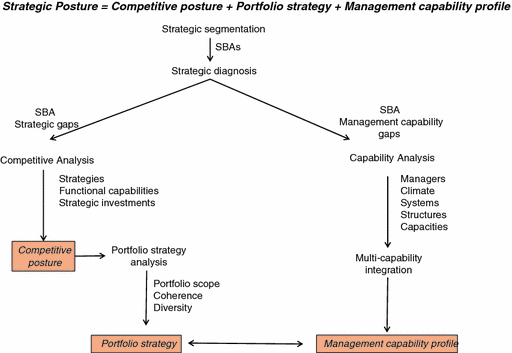
Planning strategic posture
Strategic diagnosis must be applied to each of the firm’s important SBAs. In today’s environment of diverse turbulence, a frequent result is that different SBAs require different capability profiles , thus raising the multi-capability problems . The solutions to the problems are: (1) to disregard them and maintain a dominant capability throughout the firm; (2) to compose the firm’s SBA portfolio of SBAs which require similar capabilities; (3) to manage the firm as a conglomerate whose subsidiaries have distinct capabilities; and (4) to develop a multi-capability firm in which each SBU has a distinct capability profile and the corporate office manages the total strategic portfolio.
The choice of the solution depends on the diversity of turbulence among the firm’s SBAs and on the intensity of competition in each.
The need and the extent of capability changes required by the firm can be determined by means of the strategic diagnosis which diagnoses future turbulence, the firm’s present capability and determines the capability gap.
The choice of the future capability depends on the span of the range of expected future turbulence. If the span is narrow enough to point to a particular capability, the choice is clear. If the span is too wide, the solution is to use a process of gradual step-by-step development of the capability, accompanied by increasing the adaptability of the capabilities.
Exercises
- 1.
Is the strategic posture analysis developed in this chapter applicable to nonprofit institutions such as a church or a hospital? If not, explain why. If yes, how would you apply the analysis to such organizations?
- 2.
Using an organization familiar to you, or a case assigned by your tutor, make a complete strategic posture diagnosis following procedures given in Chapters 9–11.
- 3.
Following the diagnosis, determine the new posture for the organization. Be specific about the criteria and the reasoning through which the new posture is chosen.
- 4.
As a member of the corporate staff in a widely diversified large firm, you have been assigned the problems of developing pro and con arguments on the desirability of developing a multi-capability within the firm. Carry out your assignment.
- 5.
If multi-capability is to be introduced, how would you go about selecting aspects of capability which should be left for determination by each SBU , and which should remain common throughout the firm? Give examples of each category.
