8
Dual Clutch Transmissions
8.1 Introduction
Dual clutch transmission (DCT) combines the advantages of manual transmission (MT) and conventional automatic transmission (AT). DCT vehicles feature the convenience and comfort of AT vehicles and a fuel economy comparable to that of MT vehicles. In addition, DCT is less costly to manufacture in comparison with AT since it shares similar structure and components with MT.
As illustrated in Section 8.2, a DCT is structurally a combination of two manual transmissions, one with even gears and the other with odd gears. While the transmission operates in the current gear, the next gear is already engaged, since the related clutch is open and the related gears freewheel. A gear shift is realized by releasing the currently applied clutch and applying the clutch for the next gear. Gear shifting of a dual clutch transmission is then in kinematics similar to that of clutch‐to‐clutch shift in a conventional AT. However, the dynamic characteristics are different between the two types of transmissions since the AT is equipped with a torque converter that dampens shift transients. The existing control technologies for conventional AT cannot be readily applied for DCT shift control. Moreover, more precise torque control is required to achieve launch and shift smoothness of DCT vehicles since there is no torque converter between the engine and the transmission input. Extensive research and testing has been conducted by engineers and researchers in the automotive industry on the launch and shift control of DCT vehicles. A model‐based study was successfully conducted on DCT applications for medium duty trucks [1]. Shift dynamics and transmission control were investigated by model simulation for vehicles equipped with DCTs [2,3]. A gearshift control strategy for twin wet clutch transmission was developed and integrated with engine control to achieve synchronization during the transfer of engine torque from clutch to clutch through clutch slip control [4]. A system control approach, consisting of various control loops including engine speed control, clutch slip control, and transmission output torque control, was developed for gear shifts of twin clutch transmissions [5]. Torque based control, which synergizes the engine torque control and clutch torque control, was developed for AT vehicles to optimize shift qualities [6–8] and is applicable for DCT shift controls. To enhance the DCT torque control precision, a systematic model is proposed to analyze the dynamic characteristics of DCTs based on prototype vehicle testing [9], and a further study is focused on the clutch torque formulation and calibration for dry DCTs [10,11].
Due to its advantages in fuel efficiency and cost, DCT products attracted extensive development interests in the automotive industry and DCT equipped passenger vehicles have been on the market for more than a decade. General descriptions of DCT development status can be found in the public domain [12–14]. Ford Motor Company developed DCTs for applications in both its subcompact Fiesta and compact Focus models around 2010. VW has applied DCTs across its passenger car product line for over a decade. Other OEMs have also occasionally applied DCTs for their passenger vehicle products, even though the applications are not widespread. It can be predicted that DCT vehicles will continue to take market share from vehicles equipped with other types of transmission.
Following this introduction section, the chapter will continue with Section 8.2 on the structural layouts of DCT systems and key components, including the basic DCT structure and kinematics. Current DCT production types will be presented also in the section. Section 8.3 will then concentrate on the dynamic modeling and analysis of DCT operations, including DCT vehicle launch and shifts. Section 8.4 will deal with the control system design and the control of ratio changing processes. Section 8.5 will present DCT clutch torque formulation for accurate clutch torque calculations during launch and shifts, using an electrically actuated dry DCT as the example in the case study. Since DCTs share with manual transmission in basic layouts and gear design, readers are referred to Chapter 2 and Chapter 3 for related topics.
8.2 DCT Layouts and Key Components
Dual clutch transmissions share similar components and basic structure with manual transmissions. A DCT can be considered in structure and in kinematics as a combination of two manual transmissions, with one providing the odd gears and the other the even gears. Two input shafts in a compact hollow‐solid layout take up the engine output through the respective clutch. The structure of a typical DCT is illustrated in Figure 8.1. This DCT layout has been used in Ford subcompact and compact passenger cars. Some other DCT designs may also have the two input shafts in a parallel layout.
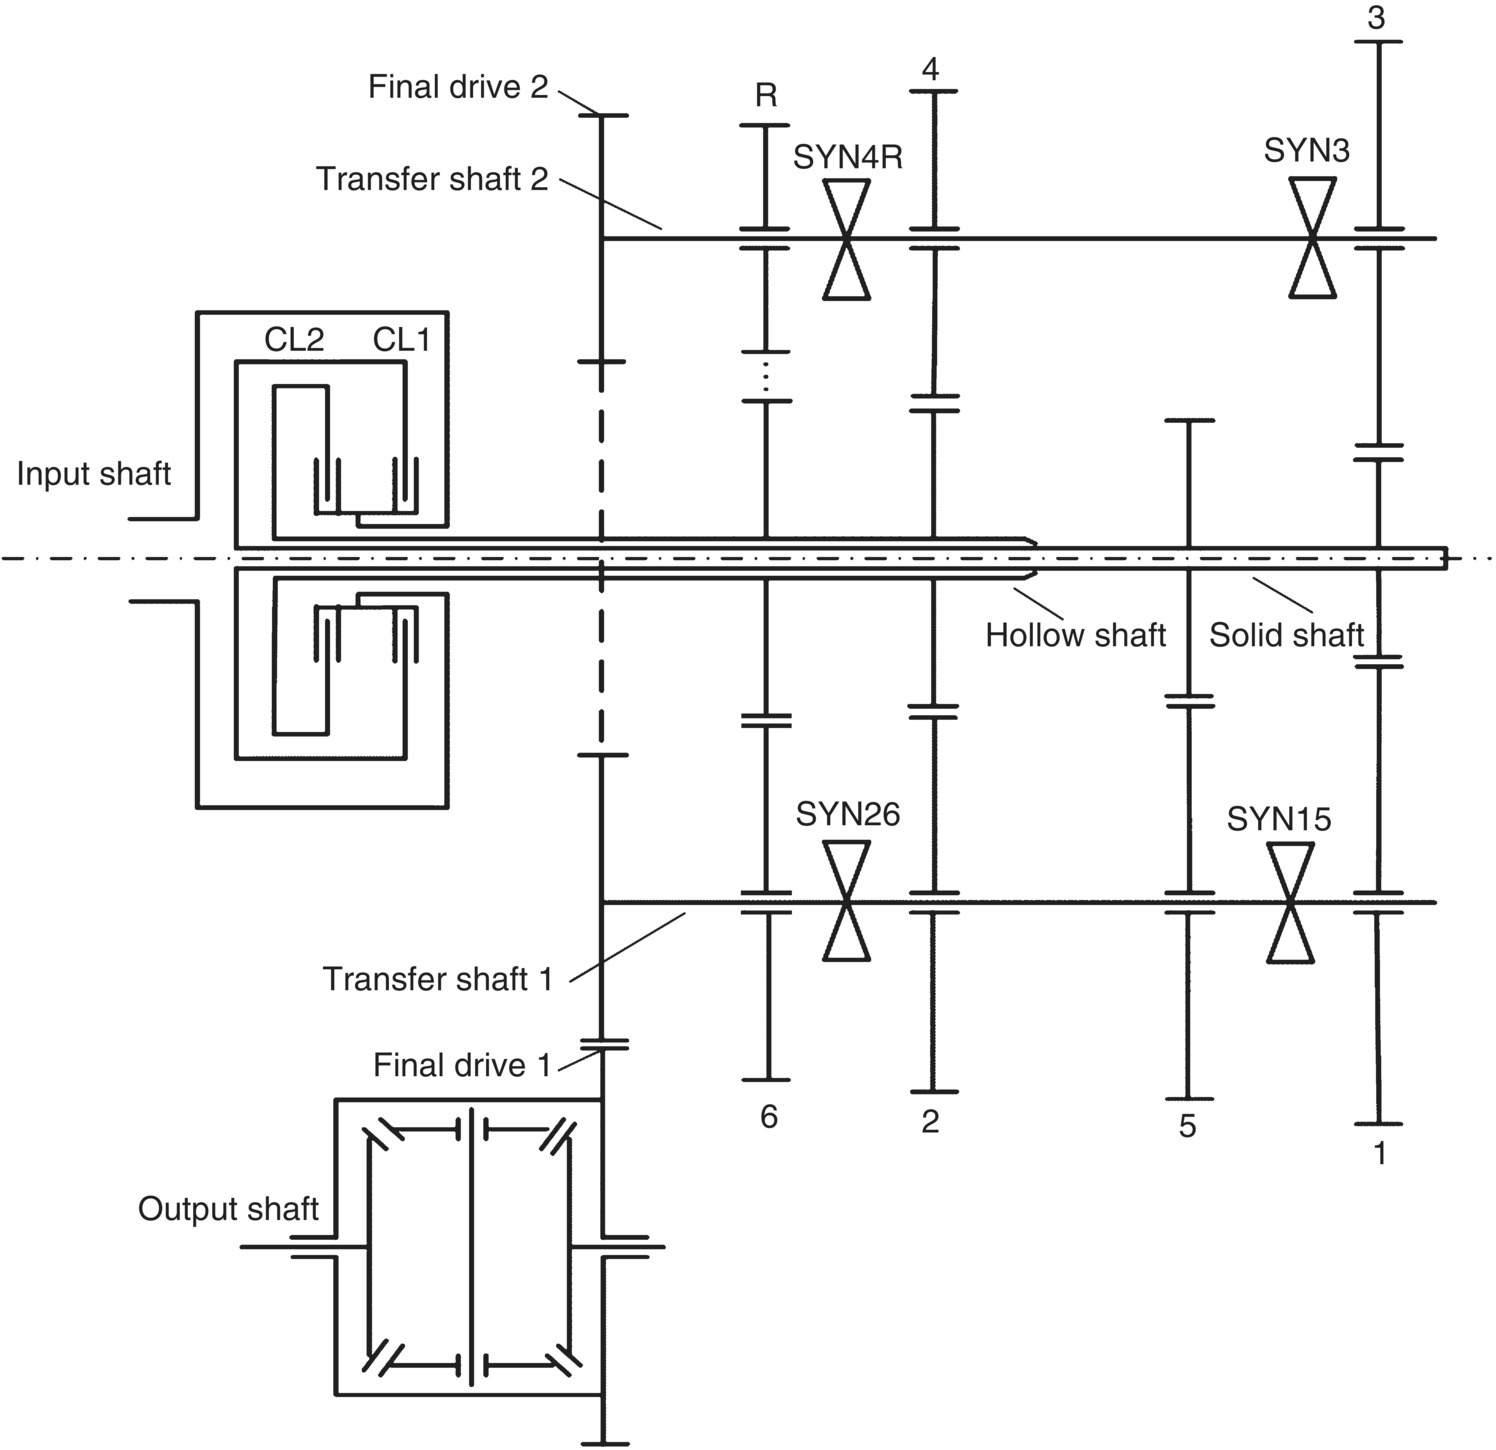
Figure 8.1 Dual clutch transmission structural layout.
The transmission shown in Figure 8.1 has six forward speeds and one reverse, with odd gears on the solid shaft that is connected to the engine by clutch 1 (CL1) and even gears on the hollow shaft connected by clutch 2 (CL2). Reverse gear is achieved by using the sixth output gear as the idler. There are two final drive pinions, one on transfer shaft 1 and the other on transfer shaft 2, that drive the same ring gear, providing two different final drive ratios. Gear shifts only involve the engagement of the oncoming clutch and the release of the off‐going clutch since the oncoming gear is preselected. For example, when the vehicle runs in first gear, clutch CL1 is engaged but clutch CL2 is open, and both the first gear and the second gear are engaged by the respective synchronizers which were discussed in Chapter 2. The first gears transmit power from the engine to the transmission output, while the second gears freewheel with the open clutch CL2. A 1–2 shift is then realized by disengaging clutch CL1 and engaging clutch CL2 in the 1–2 shift process. The operations in other gears and related shifts follow similar patterns.
8.2.1 Dry Dual Clutch Transmissions
Dual clutch transmissions are categorized as dry or wet according to the actuation of the dual clutch module. In a dry DCT, the two clutches in a compact pack are a single‐disk type that is actuated by the respective release bearing via a diaphragm spring. For dry DCTs, the release bearings and the synchronizers can be controlled either electrically or hydraulically. In an electrically actuated dry DCT, the two clutches are controlled by electric motors through the respective control mechanisms, and the gear shifts are also controlled by electric motors through shifting drums that convert the motor’s rotational motion to linear motion for the positioning of the synchronizers. The dual clutch module, the clutch control actuator, and the shift drums of the six‐speed dry DCT shown in Figure 8.1 are illustrated in Figures 8.2, 8.3, and 8.4, respectively.
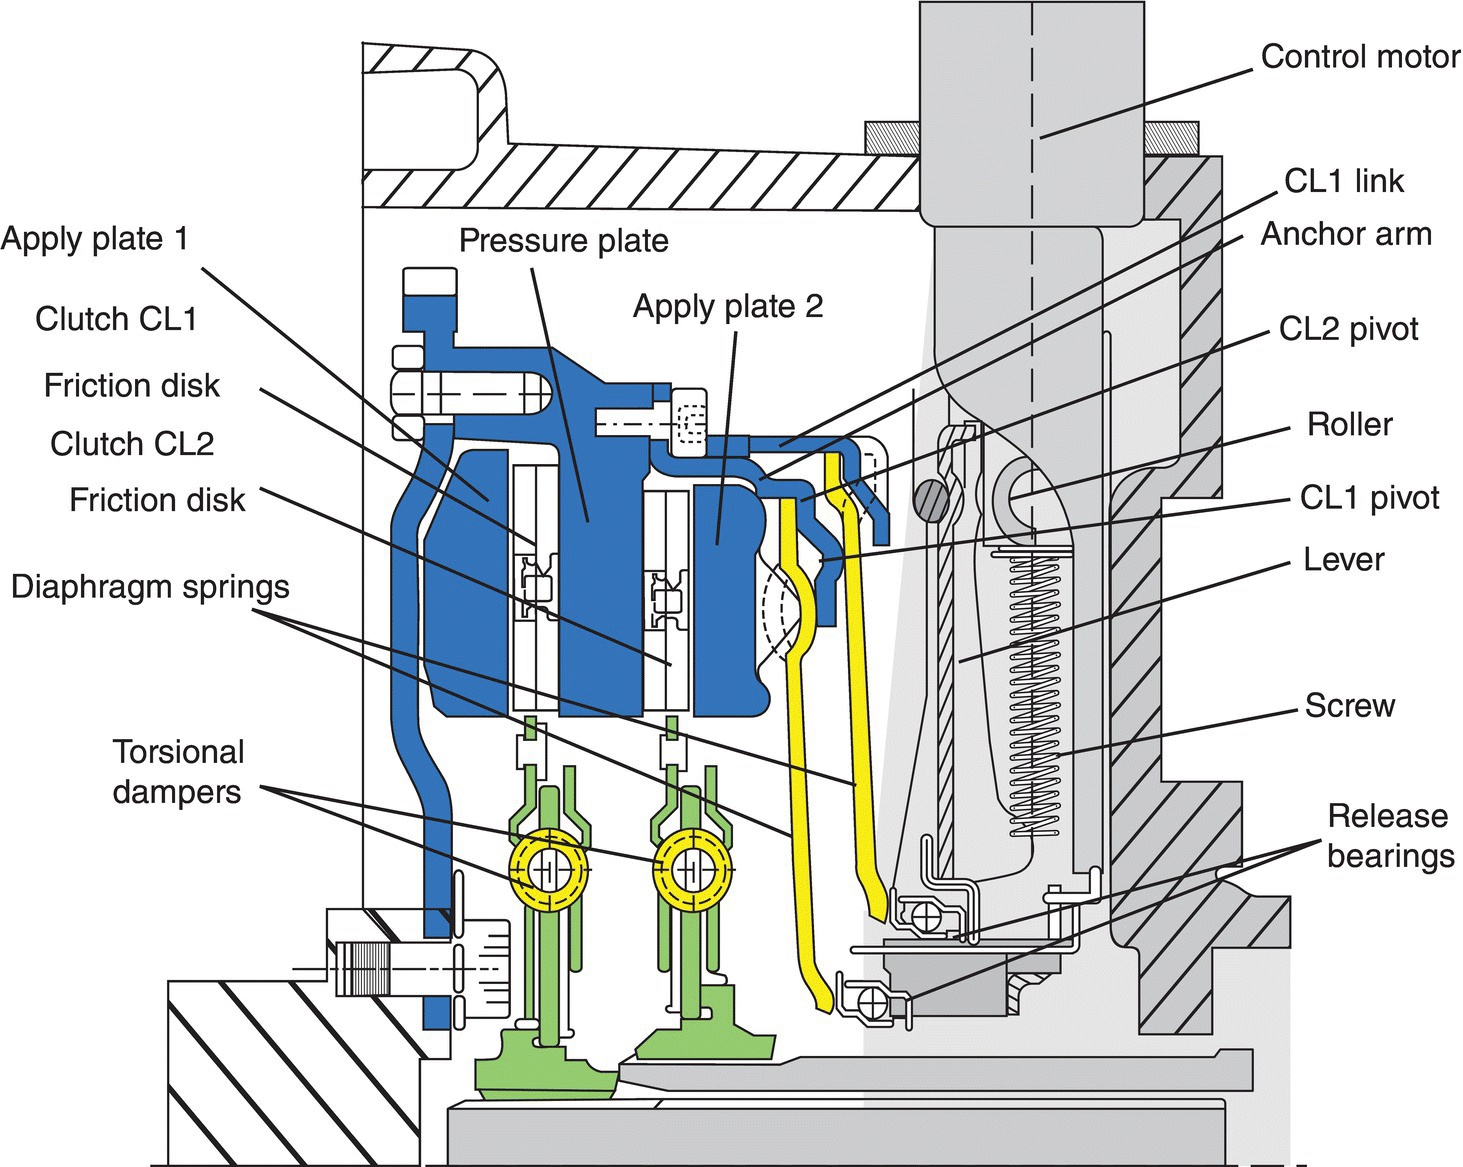
Figure 8.2 Section view of dry dual clutch module and clutch actuator.
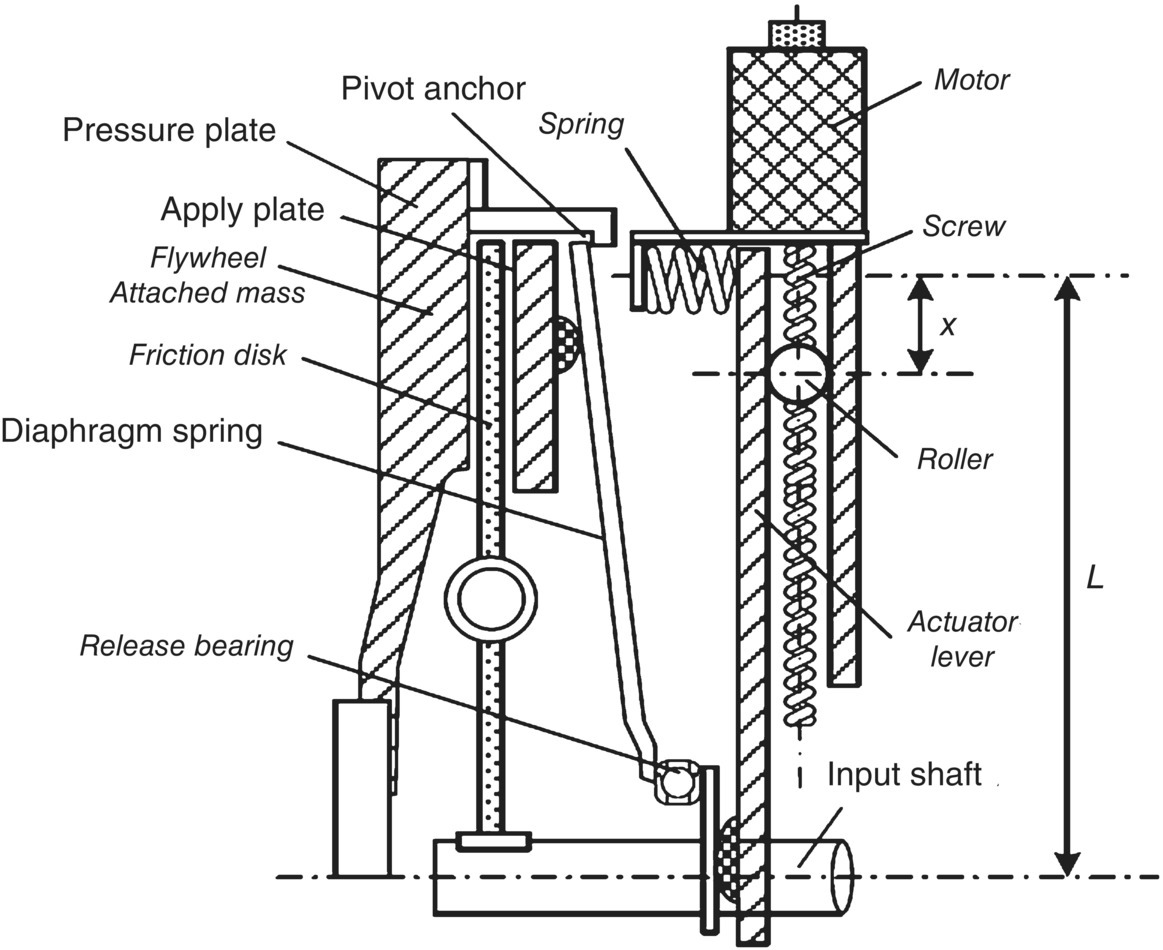
Figure 8.3 Dry DCT clutch control mechanism.
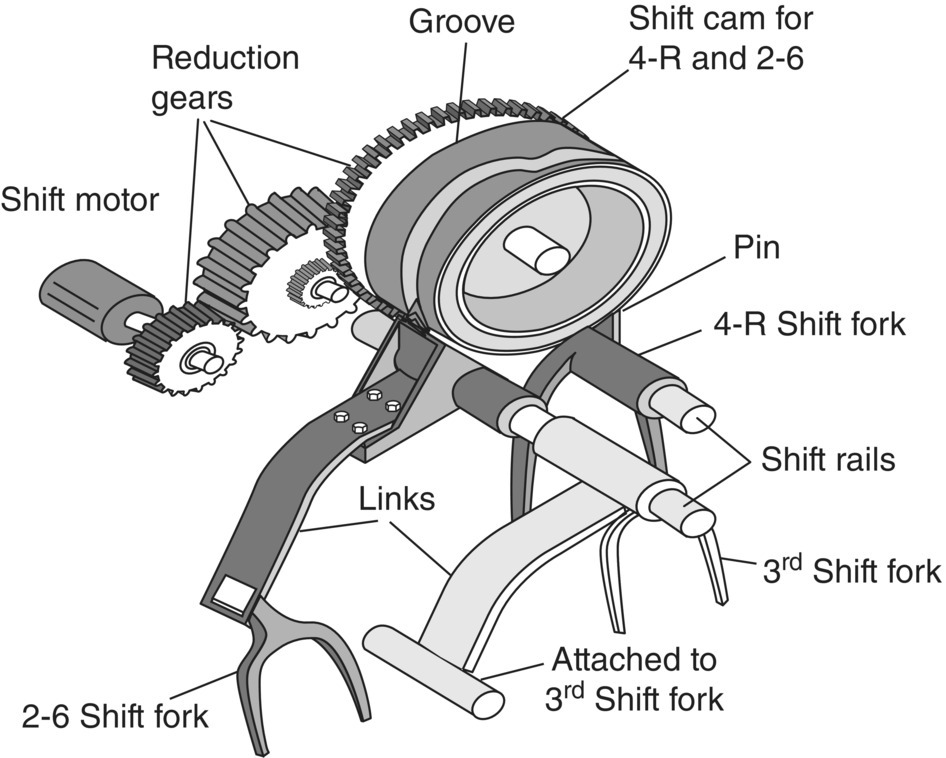
Figure 8.4 Dry DCT gear shifting cams.
As can be observed in Figure 8.2, the dry clutch module contains two friction disks and two release bearings, one for each clutch. Torsional spring dampers are assembled with both friction disks to dampen the dynamic transients during vehicle launch and shifts. In some other designs, a torsional spring damper may also be installed on the flywheel side to enhance the damping effects. The pressure plate assembly is attached to the engine flywheel and carries the two apply plates via flexible links (as shown in Figure 8.6c) to rotate with the flywheel as discussed in Chapter 2. The two apply plates are allowed to move slightly along the axial direction due to the flexible links. The pressure plate also carries the pivoting anchor on the anchor arm for each diaphragm spring, so the two diaphragm springs also always turn with the flywheel. The upper end of the CL1 diaphragm spring then contacts the CL1 link which is connected to the CL1 apply plate, as shown in Figure 8.2. Unlike the clutch in a manual transmission, which has a normally engaged clutch, clutches in a DCT are normally open, i.e. the clutch stays open unless engaged by the clamping force. As shown in Figure 8.2, the inner side of each diaphragm spring then contacts the respective release bearing which travels slightly on the input shaft when actuated by the control motor. Clamping force will be generated on the friction disk of a clutch if the respective release bearing is actuated by the motor to move leftward. For example, when release bearing 1 moves leftward, it will carry the inner side of the diaphragm spring of clutch CL1 and will displace the outer side of the CL1 diaphragm spring rightward, carrying with it the apply plate 1 to clamp the CL1 friction disk against the pressure plate. And the diaphragm spring also works as a lever that magnifies the force applied by the release bearing on its inner side. The friction torque generated by the clutch depends on the apply force on the release bearing, as will be detailed in later sections.
The core of the actuator for the dual clutch module is the mechanism that controls the travel of the release bearing along the input shaft. There are two such mechanisms for the dual clutch module. The one illustrated in Figure 8.3 is for clutch CL2 for the clutch module shown in Figure 8.2. The control mechanism for clutch CL1 is identical in structure and in operation principle.
As shown in Figure 8.3, the screw is turned with the control motor and displaces the roller along the screw axis. The roller displacement is linearly proportional to the motor rotation. The spring attached to the top of the actuator level is under compression at assembly. The force applied by the release bearing on the inner side of the diaphragm spring depends on the compressive spring force at the top of the actuator lever and the displacement of the roller along the screw axis. Therefore by controlling the rotation of the control motor, the roller displacement along the screw axis will be controlled to the amount that the force applied by the release bearing to the diaphragm inner side is what is needed to generate the required clutch torque. For the dual clutch module of a dry DCT, two identical control mechanisms are assembled in a compact package as illustrated in Figure 8.2. The quantitative formulation on the correlation of clutch torque and motor rotation will be discussed in Section 8.5.
The drums or cams for gear shifting are illustrated in Figure 8.4. A shift drum is, in kinematics, a cylindrical cam with screw grooves. Figure 8.4 illustrates the shifting mechanisms for the Ford six‐speed DCT shown in Figure 8.1. There are two shifting cams, one for the 4–R and 2–6 synchronizers, and the other (not shown in Figure 8.4) for the 5–1 and 3rd synchronizers. During gear shifts, the shifting sleeve of the synchronizer involved is translated along the gear shaft by the shift fork which slides on the shift rail. A shift fork can be supported on two shift rails to make its axial motion more conducive. A round pin on the shift fork is positioned into the screw groove of the shifting cam, as shown in Figure 8.4. As the cam turns, the pin in the screw groove moves axially and the displacement of the pin is linearly proportional to the rotational angle of the shifting cam by the screw pitch. The rotation of the shifting cam is actuated by the shift motor through a set of reduction gears, which can be spur gears or worm gears, depending on the gear box layouts. By controlling the rotational angle of the shift motor, the shift fork – i.e. the shifting sleeve of the synchronizer – will be accurately controlled at the position required for the engagement or disengagement of the target gear.
Each of the shifting cams shown in Figure 8.4 is machined with two screw grooves, each of which locates a pin attached to a respective fork shaft. The pitch lines of the two screw grooves are designed with ramps that enable the fork shaft to move axially during gear engaging or disengaging and with flat slots that keep the fork shaft at the same position. The ramps and the flat slots are aligned such that the axial motions of the fork shafts do not interfere with one another.
For the DCT in Figure 8.1, the 4–R and the 2–6 synchronizers share the same shifting cam. The two pitch lines for the two cam groves are shown in Figure 8.5. The pitch line of a cam groove consists of ramps and flat sections. Ramps are for the screw profiles that enable fork shaft motions for gear engaging or disengaging. Flat sections are for the flat grooves that keep the fork shaft (i.e. the respective gear) at the neutral position. As shown in Figure 8.5, there is no overlapping between the ramps for the 4–R synchronizer and for the 2–6 synchronizer. Therefore the engaging and disengaging of the 4th and reverse gears will not interfere with that of the 2nd and 6th gears.
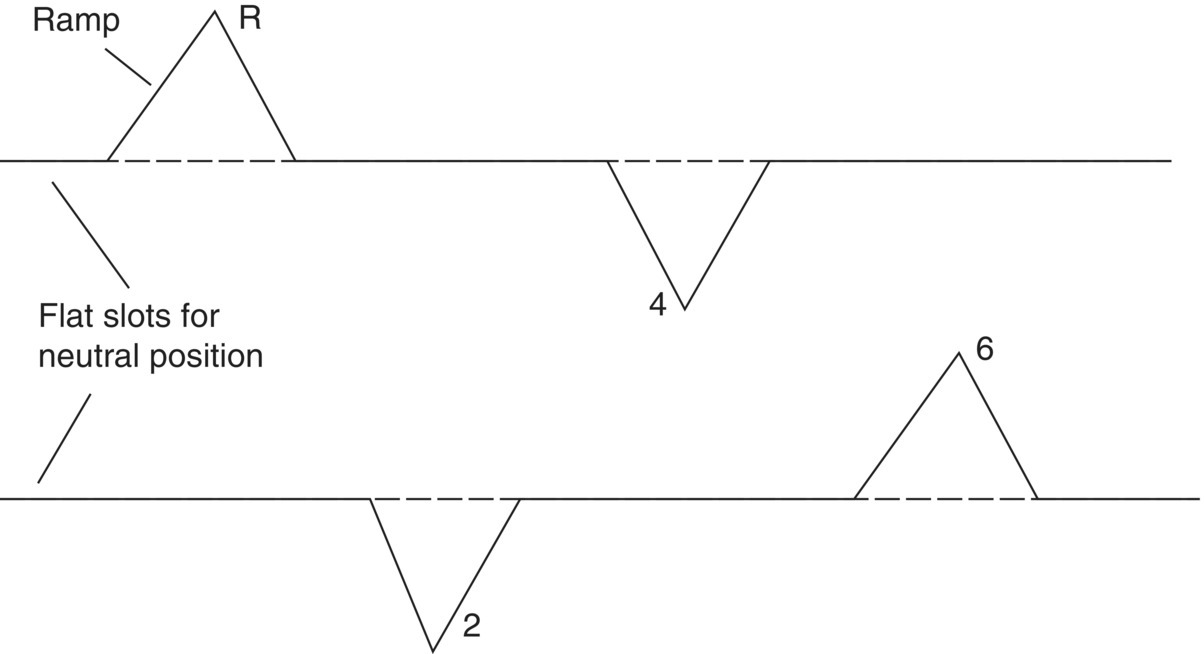
Figure 8.5 Pitch lines for shifting cam grooves.
The clutch actuation and gear shifting of dry DCTs can also be realized hydraulically. A production DCT of this type is shown in Figure 8.6. This dry DCT has been used in VW compact to midsize passenger cars. In this DCT, the actuation of the dual clutches is controlled by two hydraulic pistons via actuation levers. The gear engaging and disengaging motions are also realized by hydraulic pistons. In this type of DCT, a hydraulic booster is usually used to compensate the fluctuations of hydraulic pressure during clutch actuation and shifts caused by the fairly large piston displacements.
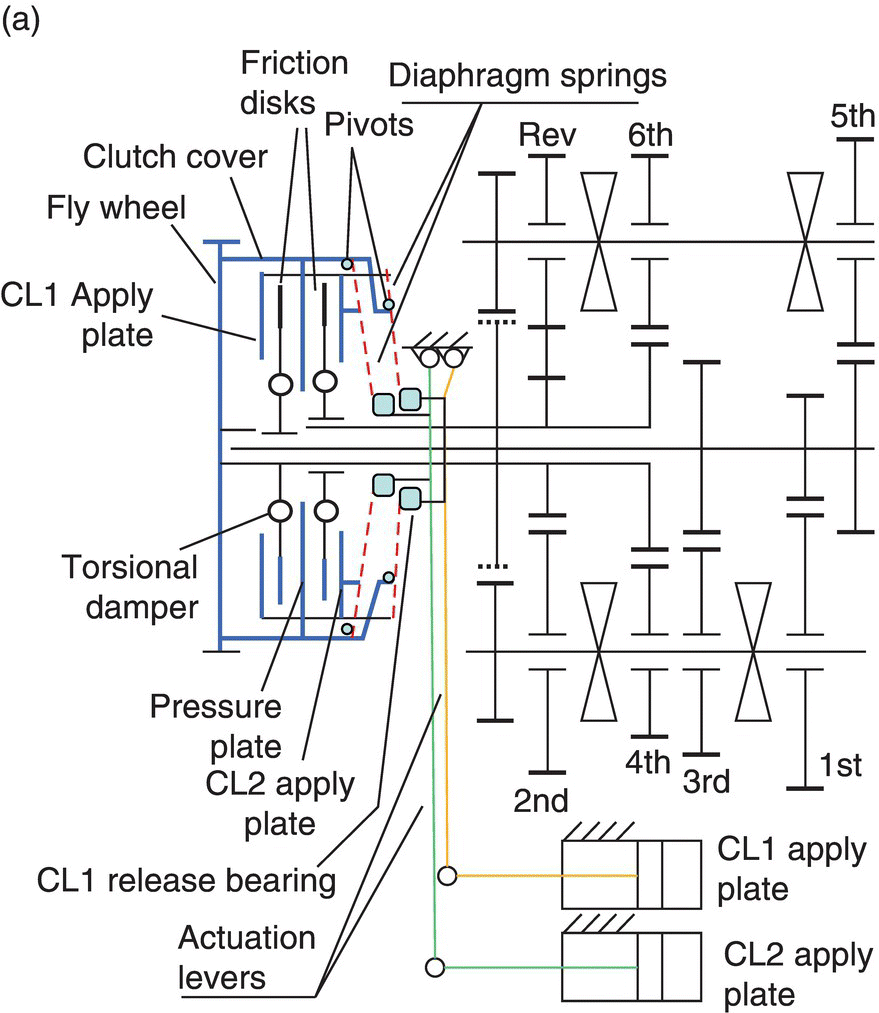
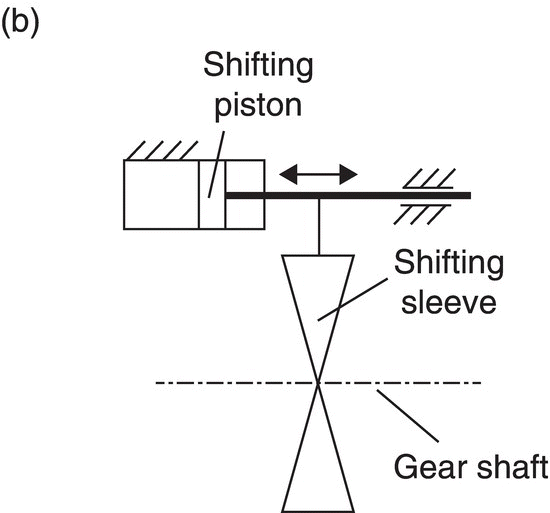
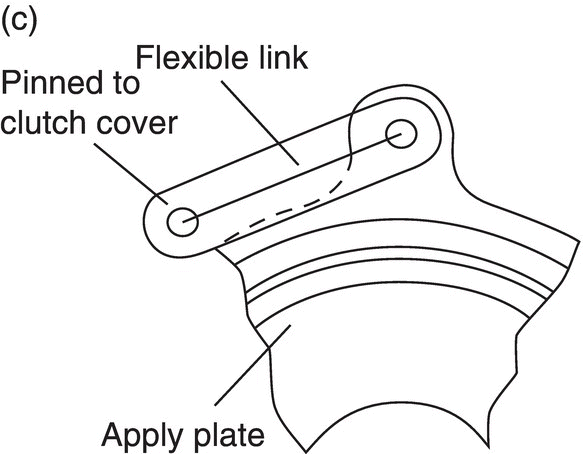
Figure 8.6 Dry DCT with hydraulically actuated clutches and gear shifting.
The actuation of the dual clutches in dry DCTs can also be realized by hydraulic pistons that push the release bearings. The two pistons with ring‐shaped effective piston areas, one for each release bearing, are in a compact nested package that is installed on the hollow shaft and is fixed to the transmission housing. These two pistons are linked by hydraulic hoses to two slave pistons with smaller effective areas. The slave pistons are located away from the clutch well, resulting in more packaging room and better heat dissipation for the dual clutch module. The slave pistons can be controlled by electric motors via screw mechanisms that convert the rotations to linear displacements. The piston force on the release bearing is the force on the slave piston multiplied by the ratio between the respective piston effective areas. This clutch actuator design is also conducive to reducing vehicle launch and shift harshness. Gear shifting in this design is also realized by hydraulic pistons, as shown in Figure 8.6b.
8.2.2 Wet Dual Clutch Transmissions
The gear shaft layouts in wet dual clutch transmissions are similar to those in dry DCTs, as shown in Figure 8.7. The dual clutches in wet DCTs are multiple disk clutches similar to those in conventional automatic transmissions. The two clutches are nested in a compact module as illustrated in Figure 8.7a. Transmission shifts are realized by engaging the oncoming clutch and releasing the off‐going clutch synchronously as in clutch to clutch shifts of conventional ATs. Gears are engaged or disengaged by hydraulic pistons that position the synchronizer sleeves according to the target gear as illustrated in Figure 8.7b. As mentioned previously, the next target gear is engaged already while the DCT operates in the current gear. Gear engaging or disengaging is therefore not related to the transmission shifting process and shifting quality only depends on clutch control. A hydraulic system with the pump powered by engine or electric motor provides the pressure required for the control of clutches and the gear shifting pistons.
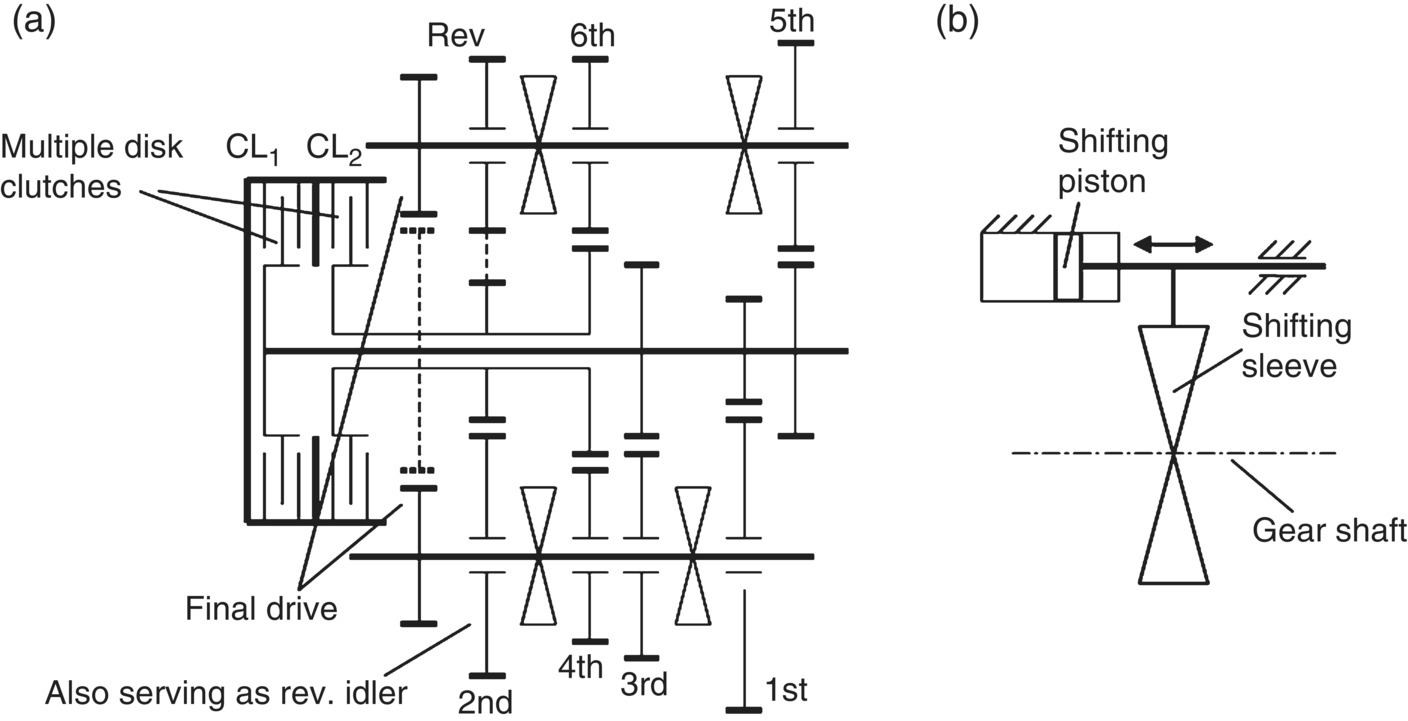
Figure 8.7 Wet DCT layout and gear shifting pistons.
The actuation of shifting pistons is controlled by shifting solenoids that are actually hydraulic switches routing the ATF flow paths according to the shift logic. The actuation of the dual clutches is realized by variable force solenoids, one for each clutch, that accurately control the hydraulic pressure in the oncoming clutch and off‐going clutch, as detailed in Chapter 6.
Both dry and wet DCTs have been successfully applied for production vehicles. Dry DCTs have cost advantage over wet DCTs because of the simplicity in the control system for clutch actuation and gear shifts. Wet DCTs intrinsically have higher torque capacity because multiple disk clutches are used instead of single disk clutches. In the following sections, dry DCTs will be the focus of discussion since the shift dynamics and control of wet DCTs are in line with that of conventional ATs.
8.3 Modeling of DCT Vehicle Dynamics
The dynamic model for the transmission in Figure 8.1 just described is shown in Figure 8.8. The input and output shafts are modeled as spring‐dampers. Gear shafts are modeled as lumped masses. The four synchronizers are modeled as switches that route power flows since gear engaging or disengaging does not occur during shifts and thus does not affect shift quality. As indicated in Figure 8.8, the mass moments of inertia of the lumped masses are denoted as follows: engine output assembly (Ie), clutch input side (I1), hollow shaft (I2), solid shaft (I3), transfer shaft 1 (I4), transfer shaft 2 (I5), output shaft (I6). In similar fashion, ωe, ω1, ω2, ω3, ω4, ω4, and ω6, denote the respective angular velocities. The stiffness and damping coefficient for the input shaft and output shaft are denoted by ki, ko, ki and ci, co, respectively. The vehicle equivalent mass moment of inertia on the output shaft is denoted by I.
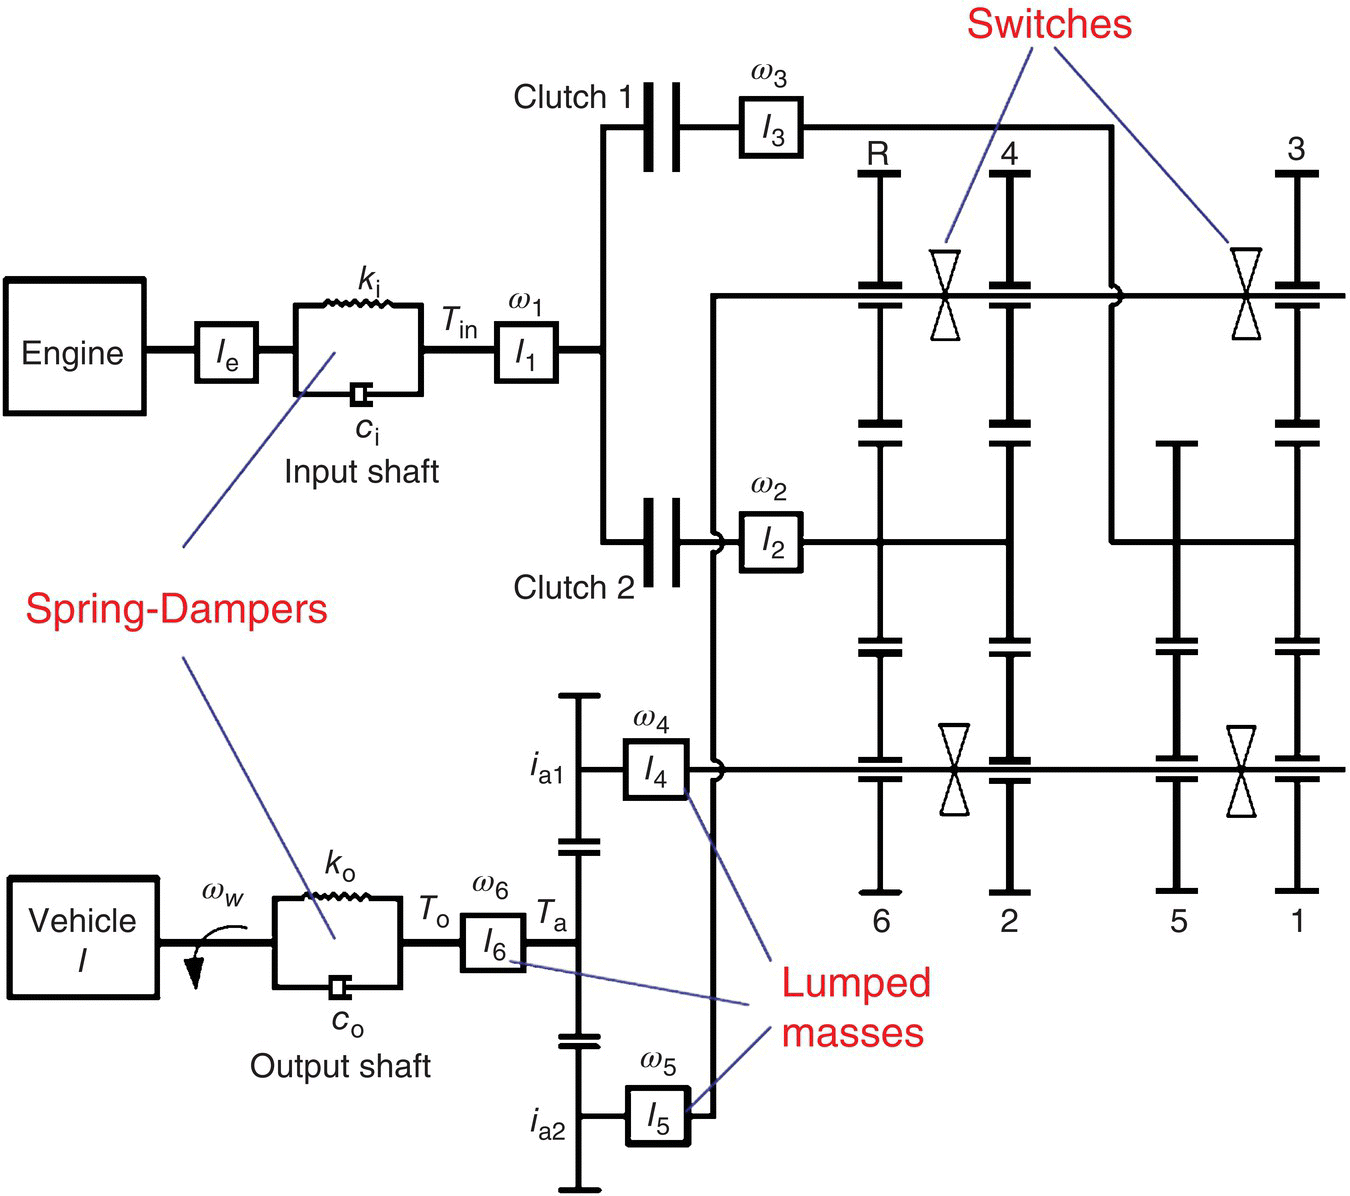
Figure 8.8 DCT dynamic model structure.
8.3.1 Equations of Motion during Launch and Shifts
Separate systems of equations are required to govern the DCT power train system dynamics because of the different power flow paths and clutch statuses. The equation of motion for vehicle launch, 1–2 upshift and 5–4 downshift are presented in the following. For other operation modes, the equations of motion can be derived according to the power flow path in a similar fashion.
Launch: In the launch operation, both the first and second gears are engaged. The clutch torque in clutch CL1 is gradually increased by its actuator until it is fully closed while clutch CL2 is open. The system of equations of motion is as follows:
where i1 is first gear ratio, ia1 is final drive ratio which is shared by first, second, fifth, and sixth gears, Ta is the final drive output torque,  is the equivalent mass moment of inertia on the solid shaft in first gear for the lumped masses, including the transfer shaft 1, assembly of the solid shaft, and all other components rotating accordingly in first gear. Equations (8.4) and (8.5) can be combined to drop out Ta so as to form a system of four state variable equations. There are four independent state variables –
  ,
,  ,
,  , and
, and  – since ω3 and ω6 are related by
  . The input shaft torque Tin, output shaft torque To, and road load torque TLoad are expressed by the following equations:

where ωw and θw are the angular velocity and angle of rotation of the wheel, f is rolling resistance coefficient, r is tire radius, and RA and RG are the air and grade resistance respectively, as formulated in Chapter 1. The engine torque Te in Eq. (8.1) is a function of engine velocity ωe and throttle angle ϕT, as shown in the engine map Figure 8.9.
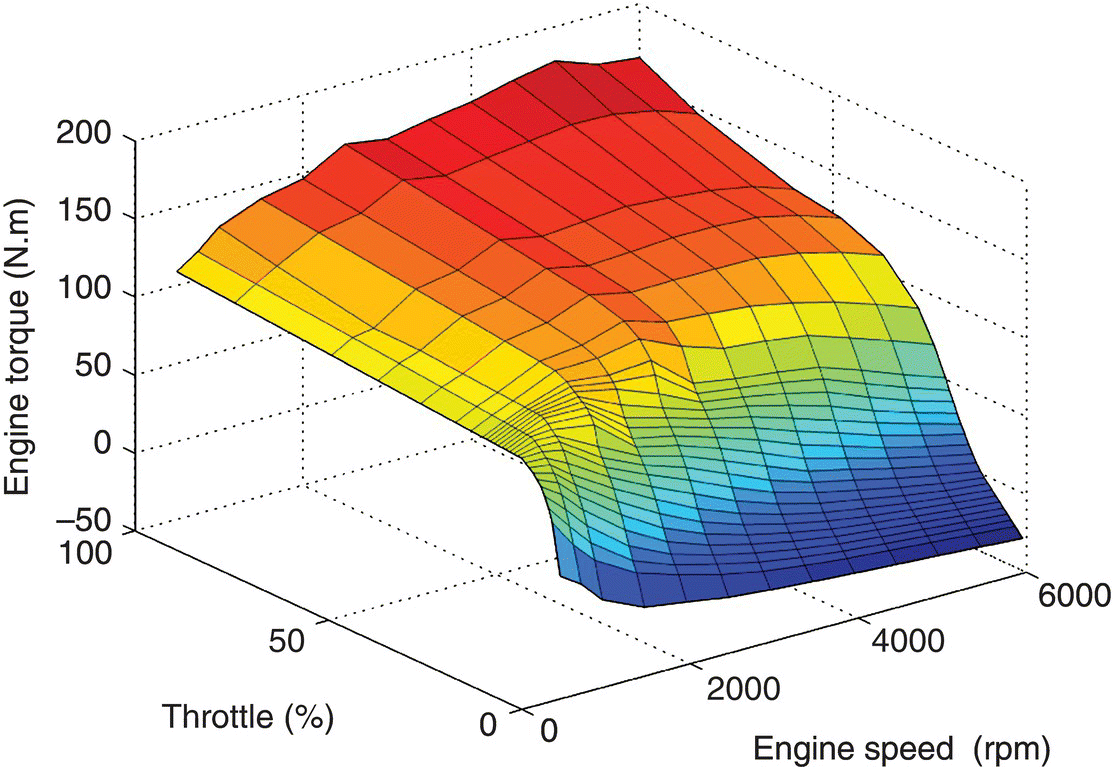
Figure 8.9 Engine torque output in terms of throttle opening and speed.
Clutch torque TCL1 is a control variable during the vehicle launch process. When fully engaged, the vehicle runs in first gear and the clutch then mechanically links the engine output shaft to the transmission input. The clutch status is determined by the angular velocities of the clutch input and output sides with clutch torque determined by the following equation:

where P1 is the clamping force on clutch pressure plate which is controlled by the clutch actuator, C1 is a constant related to clutch dimension, and μ1 is the clutch friction coefficient. The clutch actuator for the DCT used in the example vehicle uses a screw‐lever mechanism shown in Figure 8.3. The structure and kinematics of the clutch actuator design have been previously described.
The initial condition for the system of Eqs (8.1–8.5) is given as:  ;
;  ,
,  ;
;  . Here,
  is the engine angular velocity at which the vehicle is launched. When the vehicle runs in first gear, angular velocities ω1 and ω3 are the same. Eqs (8.2) and (8.3) are then combined into one equation. The remaining equations then form the equation system for first gear operation.
Upshifts: Similar to conventional automatic transmissions, DCT shifts involve two stages: the torque phase when gear ratio remains unchanged and the inertia phase when the gear ratio is gradually changed to the value of the next target gear. Due to the difference in clutch status, two sets of equations are required to describe the system dynamics for the two stages in a shift process. The system equations for 1–2 shift are presented in the following, which can be easily extended to other shifts.
In the torque phase we have:


where ω6 is equal to ω1/(i1ia) since the first gear ratio has not changed yet. The state variable equation system is formed by the four equations Eqs (10–13). The variables that need to be solved from the equation system above are:  ,
,  ,
,  , and TCL1. Clutch torque TCL2 is the control variable that is gradually ramped up following a pre‐determined profile as shown in Figure 8.13. Equations (8.6–8.8) have given us expressions for Tin, To, and TLoad. The initial condition for the torque phase of 1–2 shift corresponds to the status of the vehicle operation in first gear when the shift starts.
As soon as clutch CL1 starts to slip, the torque phase finishes and the inertia phase starts. In real time control, the threshold point can be detected by speed sensors that measure the angular velocities of the transmission input and output. In simulation, this point is determined by comparing the clutch torque TCL1 solved from the system of Eqs (8.10–8.13) and the clutch torque capacity  which depends on clutch design and control parameters. As soon as the inertia phase starts, the system dynamics is then governed by another set of equations presented as follows.
During the inertia phase, the angular velocities ω1 and ω6 are no longer related by the gear ratios ia1 and i1. Angular velocities  ,
,  ,
,  , and
, and  are independent variables to be solved from the equation system governing the system dynamics. Both clutch torques, TCL1 and TCL2, are control variables during the inertia phase as shown in Figure 8.13. The system equations of motion for the inertia phase are expressed as follows:


The initial condition for the solution to the system of Eqs (8.14–8.17) corresponds to the system status at the end of the torque phase. The inertia phase ends when ω1 is equal to ia1i2ω6. This completes the process of 1–2 shift and the vehicle enters operation in second gear.
Downshifts: In a power‐on downshift, the torque of the off‐going clutch must be decreased rapidly to slip the clutch before applying pressure in the oncoming clutch in order to avoid clutch tie‐up and backward power circulation. Therefore, the inertia phase must come before the torque phase in a power‐on down shift. A 5–4 shift is used as example for the system of equations for down shifts. This example can be extended to all other downshifts.
First, in the inertia phase, to start the 5–4 power‐on downshift, clutch torque TCL1 must be decreased rapidly to produce slippage in clutch CL1 before clutch CL2 is pressurized. The slip threshold of clutch CL1 is reached when  , where
  is the torque capacity of clutch CL1 which is controlled to decrease rapidly by the control motor as shown in Figure 8.3. The inertia phase starts as soon as the off‐going clutch CL1 starts slipping. During the inertia phase of a 5–4 power‐on downshift, both the off‐going clutch CL1 and the oncoming clutch CL2 slip, with the oncoming clutch torque TCL2 ramped up rapidly and the off‐going clutch torque TCL1 ramping down even more rapidly. Both clutch torques, TCL1 and TCL2, are control variables in the inertia phase. The vehicle powertrain dynamics is governed by the following:


Since both clutches slip, the angular accelerations  and
and  are not related to
  by the ratios of the fourth and fifth gears. Therefore, the equation of motion for the gear shafts is written on the transmission output shaft whose mass moment of inertia is labeled as I6. In the system of state variable equations above,
  ,
,  ,
,  , and
, and  are independent state variables to be solved. During the downshift inertia phase, both the oncoming and off‐going clutches slip. Both clutch torques TCL1 and TCL2 are control variables. TCL1 is ramped down rapidly and TCL2 is ramped up rapidly by the controller as shown in Figure 8.14. The initial condition for the equation system corresponds to the system dynamic status in fifth gear operation when the 5–4 downshift starts. The inertia phase ends when
  . For control purpose, ω1 is set to be equal to 1.01 ω2, allowing a small amount of engine flare.
Torque phase: During the torque phase of 5–4 down shift, the oncoming clutch CL2 is applied already, but the off‐going clutch CL1 is still slipping under pressure and transferring friction torque to the transmission input. Both final drives are involved in the power flow. The equations of motion are presented as follows for this operation status:


where, ia1 is the final drive ratio for the first, second, fifth, and sixth gears, ia2 is the final drive ratio for the third, and fourth gears,  has been replaced by
  in Eq. (8.24) above. There are four state variables –
  ,
,  ,
,  , and the oncoming clutch torque TCL2. It is noted that the off‐going clutch torque TCL1 is a control variable and the oncoming clutch torque TCL2 is now a state variable. The initial condition for the system above corresponds to the system status at the end of the inertia phase. For power‐on 5–4 downshift, off‐going clutch torque TCL1 must be brought to zero as soon as clutch CL1 starts to slip. The 5–4 down shift is completed when ω1 is equal to ω2 and the off‐going clutch torque TCL1 becomes equal to zero.
In summary, the system of equations for all other fixed ratio operations and shifts can be derived similarly according to the respective gear mesh paths. For the launching operation, TCL1 is the control variable. For power‐on upshifts from odd gears, oncoming clutch torque TCL2 is a control variable in both the torque phase and the inertia phase, and off‐going clutch torque TCL1 is a state variable determined by system dynamics in the torque phase and a control variable in the inertia phase. For power‐on upshifts from even gears, the roles of clutch CL1 and clutch CL2 are just reversed, and so are the two clutch torques. For power‐on downshifts from even gears, the off‐going clutch torque TCL2 is a control variable in both the inertia phase and the torque phase, and oncoming clutch torque TCL1 is a control variable in the inertia phase and a state variable in the torque phase. The roles of the two clutches can be defined similarly for power‐on downshifts from odd gears.
Note that the state variable equation systems for the various DCT operations statuses represented above are derived for the dynamic model structure shown in Figure 8.8. For DCTs that are equipped with dual mass flywheels, the system dynamics can be modeled in a structure shown in Figure 8.10, which is a minor modification of the model shown in Figure 8.8. The system equations for dual mass DCTs can be derived for all operation modes following similar steps.
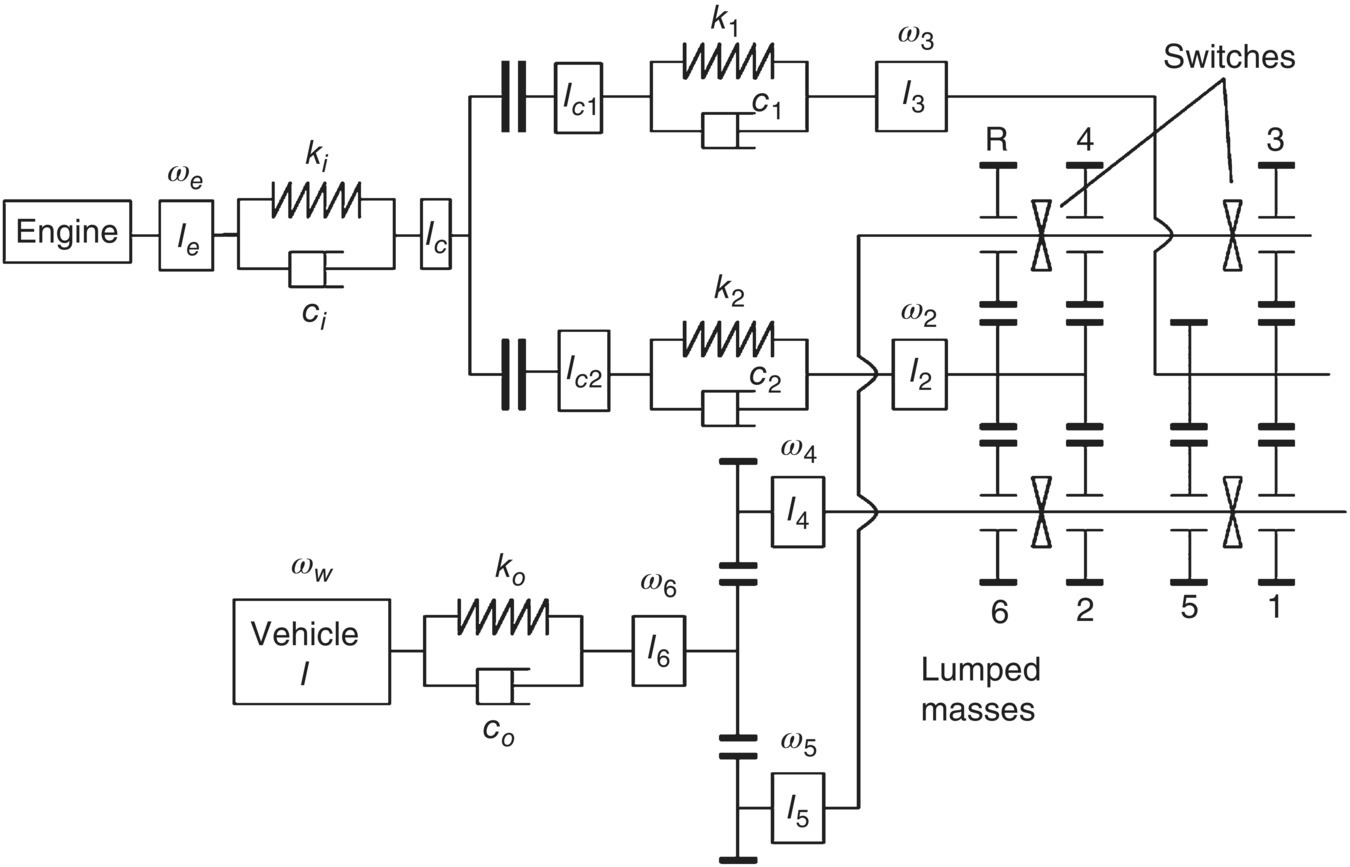
Figure 8.10 Dynamic model structure for DCTs with dual mass flywheels.
The dynamic model presented in this section was applied for a test vehicle with data shown in the following table. The comparison between model simulation and testing is presented in the next section for this test vehicle.
| Example vehicle data | |
| Vehicle mass (m) | 1400 kg |
| Transmission gear ratios (i) | i1 = 3.917 i2 = 2.429 i3 = 1.436 i4 = 1.021 i5 = 0.848 i6 = 0.667 ir = 3.292 |
| Final drive gear ratio (ia) | ia1 = 3.762 ia2 = 4.158 |
| Tire radius (r) | 0.2975 m |
| Air drag coefficient (Cd) | 0.328 |
| Frontal area (A) | 2.12 m2 |
8.4 DCT Clutch Control
Similar to conventional ATs, DCT control concerns with shift schedule control and shift process control. The DCT shift schedule balances vehicle performance, fuel economy, and drivability. The establishment of a DCT shift schedule is similar to that for conventional ATs discussed in Chapter 6. Shift decisions are made by the transmission control unit (TCU) primarily based on signals from the speed sensor and throttle sensor. Other sensors, such as ATF temperature sensor and brake pedal sensor, provide supplemental information for the TCU to make adjustments in shift decision making. The shift schedule for the example DCT is shown in Figure 8.11.
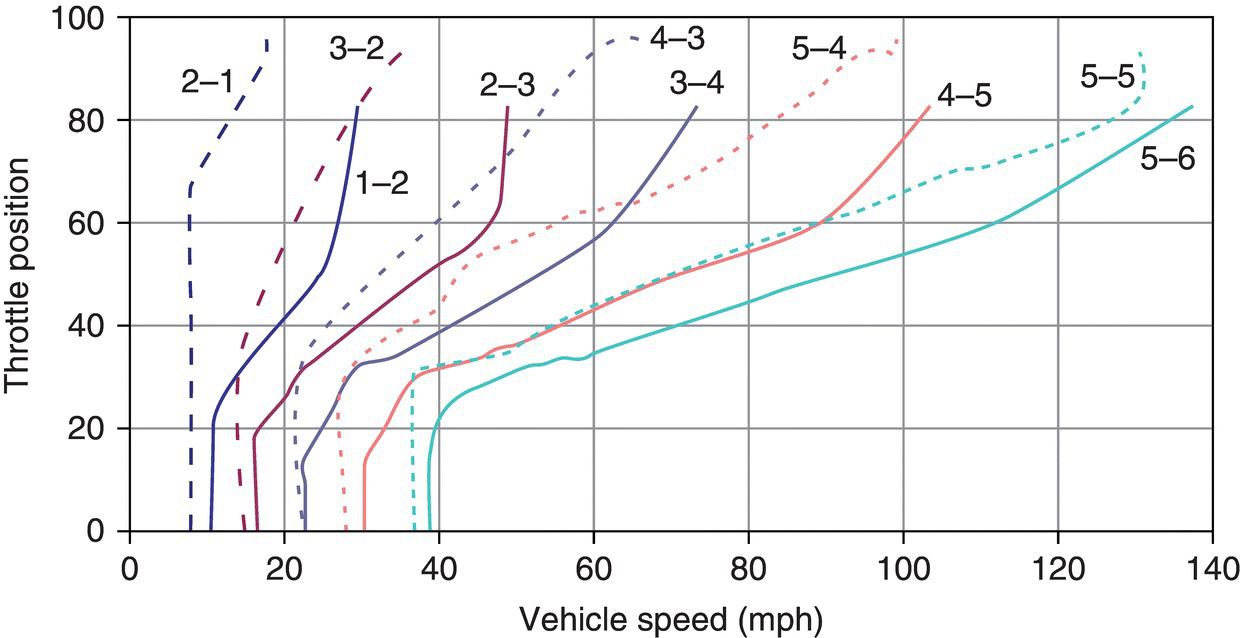
Figure 8.11 Typical DCT shift schedule.
Unlike vehicles equipped with conventional automatic transmissions, which use a one‐way clutch to avoid backward torque transfer and a torque converter to dampen dynamic impacts, dual clutch transmission vehicles rely only on clutch torque control for responsiveness and smoothness during launch and shifts. It is critical to control the clutch torque magnitude and the timing of actuation for both the oncoming and off‐going clutches. In addition, engine torque control during shifts must be implemented to interact with clutch torque control. The main objective of clutch control is to realize power‐on shifts without torque interruption and engine flare so as to achieve optimized drivability and comfort similar to that of conventional ATs.
Launch; Launch control aims at acceleration responsiveness and smoothness. Excessive torque in clutch CL1 at the beginning of launch causes vehicle jerk, resulting in substandard passenger feel. On the other side, inadequate clutch torque is not enough to launch the vehicle quickly and the vehicle will be perceived as lacking in power. The launch clutch torque profile in normal road traffic mainly depends on the acceleration pedal depression which is controlled by the electronic throttle control (ETC). In such operations, the engine torque increases with respect to its RPM and is known by interpolating the engine map. The clutch torque TCL1 is quickly increased by the control motor to catch up the engine torque. The transmission input shaft RPM traces the engine RPM while the vehicle is being launched. The launching process is considered to be completed when the transmission input speed is just a few RPMs below that of the engine. The vehicle then operates in first gear afterward. Under stop and go traffic conditions, DCT clutch control can be technically challenging because the DCT vehicle must possess the “creeping” capability as a requirement for ATs. Excessive clutch slippage in traffic jams leads to overheating in the dual clutch module. This issue can be addressed by using heat resistant materials for clutch design, and in real time traffic, the DCT controller may temporally cancel “creeping” and activate the ABS system to hold the vehicle in position in uphill road conditions.
Example torque and RPM profiles of launch clutch CL1 are illustrated in Figure 8.12. Experimental data and simulation results by the dynamic modeling described in the previous section are compared in Figure 8.12. In general, a high level of agreement between simulation and test is observed for engine and transmission input speeds. Some discrepancy on the engine RPM is observed at the beginning of the launch due to the engine RPM sensitivity and modeling accuracy. Note that the measured output torque is obtained by a torque sensor installed on the half shaft.
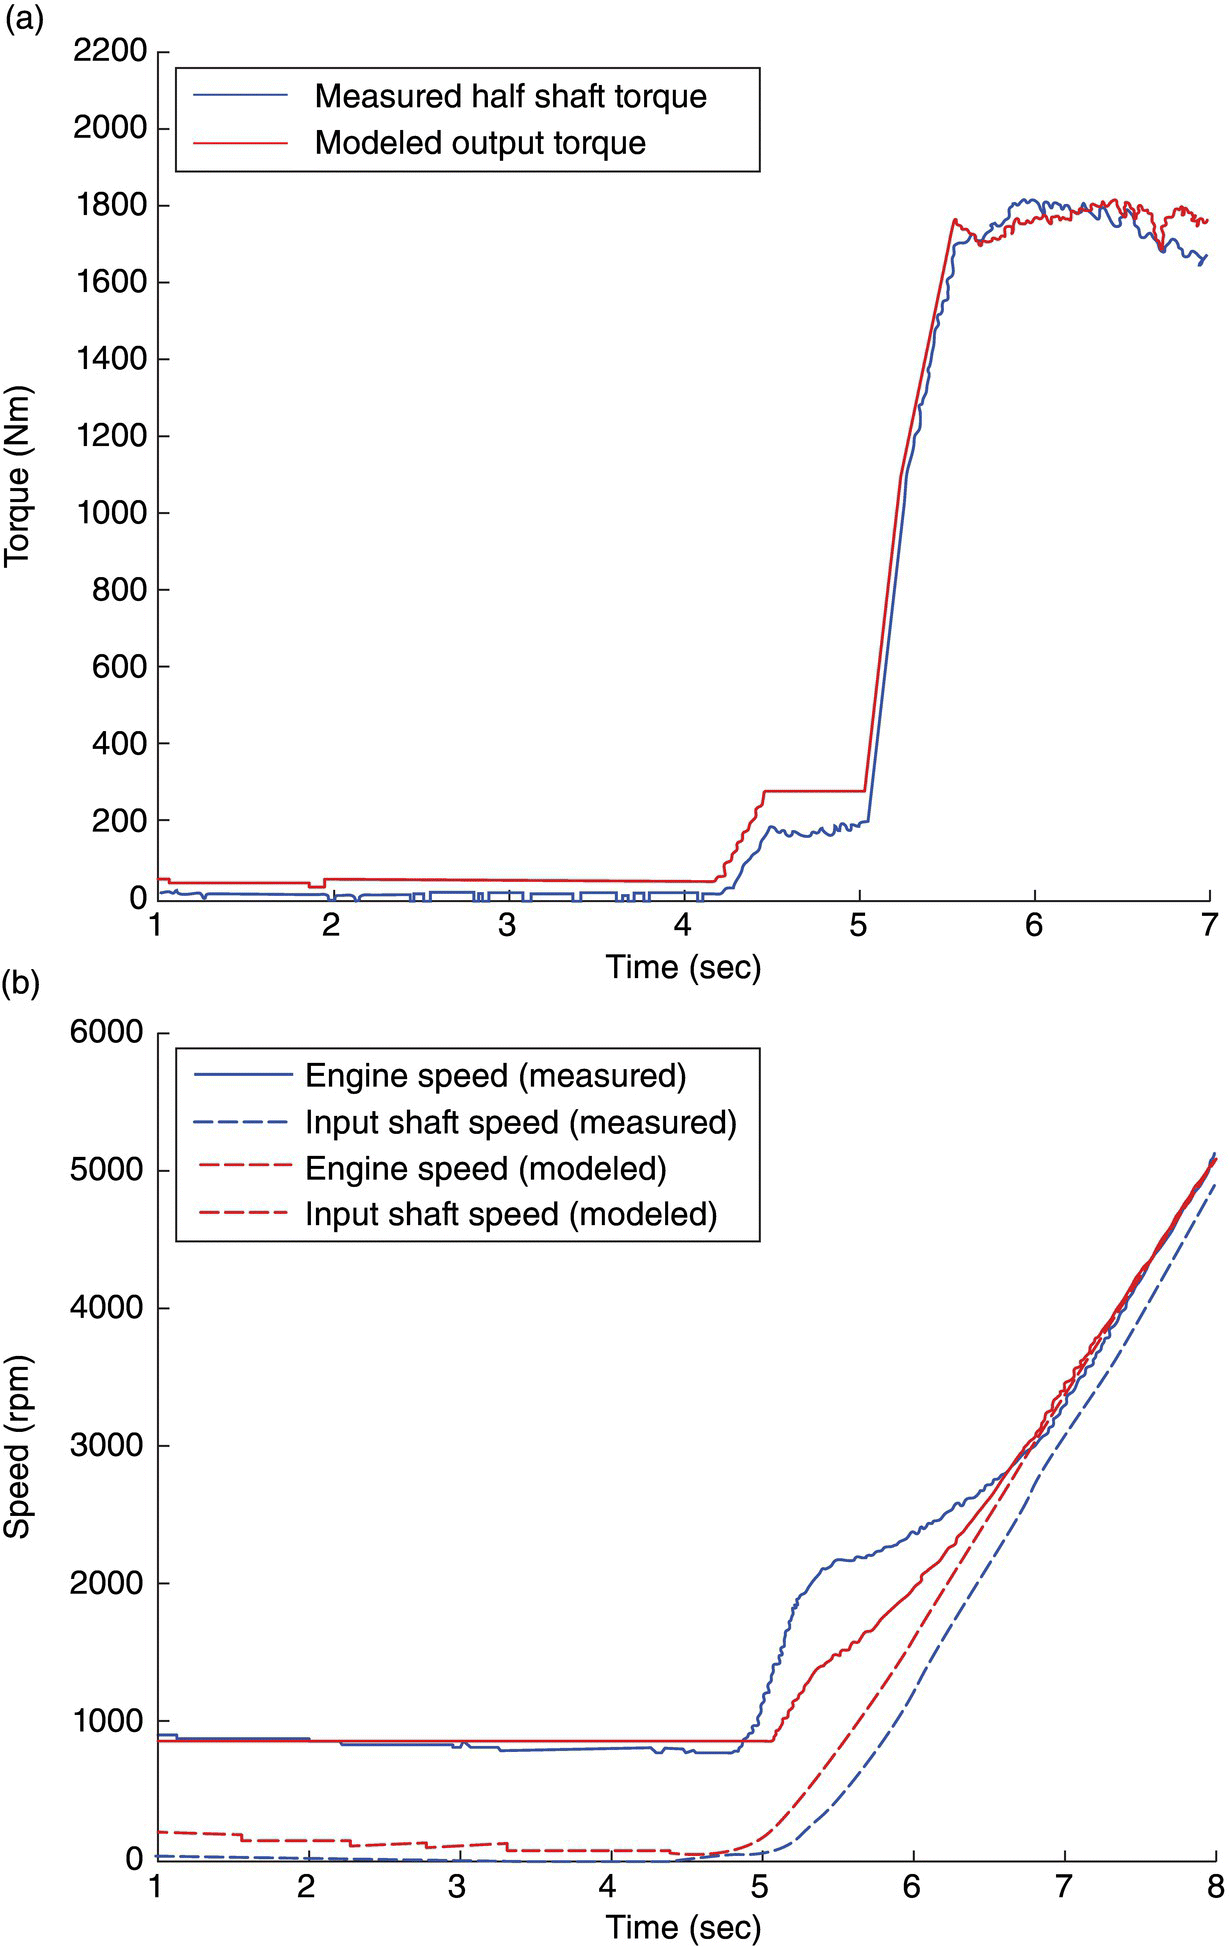
Figure 8.12 Comparison on DCT launching variables.
Upshifts: Clutch tie‐up and engine flare are the two key issues for DCT upshift control similar to clutch to clutch shift in conventional ATs. For example, if clutch CL1 is released too late in a 1–2 upshift, then the two clutches will be tied up, yielding backward power recirculation. On the other hand, if the clutch CL1 is released too early, the engine speed will flare up in the absence of vehicle load. In order to make sure that the engine torque is transferred to the driving wheels smoothly and continuously, the torque of dual clutches must be controlled with high accuracy in magnitude and timing.
Different control strategies are used for clutch torque control during torque phase and inertia phase. Without loss of generality, a 1–2 upshift is used as an example. During the torque phase, the pressure in clutch CL1 is gradually reduced to decrease the torque capacity ( ) until clutch CL1 starts to slip as shown in Figure 8.13. The threshold of slippage is reached when the off‐going clutch torque capacity
  is equal to the engine torque. Meanwhile the oncoming clutch CL2 is gradually applied as soon as the upshift decision is made by the DCT controller. This will not cause any backward torque transfer since the input side of clutch CL2 turns faster than its output side. This feed‐forward control is based on calibration data and is adopted until the end of the torque phase when clutch CL1 starts to slip. As the shift enters the inertia phase, the torque in the off‐going clutch CL1 is quickly reduced to zero as shown in Figure 8.13. Meanwhile, the gear ratio starts to change and the torque in the oncoming clutch CL2 is ramped up with feedback on the difference between a pre‐designed gear ratio change function and the actual speed ratio, as formulated in the following:

where idesigned is a time function that bridges the difference between i1 and i2, iactual is calculated as  , and Ki and Kd, are the PID gains. TCL2 is the torque in clutch CL2 limited by the torque capacity
  . Note that the clutch torque control will be initially implemented by the PID controller, and the real time clutch torque profiles will be finalized through the calibration of test vehicles.
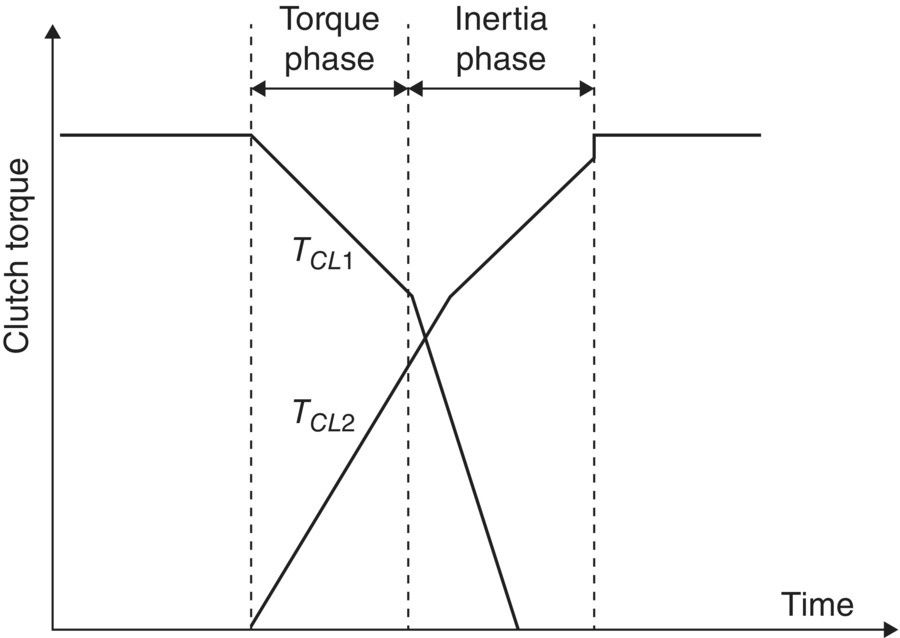
Figure 8.13 Typical clutch torque profiles during upshift.
Downshifts: Downshift to give acceleration at high vehicle speed is to increase transmission output torque. Quick response is the top priority in this case since the driver anticipates the shift occurring. Unlike upshifts, a downshift occurs rapidly with the inertia phase coming first and torque phase after. For example, to realize a 5–4 down shift, the torque in clutch CL1 must be reduced quickly to the point of clutch slip before clutch CL2 is applied. The engine speed flares above the speed of the oncoming clutch output side as soon as clutch CL1 starts to slip. The inertia phase starts as soon as clutch CL1 slips and the transmission ratio begins to change from the lower value of the high gear toward the higher value of the target low gear. Both clutches slip during the inertia phase until the low gear ratio is achieved. The shift then enters the torque phase when there may still be some residual torque in the off‐going clutch CL1. The downshift is completed when the residual torque in CL1 is brought to zero quickly in the torque phase. The oncoming clutch torque TCL2 is then further increased to securely engage the target gear. The torque profiles in the 5–4 power‐on downshift example are shown in Figure 8.14, which are typical for other power‐on downshifts. Note here that it is technically possible that the off‐going clutch torque can be brought down to zero in the inertia phase of a downshift before the target low gear ratio is achieved. If this happens, there will no torque phase as in typical shifts.
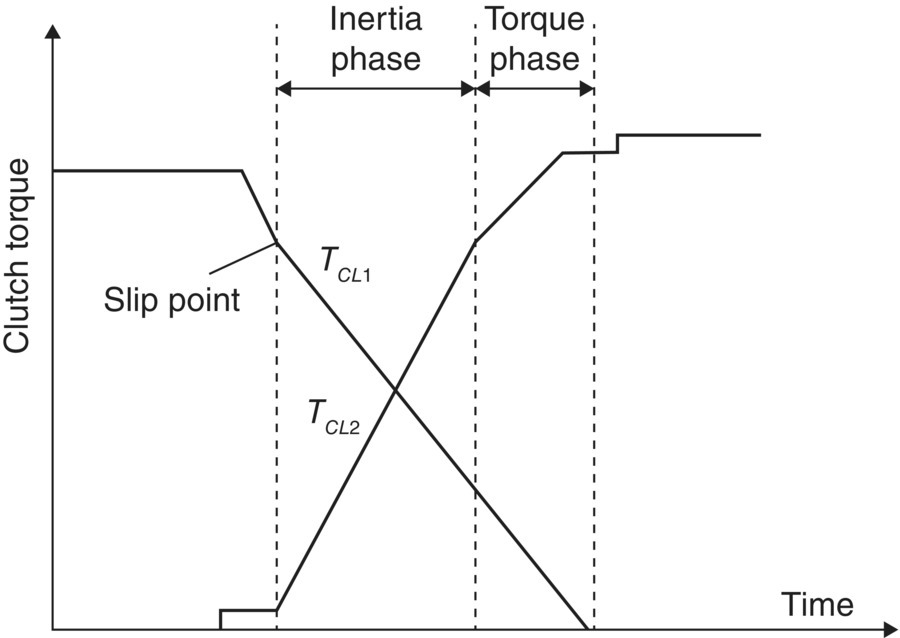
Figure 8.14 Typical clutch torque profiles during downshifts.
Engine torque control during shifts: As discussed previously in Chapters 5 and 6, the reduction of transmission input torque, which is the same as the engine torque for DCT vehicles because there is no torque converter, lowers the oncoming clutch torque required to complete the shift and also lowers the transmission output torque overshoot that may occur in the inertia phase. The effects of engine torque reduction for DCT upshifts and downshifts are analysed in the following.
During DCT upshifts, the engine speed is higher than that of the input shaft for the target gear, as illustrated for the 1–2 upshift in Figure 8.15. Engine torque reduction must not occur until the end of the torque phase, otherwise a deep torque hole would result, creating power interruption as felt by the driver. As the shift enters the inertia phase when clutch CL1 starts to slip, the engine speed must be reduced quickly to be equal to the speed of the second gear input shaft, i.e. the output side of clutch CL2. This is only possible if the engine torque is smaller than TCL2 during most of the inertia phase, as shown in Figure 8.15. Because the time delay in engine torque reduction by spark retarding, the engine torque will still be above the oncoming clutch torque TCL2 soon after the turning point from the torque phase to the inertia phase. Engine deceleration occurs as soon as the oncoming clutch torque TCL2 is higher than the engine torque and continues toward the end of the upshift. The timing and duration of engine torque reduction by spark retarding can be precisely calibrated for various shifts to optimize shift response and smoothness. The optimized result is obtained if the recovered engine torque is just equal to the oncoming clutch torque TCL2 at the time when the engine speed is equal to the speed of the second gear input shaft. The oncoming clutch torque TCL2 is then further increased by a step to secure the clutch engagement. To achieve the seamless coupling of the engine and the second gear input shaft by the oncoming clutch CL2, it is crucial to establish an accurate correlation between the oncoming clutch torque TCL2 and the clutch control variable, as detailed in the next section.
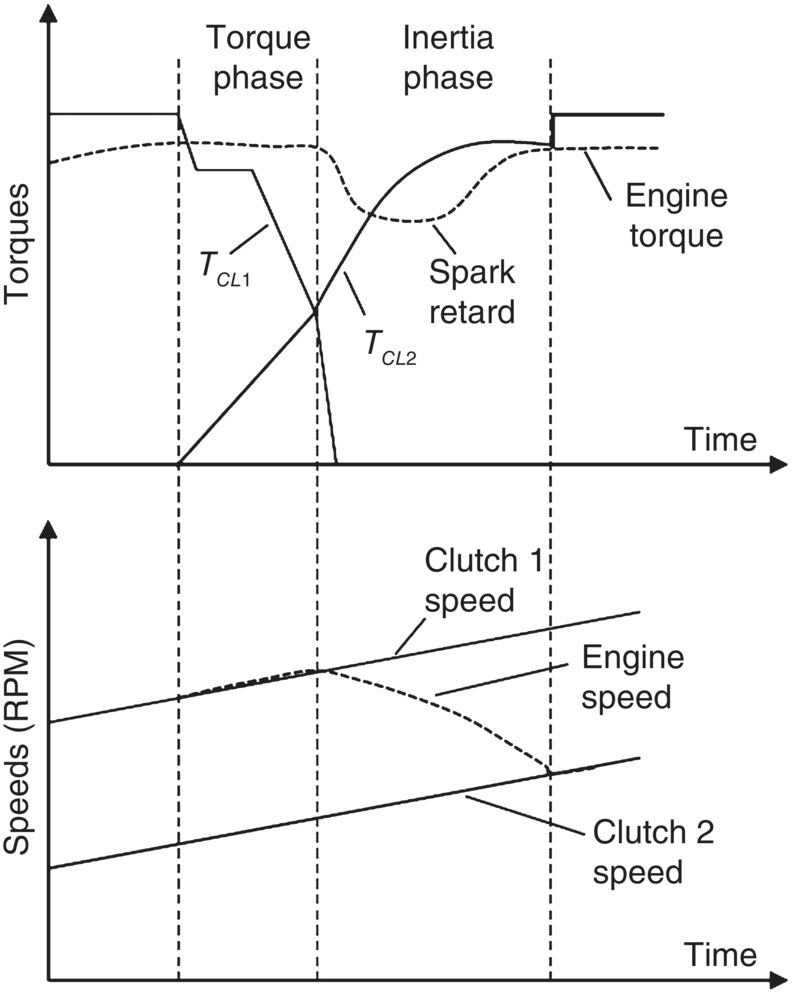
Figure 8.15 Engine torque reduction by spark retarding for DCT upshifts.
The torque profiles, the engine speed, and the speeds of the two input shafts are illustrated in Figure 8.16, for a 1–2 shift of the example DCT vehicle in Section 8.3. The plot at the top shows the profiles of the off‐going clutch torque TCL1 and the oncoming clutch torque TCL2. These profiles follow the pattern shown in Figure 8.13 and are implemented in the test vehicle. The simulation results are obtained by the model formulations presented previously in Section 8.3. It can be observed that decent agreements on the engine speed and the speed of the two input shafts are obtained between model simulation and measurements on the test vehicle. Discrepancy exists because of inaccuracy in clutch torque calculations and in the mass moments of inertia of DCT components.
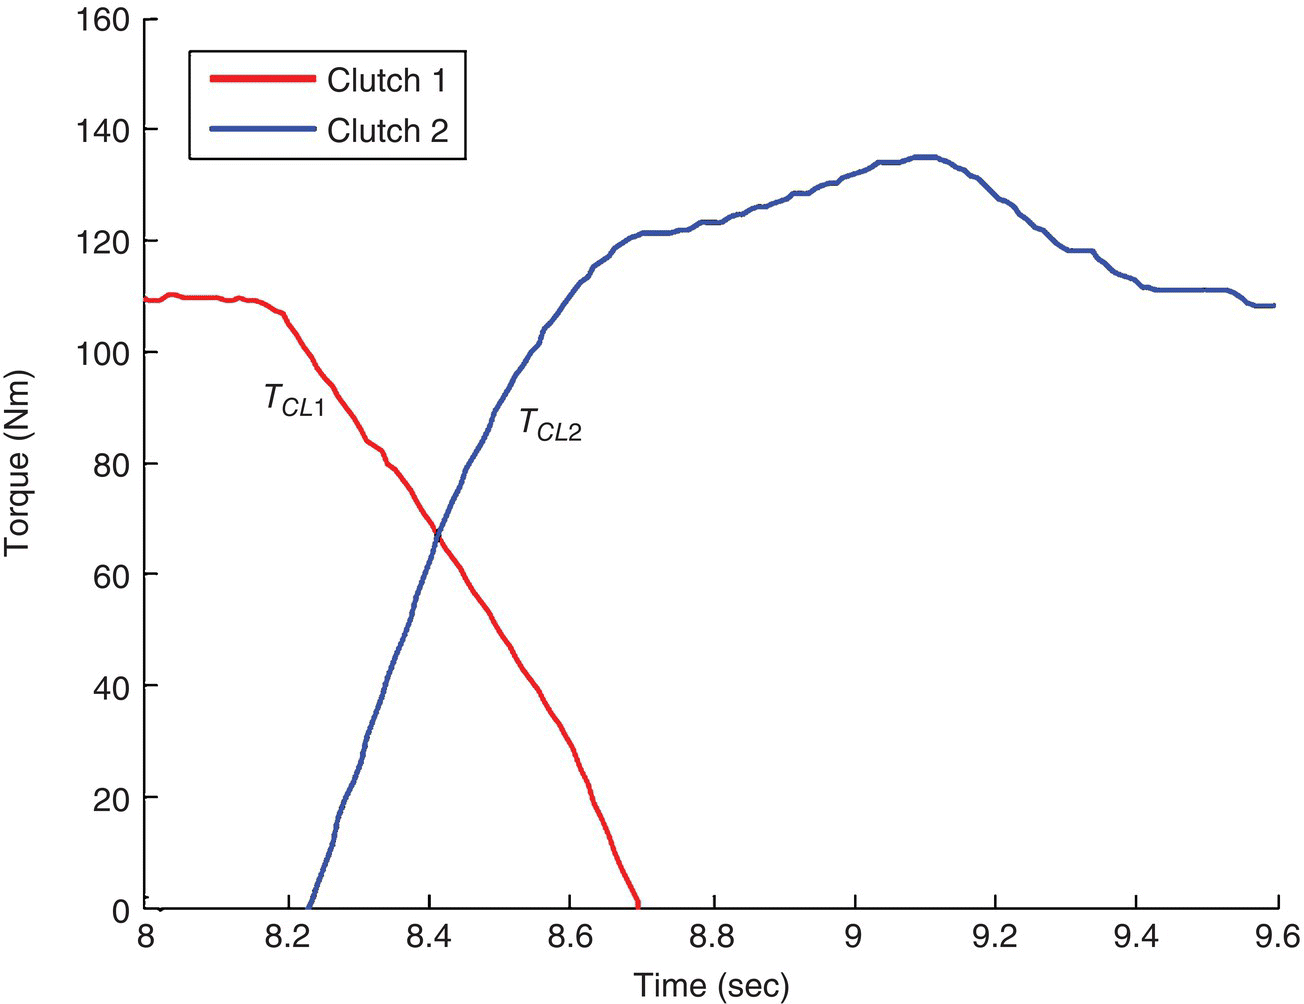
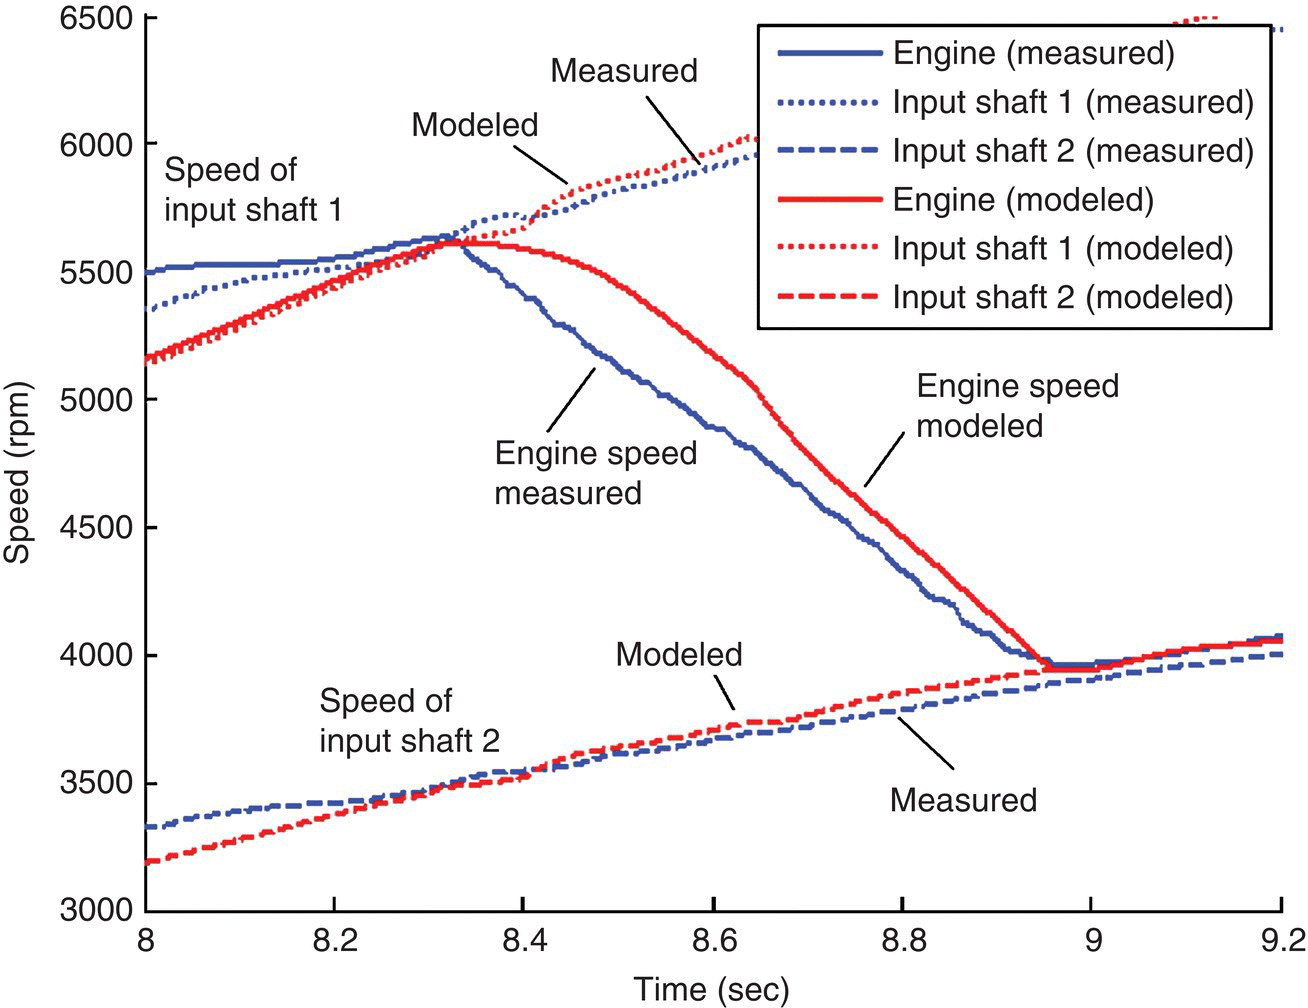
Figure 8.16 Simulation and test results torque and speed variables in 1–2 upshift.
During DCT downshifts, the engine speed is lower than that of the input shaft for the target gear, as illustrated for the 5–4 downshift in Figure 8.17. When the DCT TCU commands the 5–4 downshift, the torque capacity of the off‐going clutch is decreased quickly to the point of slippage, at which the engine torque is equal to the off‐going clutch torque TCL1. The oncoming clutch torque TCL2 is immediately ramped up as soon as the off‐going clutch CL1 starts slipping, as shown in Figure 8.17. During the inertia phase, the engine torque is higher than the sum of the off‐going clutch torque and the oncoming clutch torque, and the engine speed is therefore quickly accelerated to catch up the speed of the input shaft of the target gear. At the end of the inertia phase, the engine speed increases to be above the speed of the target gear input shaft, while there may still be some residual torque in the off‐going clutch CL1. The 5–4 downshift shift now enters the torque phase, with the engine speed slightly higher than the speed of the output side of clutch CL2. The engine torque is then reduced in the torque phase by spark retarding so that the oncoming clutch torque TCL2 becomes higher than the engine torque. The engine speed is then decelerated to be equal to the speed of the fifth gear input gear. Through accurate calibration, it is possible to reach the point in the torque phase at which the engine speed is equal to the target gear input shaft speed, and the engine torque is equal to the oncoming clutch torque. For secure clutch engagement, the oncoming clutch is further increased by a step after the 5–4 downshift is completed. Note that the torque phase in power‐on downshifts may not be clearly defined because the off‐going clutch torque may be ramped down to zero even before the target gear ratio is achieved. If this happens, the downshift is completed very quickly and there could be some shift harshness because the engine and the input shaft of the target gear cannot be coupled seamlessly. However, power‐on downshifts are usually triggered by the drivers for high power and is anticipated by the driver. Acceleration is the priority here and some amount of shift harshness should not cause too much an unpleasant discomfort.
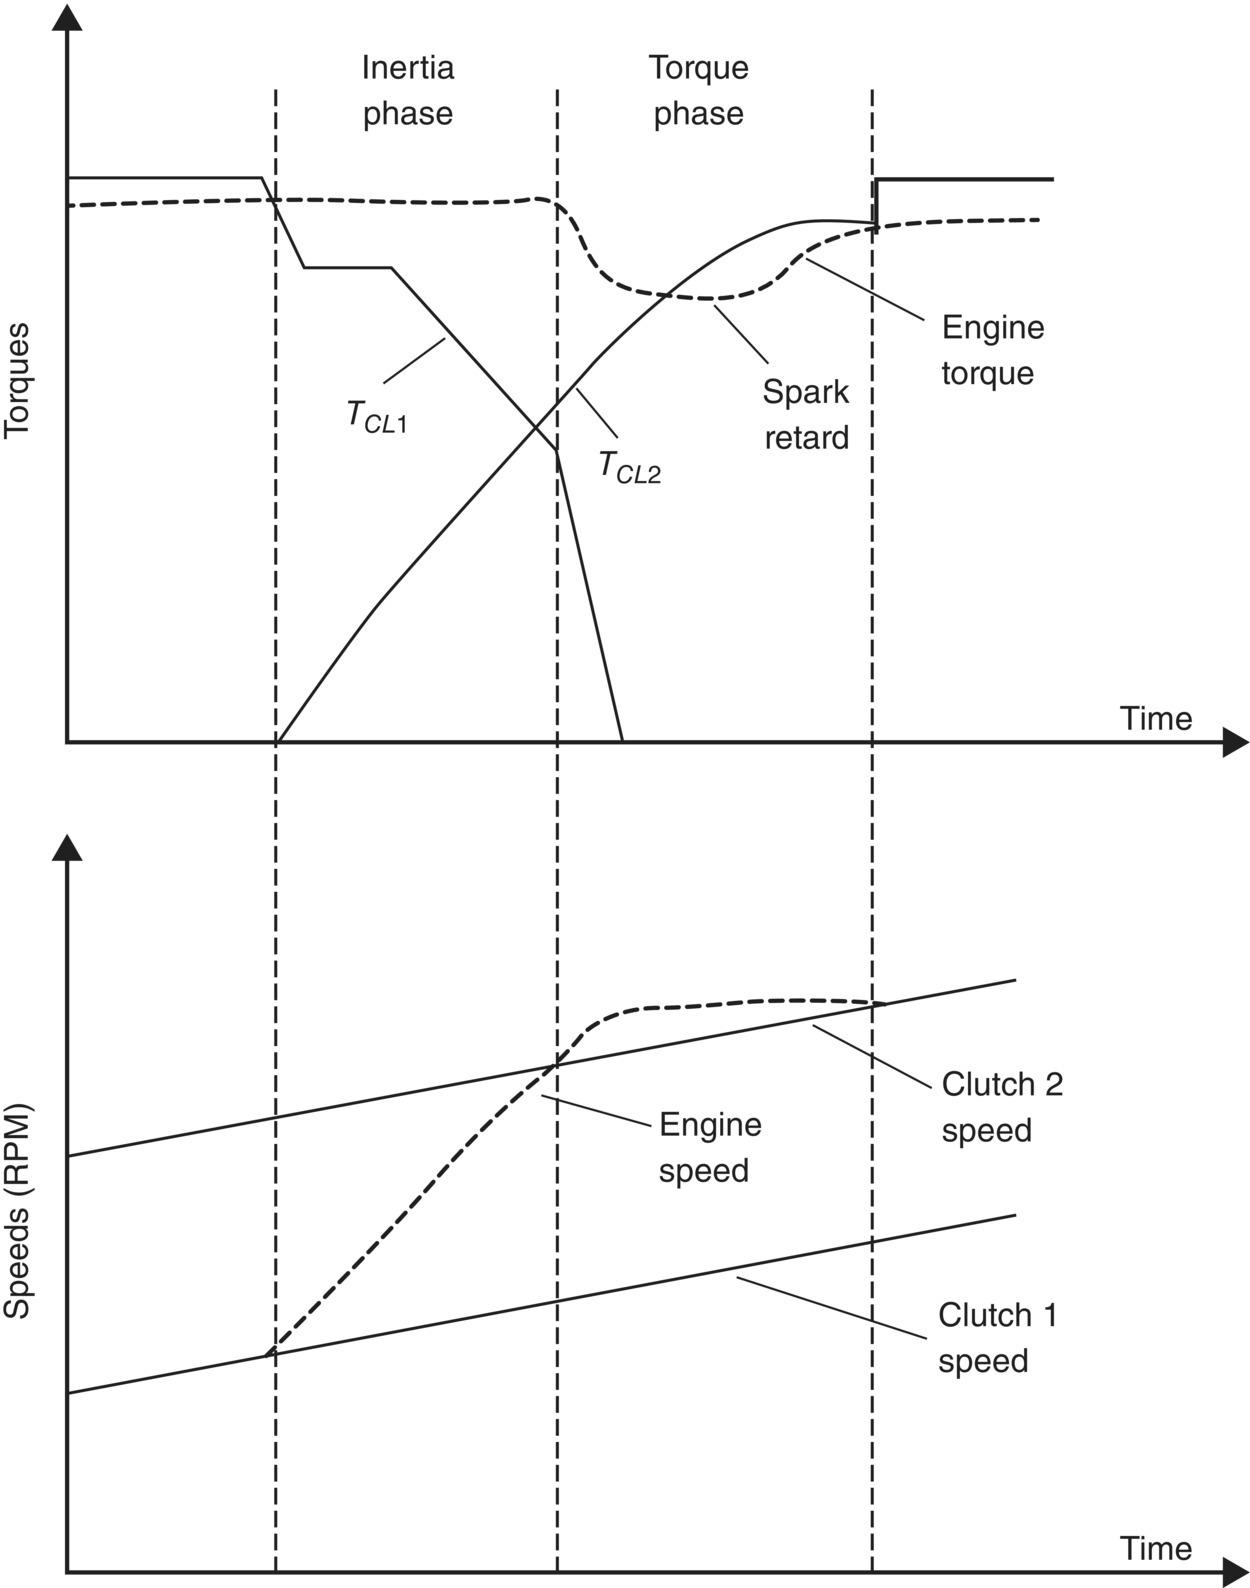
Figure 8.17 Engine torque reduction by spark retard for DCT downshifts.
The torque profiles, the engine speed, and the speeds of the two input shafts are illustrated in Figure 8.18, for a 5–4 power‐on downshift for the example DCT vehicle. The plot at the top shows the profiles of the off‐going clutch torque TCL1 and the oncoming clutch torque TCL2, as well as the engine torque with spark retarding during the torque phase. It can be observed from Figure 8.18 that the engine speed is increased to be above the speed of the target gear input shaft (input shaft 2) during the inertia phase. This is because the off‐going clutch CL1 is slipping with TCL1 being sharply reduced and the oncoming clutch CL2 has just being pressurized. Toward the end of the 5–4 downshift, the oncoming clutch torque TCL2 is ramped up to be higher than the reduced engine torque, decelerating the engine speed to be equal to the speed of the target gear input shaft. The engine is then coupled with the fourth gear input shaft by the oncoming clutch CL2. For the 5–4 power‐on downshift, it can also be observed from Figure 8.18 that good agreements on the engine speed and the speed of the two input shafts are obtained between model simulation and measurements on the test vehicle.
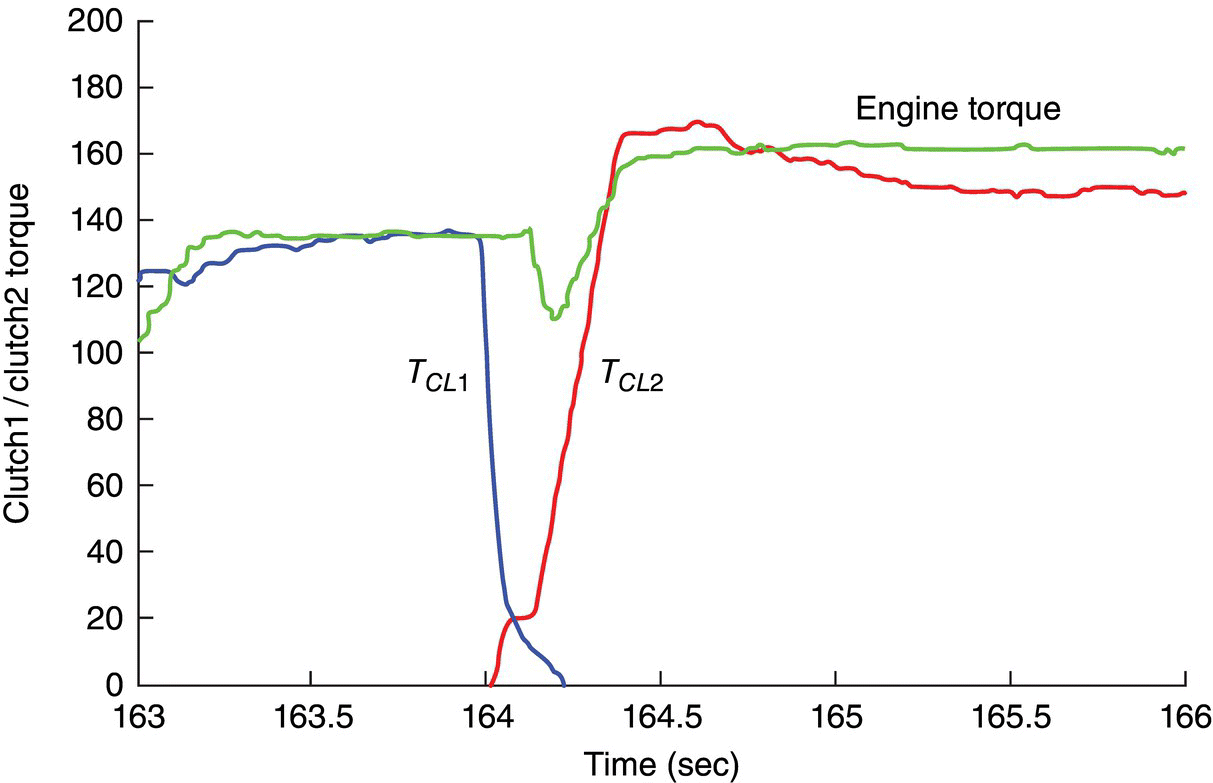
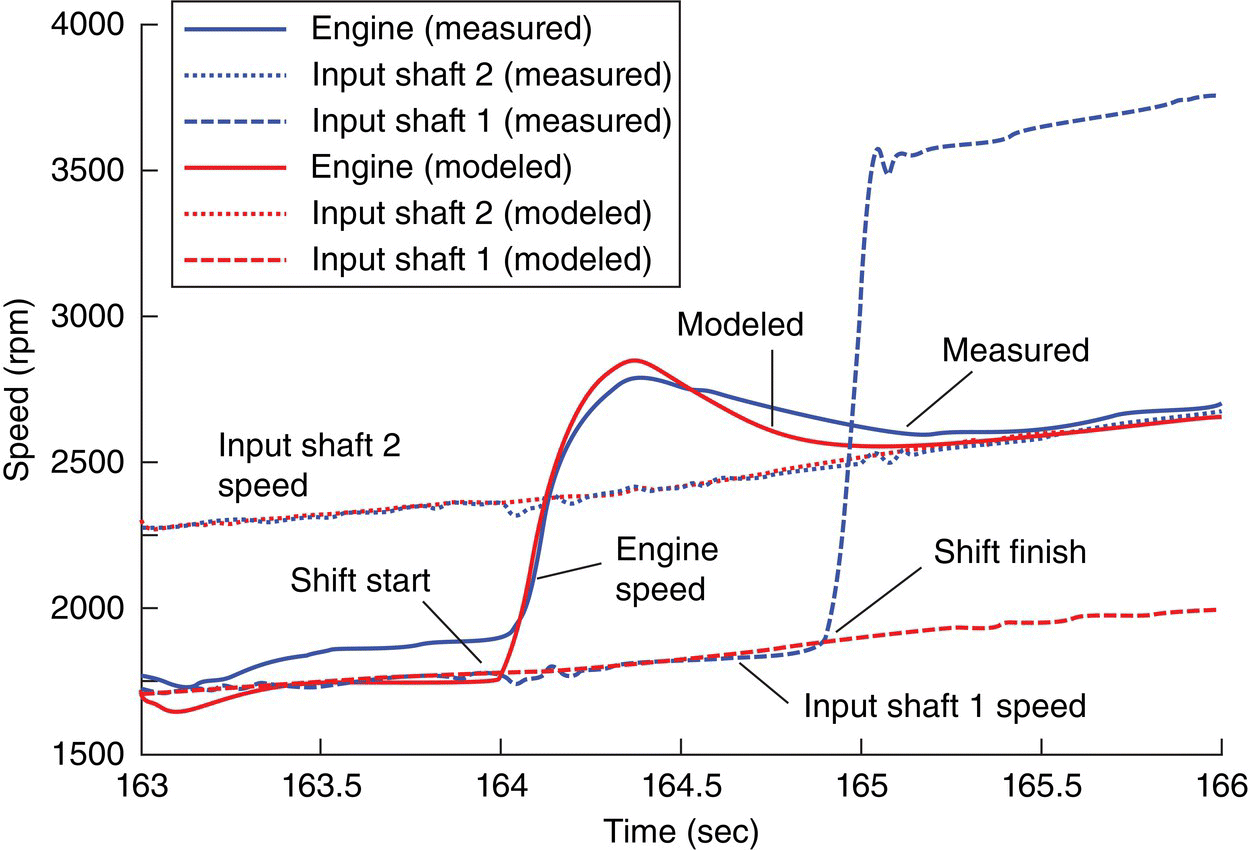
Figure 8.18 Simulation and test results for torque and speed variables in 5–4 downshift.
8.5 Clutch Torque Formulation
As mentioned previously, a DCT differs from a conventional AT in that the latter has a torque converter between the engine output and transmission input, despite the similarity in clutch‐to‐clutch shift characteristics. The presence of the torque converter cushions the powertrain dynamic transients and is therefore conducive to smoothness during vehicle launch and shifts. Without the cushion effect of the torque converter, clutch torque control requires higher precision to achieve launch and shift quality comparable to ATs. This requires the accurate correlation between the real time clutch torque and the clutch control variable. The contents of this section concentrate on the clutch torque formulation and calibration for dry dual clutch transmissions, using the Ford six‐speed DCT shown in Figure 8.1 as the case study example. Firstly, the theoretical or nominal torque capacity of each of the dual clutches with given design parameters is correlated to the clutch control variable, which is the angle of rotation of the control motor as shown in Figures 8.2 and 8.3. The nominal clutch torque is formulated in terms of the clutch design parameters based on the assumption that the friction power is constant over the friction disk face, as detailed in Chapter 2. Secondly, an algorithm based on powertrain dynamics is established for the calculation of clutch torque in the launching clutch during vehicle launch and in both clutches during shifts. This algorithm uses wheel speed sensor data as the input and is capable of accurately calculating the clutch torque while both clutches are slipping on a real time basis. Thirdly, experimental data will be presented to validate the clutch torque formulation mentioned above.
8.5.1 Correlation on Clutch Torque and Control Variable
In Section 2.4, the torque capacity of disk type clutches was formulated by Eq. (2.8) based on the assumption of uniform disk face wear in terms of the clutch design parameters, disk friction coefficient, and clutch clamping force. The assumption of uniform wear is equivalent to even distribution of friction power over the friction disk face. Typically, each of the dual clutches in dry dual clutch transmissions has a single friction disk and the nominal clutch torque capacity is expressed by the following equation:
where D and d are the friction disk outer and inner diameters, which measure the radial dimension of the dual clutch module, f is the friction coefficient between the friction disk and the pressure plate, and F is the clamping force on the friction disk. Eq. (8.27) applies to both clutch CL1 and CL2, and for a given dual clutch module design, the clutch torque depends on the clamping force F and the friction coefficient f, which varies with clutch temperature and clutch slip rate.
The clamping force F on the friction disk is related to the force applied on the release bearing through the diaphragm spring, which functions as the pressure plate lever, as shown in Figure 8.3. However, due to the deflection of the diaphragm spring and the existence of backlash in the clutch actuation mechanism, there are nonlinear characteristics between the clutch torque and the actuator control parameter. To account for this nonlinearity, tests need to be performed to measure the force applied to the release bearing (i.e. the engagement load) versus the release bearing travel. Based on test data, the engagement load is correlated to the release bearing travel, also termed engagement travel, as shown in Figure 8.19 for the six‐speed DCT shown in Figure 8.1. Each of the two curves in Figure 8.19 corresponds to the respective release bearing. It is observed from Figure 8.19 that the two curves correlating engagement load and engagement travel differ from each other despite their similarity in shape. It is important to note from Figure 8.19 that there is an engagement load for each clutch even when the release bearing travel or engagement travel is zero. This is because that the diaphragm spring is fairly stiff and it takes a fairly large force to create a measureable deflection along the input shaft. In general, each of the two curves can be divided into two linear segments as can be observed from Figure 8.19, indicating typical characteristics of diaphragm spring stiffness.
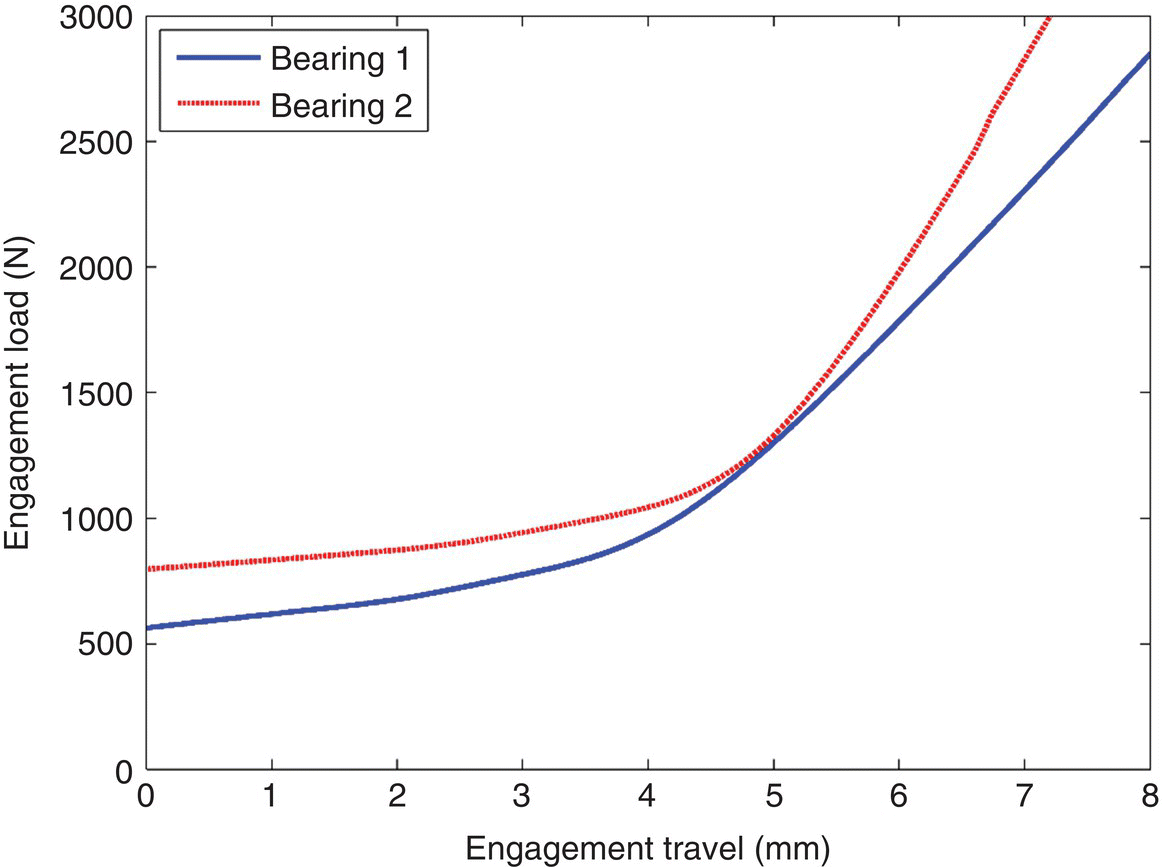
Figure 8.19 Relationship between release bearing travel and engagement load.
As shown in Figure 8.19, there are substantial forces (denoted as F0) on the release bearing of both clutches when the engagement travels are zero due to high rigidity of the diaphragm springs that also serve as for the pressure plate levers as shown in Figure 8.3. Because of this, two separate functions must be used to correlate the release bearing force Fb with the roller displacement. As shown in Figure 8.20a, the release bearing force Fb and the spring force Fs are related as follows before Fb becomes equal to F0,
where xroller is the roller travel on the screw as shown in Figures 8.3 and 8.20, L is the total effective length of actuator lever, and Fs is the spring force with an initial value of Fs0 that is caused by spring compression at assembly. The spring displacement is very small when  since the release bearing displacement is near zero and the spring force remains almost the same as the initial value, i.e.
  if
if  . At the threshold when
  , the displacement of roller xp can be solved from Eq. (8.28) as:
Therefore, when  , the release bearing force is represented in terms of roller displacement by Eq. (8.28). After the release bearing begins to travel, a separate function is required to correlate the release bearing force or the engagement load and the roller displacement since the spring compression is affected by the bearing travel. The release bearing travel and its effect on the spring compression is shown in Figure 8.20b, and the extra amount of spring compression caused by the bearing travel is determined as:

where Δxs is the increment of spring deflection and xb is the engagement travel of the release bearing. Due to this increment, the spring force with bearing travel xb is expressed as:

where k is the spring stiffness. The equilibrium of the actuator lever requires that the sum of moments about the contact point between the roller and the actuator lever is zero, leading to the following relation between the engagement load Fb and the spring force Fs:
Combining Eqs (8.28–32), the release bearing force or the engagement force Fb can be represented in terms of the roller displacement respectively for the two clutches as:
where the release bearing travel xb is related to the engagement Fb by the respective curve in Figure 8.18.
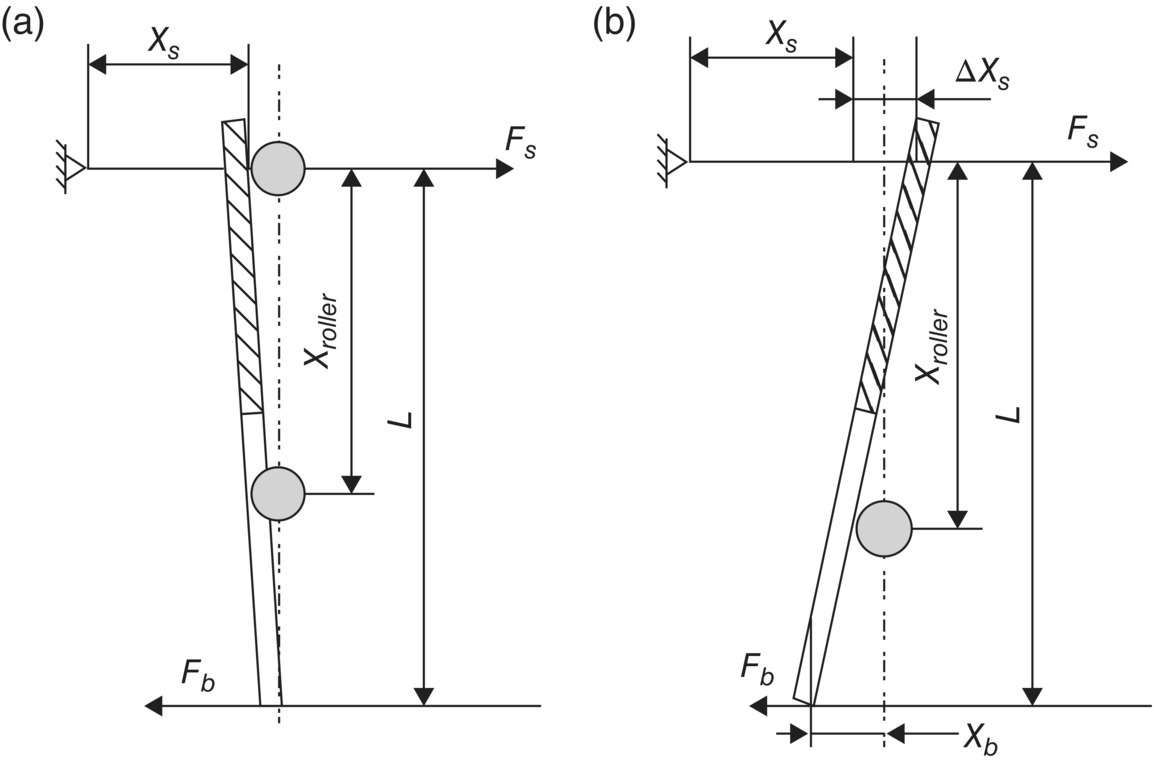
Figure 8.20 Engagement load before and after bearing travel.
8.5.2 Case Study on Clutch Torque and Control Variable Correlation
As indicated in Eq. (8.27), the clutch torque is a function of the clamping force on the pressure plate, the friction coefficient, and the clutch dimensions. The main design parameters of the two clutches used in the example DCT are:
| Main clutch parameters | ||
| Parameters | Clutch 1 | Clutch 2 |
| Clutch outer diameter | D1 = 232.5 mm | D2 = 225 mm |
| Clutch inner diameter | d1 = 157 mm | d2 = 157 mm |
| Diaphragm lever ratio | iratio1 = 3.6 | iratio2 = 4.2 |
| Friction coefficient | f1 = 0.35 | f2 = 0.35 |
According to Eq. (8.27), the nominal clutch torque in clutch 1 and clutch 2 can be calculated respectively as:
where Fb1 and Fb1 are the engagement forces for clutch 1 and clutch 2 respectively. The spring constants are selected to be 150 N/mm for both actuators and the length of the actuator lever is  mm. The roller displacements at which release bearings begin to move are xp1 = 25 mm and xp2 = 30 mm. The initial spring forces are determined by Eq. (8.29) as
  N and
N and  N.
N.
Using Eqs (8.33) and (8.34), the clutch torque and the roller displacement before the release bearing starts to travel is related respectively by the following equations,
After the bearings start to move, the relationship between engagement travel xb and the engagement load Fb can be obtained from Figure 8.19, which means that Fb is a function of xb, i.e.  . When the engagement travel is smaller than 4 mm, it is accurate enough to fit the function f(xb) by the following linear function as:

Solving xb1 from the equation above in terms of Fb1 and plugging it into the second equation in Eq. (8.33), one can further represent the engagement load Fb1 in terms of the roller displacement xroller1 and finally express the torque of clutch CL1 using Eq. (8.34) in the following form:
where,  . Similarly, the clutch torque in clutch CL2 can be expressed as a function xroller2 by the following equation, with
  .
.
Eqs (8.37) and (8.38) allow the direct calculation of clutch torque in terms of the roller displacement, which is linearly related to the rotational angle of the control motor. These two equations correlate the nominal clutch torques in terms of the control variables respectively. The clutch torques represented by Eqs (8.37) and (8.38) can also be plotted against the roller displacements for convenience, as shown in Figure 8.21.
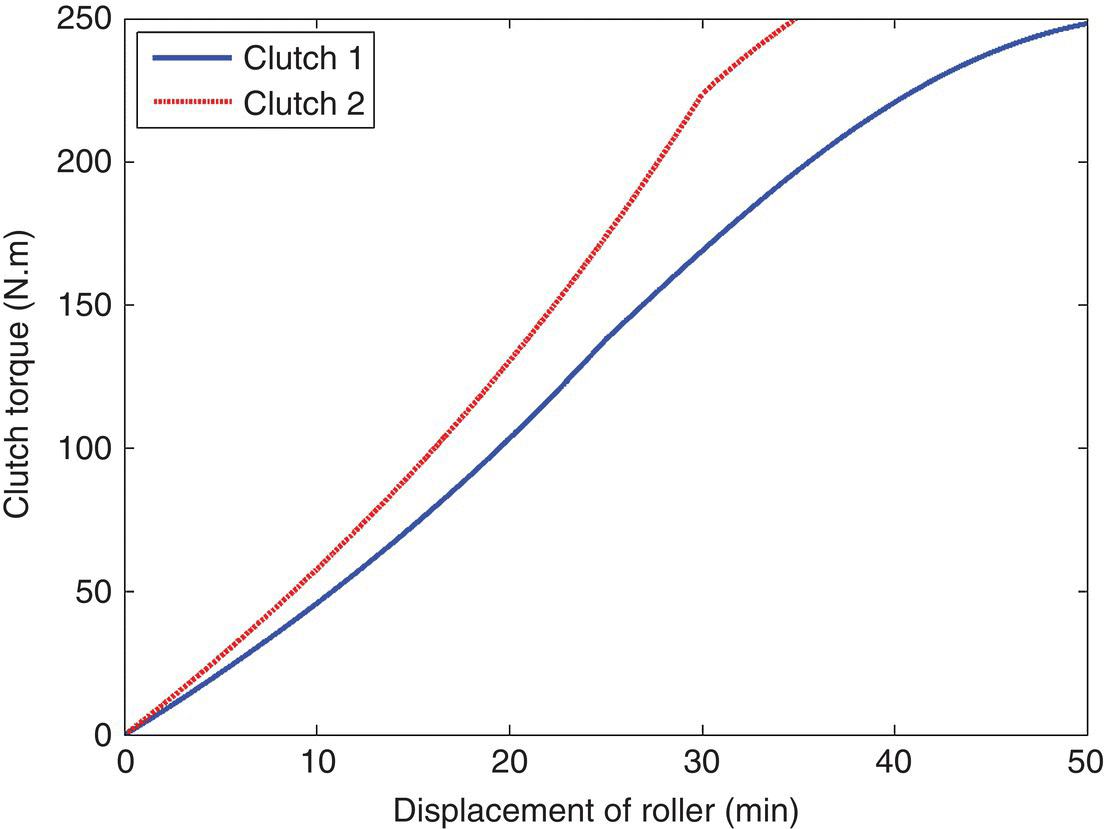
Figure 8.21 Clutch torques plotted against roller displacements.
8.5.3 Algorithm for Clutch Torque Calculation under Real Time Conditions
As detailed in the previous section, the clutch torque is a function of the clamping force on the pressure plate, and the friction coefficient for a given clutch. The nominal clutch torque is calculated by Eqs (8.37) or (8.38) in terms of roller displacements. However, this calculation must be calibrated for real world applications since the clutch friction coefficient is temperature dependent. In this section, an algorithm is presented for the accurate calculation of the clutch torque based on powertrain dynamics.
The system of equations of motion has been derived in Section 8.3 for vehicle launch and shift operations. These equations can be transformed to express the clutch torques, TCL1 and TCL2, in terms of vehicle road load and inertia. For launch operation, only clutch CL1 is transmitting engine torque to the transmission input and TCL1 can be solved by combining Eqs (8.1–8.5) in the following form:
This equation is derived by considering a solid connection between the final drive output and the vehicle inertia, i.e. the spring–damper for the output shaft in the dynamic model structure shown in Figure 8.8 is dropped. During vehicle launch, the speed sensor measures the wheel speed at specified sampling time steps and the wheel acceleration  is obtained via a numerical algorithm that differentiates the wheel speed versus time. Therefore, the clutch torque during launch can be calculated by Eq. (8.39) if the road load can be estimated accurately.
During shift operations, both clutches participate in transmitting engine torque to the transmission input. For the 1–2 shift, the system of equations of motion for the vehicle has been expressed by Eqs (8.10–13) for the torque phase and by Eqs (8.14–17) for the inertia phase. For the whole 1–2 shift, the two clutch torques can be correlated to the road load and the inertia terms as:
When one of the two clutches are open, i.e. when one of the two clutch torques is zero, the other can be determined by Eq. (8.40) as previously explained. Therefore, for vehicle launching and fixed gear operations, the clutch torque is uniquely defined by Eq. (8.39) in terms of the road load and the inertia term. However, during shift operations, both clutches slip under pressure, and both clutch torques, TCL1 and TCL1, exist and participate in transmitting the engine torque to the transmission input. An additional condition is needed besides Eq. (8.40) in order to solve TCL1 and TCL1 during shift operations.
As formulated by Eqs (8.28–38), the clutch torque is a function of clutch design parameters, the friction coefficient and the control variable. The proportion between the two clutch torques should be independent of the friction coefficient since the temperature effect is the same for both clutches. Therefore, torques in clutch CL1 and clutch CL2 are proportionate in the following ratio:
where K1 and K2 are the factors for the respective clutch that depend on clutch dimension, actuator parameters, and the roller position as detailed previously. For the example DCT in the chapter, K1 and K2 are defined in Eqs (8.35–8.38). For a given clutch module design, the clutch torque ratio K only depends on the two control variables: xroller1 and xroller2. Note again that this ratio is not affected by the clutch temperature since it affects the clutch disk friction coefficients equally. Combining Eqs (8.40) and (8.41) leads to the determination of the two clutch torques TCL1 and TCL1 in terms of  and TLoad as:

8.5.4 Case Study for the Clutch Torque Algorithm
The algorithm derived above has been applied for the test vehicle whose data are provided at the end of Section 8.3. Vehicle acceleration, wheel speed, and roller positions of the two clutch controller are measured by the respective sensors and recorded during test runs on a proving ground. The test vehicle is driven on flat track with rolling resistance coefficient well established. A torque sensor is mounted on the half shaft to measure the drive train output torque. The measured half shaft torque is converted by the related gear ratios to be the equivalent torque on the input shaft. This equivalent torque is compared with the clutch torque calculated by the algorithm.
In the launch operation, the DCT runs in first gear and the clutch torque TCL1. is calculated directly by Eq. (8.39). The vehicle acceleration or wheel speed from the test is the only model input. The comparison of clutch torque is shown in Figure 8.22. The clutch torque calculated from the torque algorithm closely agrees with the clutch torque obtained from measurement.
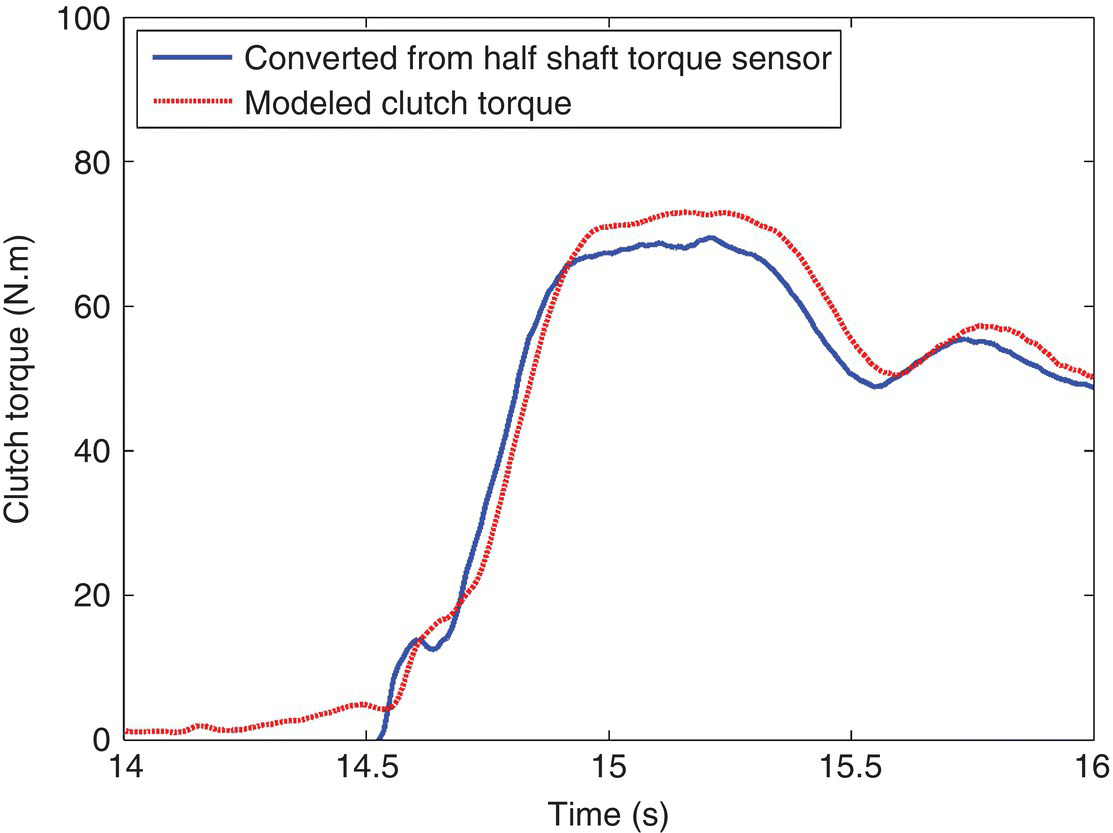
Figure 8.22 Clutch torque comparison during launch.
During a shift, the measured half shaft torque cannot be converted to be the equivalent torque values on the respective input shaft since the proportion of the measured clutch torques is not known. Therefore, the resultant half shaft torque, that is the sum of the two clutch torques multiplied by the respective gear ratios, is compared with the measured half shaft torque. As shown in Figure 8.23, the output torque during 1–2 upshift is in close agreement with the test data, indicating the effectiveness and accuracy of the torque calculation algorithm.
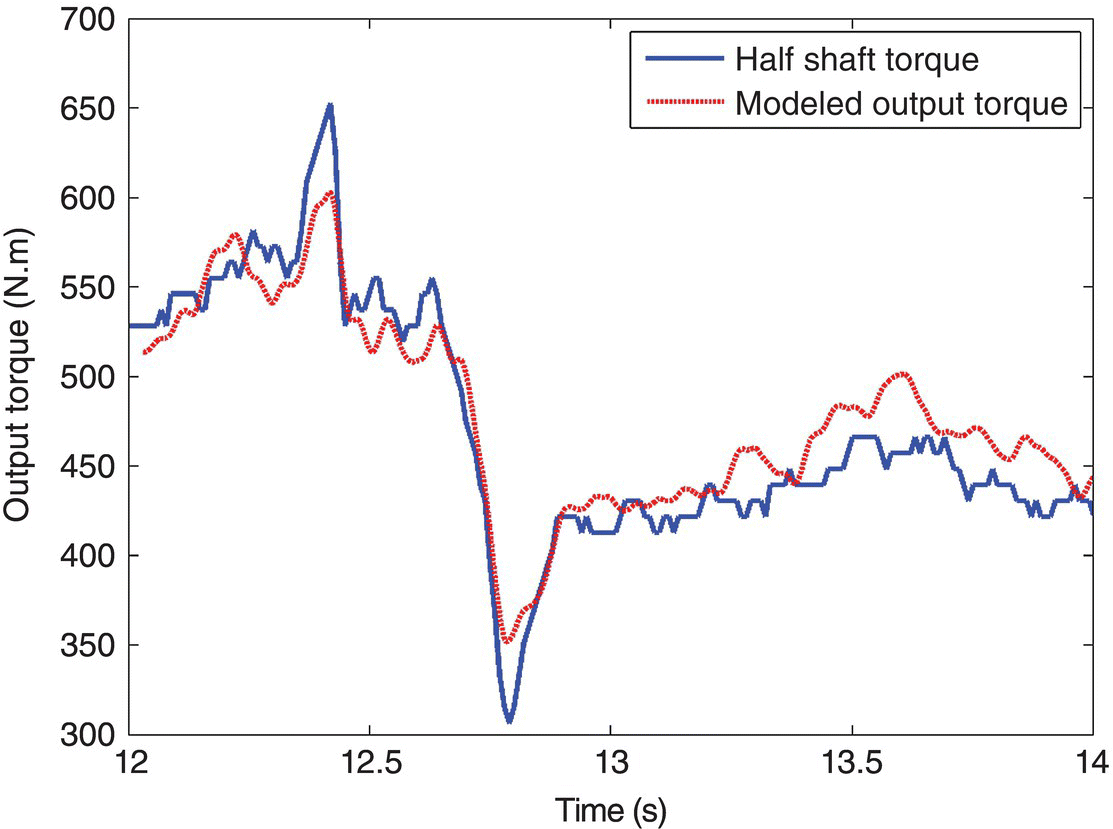
Figure 8.23 Clutch torque comparison during the 1–2 upshift.
The clutch torque when the vehicle operates in a fixed gear can also be calculated by the algorithm represented in this section. The results in fourth gear operation are shown in Figure 8.24. The torque in clutch CL1 equals zero because only clutch CL2 is now transferring the engine torque to drive the vehicle. As shown in the figure, the torque in clutch CL2 is almost the same as the test results, which reconfirms the accuracy of the proposed algorithm.
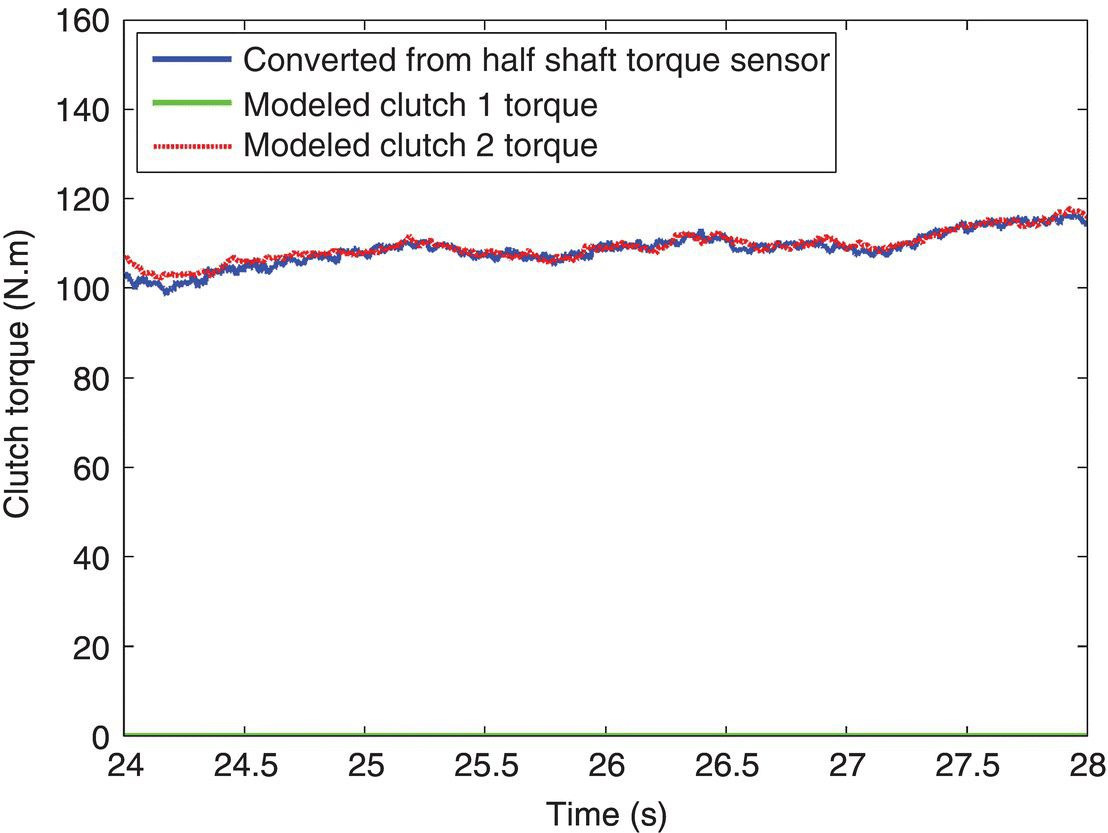
Figure 8.24 Clutch torque comparison during operation in the fourth gear.
In summary, this section is focused on the dual clutch torque formulation and calibration. The clutch torque formulation is proposed based on a constant energy conversion rate over the friction disk face. The correlation on clutch torque and the parameters of the clutch actuator has been established in terms of roller position, and the related design parameters. For calibration purposes, a clutch torque calculation algorithm has been proposed based on DCT powertrain dynamics. This algorithm uses vehicle wheel speed obtained from a speed sensor as the input.
The algorithm has several advantages: (a) it enables the determination of clutch torque without using the friction coefficient of the friction disk which varies as a function of temperature; (b) it provides an effective way to calibrate the clutch torque against the design and control variables of the clutch and its actuator; (c) it provides a reliable correlation between clutch torque and clutch control variable during real time operation for adaptive transmission control. Finally, the analytical formulation and algorithm for clutch torque calculation are validated against proving ground test data and good agreement is achieved between analytical and test data.
References
- 1 Song, X., Liu, J. and Smedley, D.: Simulation Study of Dual Clutch Transmission for Medium Duty Truck Applications, SAE Paper No. 2005‐01‐3590.
- 2 Kulkarni, M., Shim, T., and Zhang, Y.: Shift Dynamics and Control of Dual‐Clutch Transmissions, Mechanisms and Machine Theory, 2007, 42(2), pp. 168–182.
- 3 Zhang, Y., Chen, X., Zhang, X., Jiang, H., and Tobler, W.: Dynamic Modeling and Simulation of a Dual‐Clutch Automated Lay‐shaft Transmissions, ASME Journal of Mechanical Design, 2005, Vol. 127, No. 2, pp. 302–307.
- 4 Goetz, M., Levesley, M., and Crolla, D.: Integrated Powertrain Control of Gearshifts on Twin Clutch Transmissions, Proceedings of the Transmission and Driveline Systems Symposium 2004, SAE Paper No. 2004‐01‐1637.
- 5 Goetz, M., Levesley, M., and Crolla, D.: Dynamics and Control of Gearshift on Twin Clutch Transmissions, Proc. Inst. Mech. Engr, Part D (J. Automobile Engr), 2005, 219(8), pp. 951–963.
- 6 Livshiz, M., Kao, M., and Will, A.: Validation and Calibration Process of Powertrain Model for Engine Torque Control Development, SAE Paper No. 2004‐01‐0902.
- 7 Walamatsu, H., Ohashi, T., Asatsuke, S., and Saitou, Y.: Honda’s 5‐speed All Clutch to Clutch Automatic Transmission, Proceedings of the Transmission and Driveline Systems Symposium 2002, SAE Paper No. 2002‐01‐0932.
- 8 Minowa, T., Ochi, T., and Kuroiwa, H.: Smooth Gear Shift Control Technology for Clutch to Clutch Shifting, Proceedings of the Transmission and Driveline Systems Symposium 1999, SAE Paper No. 1999‐01‐1054.
- 9 Liu, Y., Qin, D., Jiang, H., and Zhang, Y.: A Systematic Model for Dynamics and Control of Dual Clutch Transmissions, Journal of Mechanical Design, ASME Transaction, 2009, Vol. 131, No. 6, pp. 061012‐1‐061012‐7.
- 10 Liu, Y., Qin, D., Jiang, H., Liu, C., and Zhang, Y.: Clutch Torque Formulation and Calibration for Dry Dual Clutch Transmissions, Mechanism and Machine Theory, 2014, Vol. 75, pp. 41–53.
- 11 Liu, Y., Qin, D., Jiang, H., and Zhang, Y.: Shift Control Strategy and Experimental Validation for Dry Dual Clutch Transmissions, Mechanism and Machine Theory, 2011, Vol. 46, pp. 218–277.
- 12 Matthes, B.: Dual Clutch Transmissions – Lessons Learned and Future Potential, Proceedings of the Transmission and Driveline Systems Symposium 2005, SAE Paper No. 2005‐01‐1021.
- 13 Wheals, J., Turner, A., Ramasy, K., and O’Neil, A.: Double Clutch Transmission (DCT) Using Multiplexed Linear Actuation Technology and Dry Clutches for High Efficiency and Low Cost, SAE Paper No. 2007‐01‐1096.
- 14 Razzacki, S. and Hottenstein, J.: Synchronizer Design nd Development for Dual Clutch Transmission (DCT), SAE Paper No. 2007‐01‐0114.
Problems
- For the dry DCT with hydraulically actuated clutches and gear shifting shown in Figure 8.6 for a dual mass flywheel DCT, construct the hydraulic system circuit for the actuation of the dual clutches and the gear shifters. The hydraulic system should use one VFS for line pressure control, two VFS valves for clutch actuation (one for each clutch) and shift solenoids for gear shifters. The hydraulic system should also include a hydraulic booster in the circuit.
- For the dynamic model structure shown in Figure 8.10 for a dual mass flywheel DCT, formulate the state variable equations. In the formulation, only state variables should appear on the left side of the equations. In addition, represent the initial conditions for launch, 1–2 shift torque phase, and inertia phase respectively.


