Not only is Xcode provided free of charge on Apple’s developer site and the Mac App Store, but it is also a great tool. Aside from being able to use it to create the next great Mac, iPhone, iPad, AppleTV, and Apple Watch apps, Xcode has a debugger built right into the tool.
What exactly is a debugger? Well, let’s get something straight—programs do exactly what they are written to do, but sometimes what is written isn’t exactly what the program is really meant to do. This can mean the program crashes or just doesn’t do something that is expected. Whatever the case, when a program doesn’t work as planned, the program is said to have bugs . The process of going through the code and fixing these problems is called debugging.
There is still some debate as to the real origin of the term bug, but one well-documented case from 1947 involved the late Rear Admiral Grace Hopper, a Naval reservist and programmer at the time. Hopper and her team were trying to solve a problem with the Harvard Mark II computer. One team member found a moth in the circuitry that was causing the problem with one of the relays. Hopper was later quoted as saying, “From then on, when anything went wrong with a computer, we said it had bugs in it.”1
Regardless of the origin, the term stuck and programmers all over the world use debuggers, such as the one built into Xcode, to help find bugs in programs. But people are the real debuggers; debugging tools merely help programmers locate problems. No debugger, whatever the name might imply, fixes problems on its own.
This chapter highlights some of the more important features of the Xcode debugger and explains how to use them. Once you are finished with this chapter, you should have a good enough understanding of the Xcode debugger and of the debugging process in general to allow you to search for and fix the majority of programming issues.
Getting Started with Debugging
If you’ve ever watched a movie in slow motion just so you can catch a detail you can’t see when the movie is played at full speed, you’ve used a tool to do something a little like debugging. The idea that playing the movie frame by frame will reveal the detail you are looking for is the same sort of idea you apply when debugging a program. With a program, sometimes it becomes necessary to slow things down a bit to see what’s happening. The debugger allows you to do this using two main features: setting a breakpoint and stepping through the program line by line—more on these two features in a bit. Let’s first look at how to get to the debugger and what it looks like.
First, you need to load an application. The examples in this chapter use the BookStore project from Chapter 8, so open Xcode and load the BookStore project.
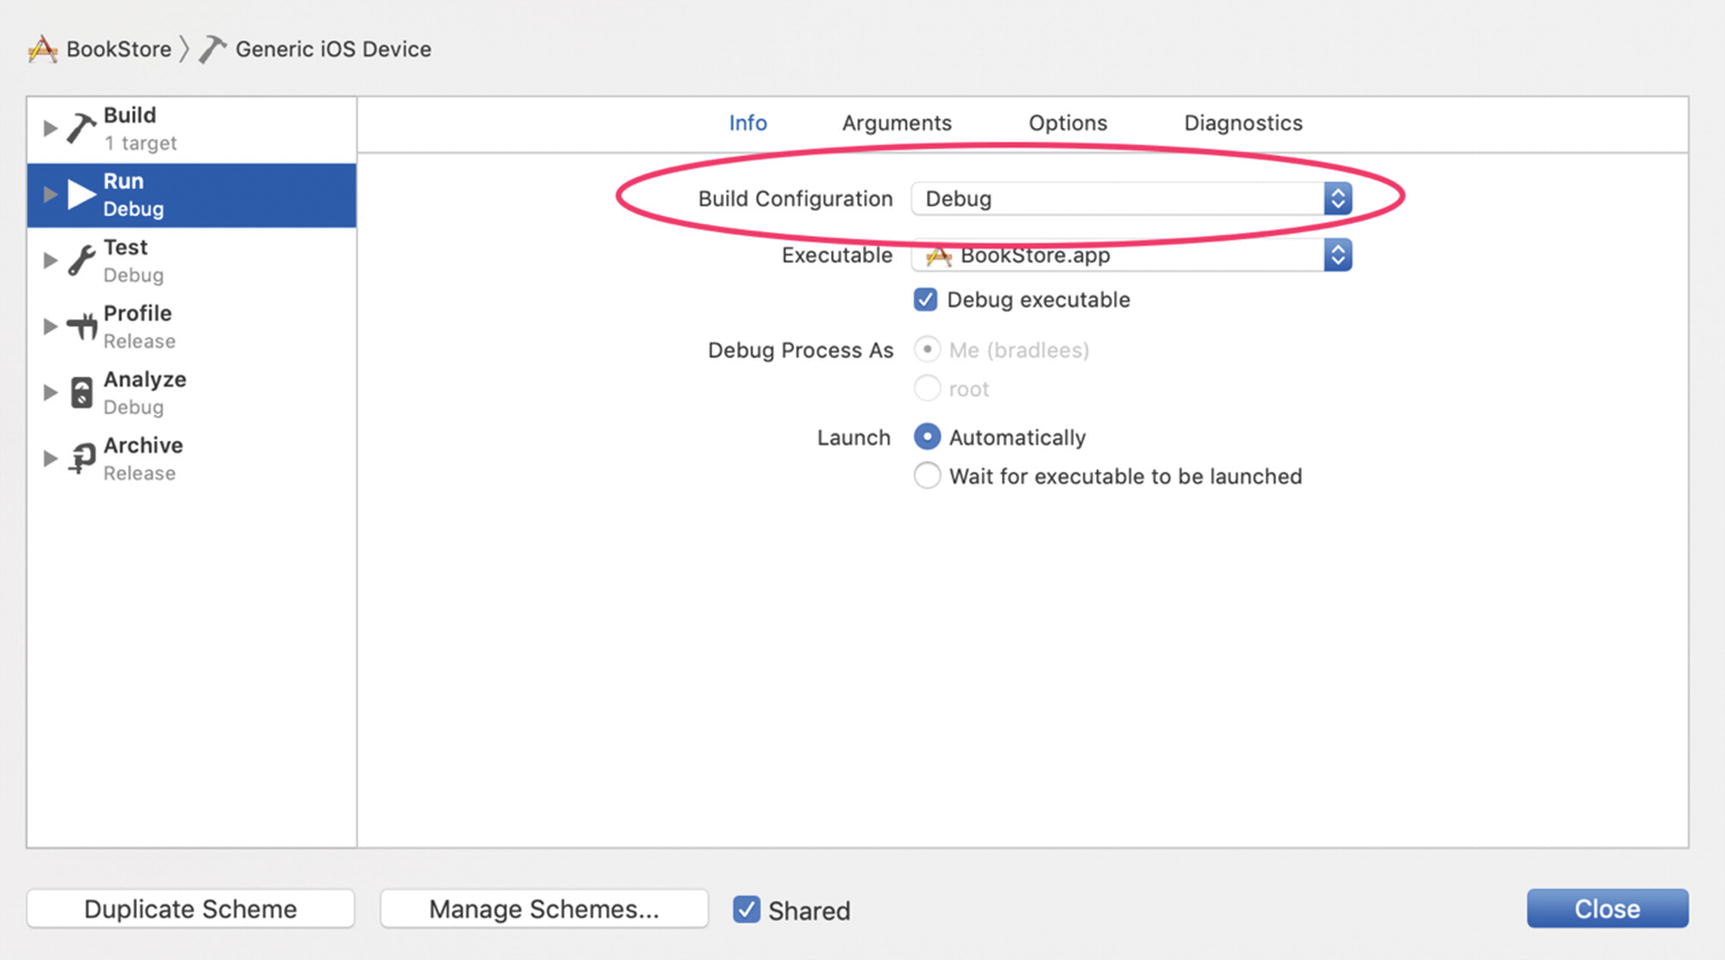
Selecting the Debug configuration
While this book won’t discuss Xcode schemes, just know that by default Xcode provides both a Release configuration and a Debug configuration for any macOS, iOS, watchOS, or tvOS project you create. The main difference as it pertains to this chapter is that a Release configuration doesn’t add any program information that is necessary for debugging an application, whereas the Debug configuration does.
Setting Breakpoints
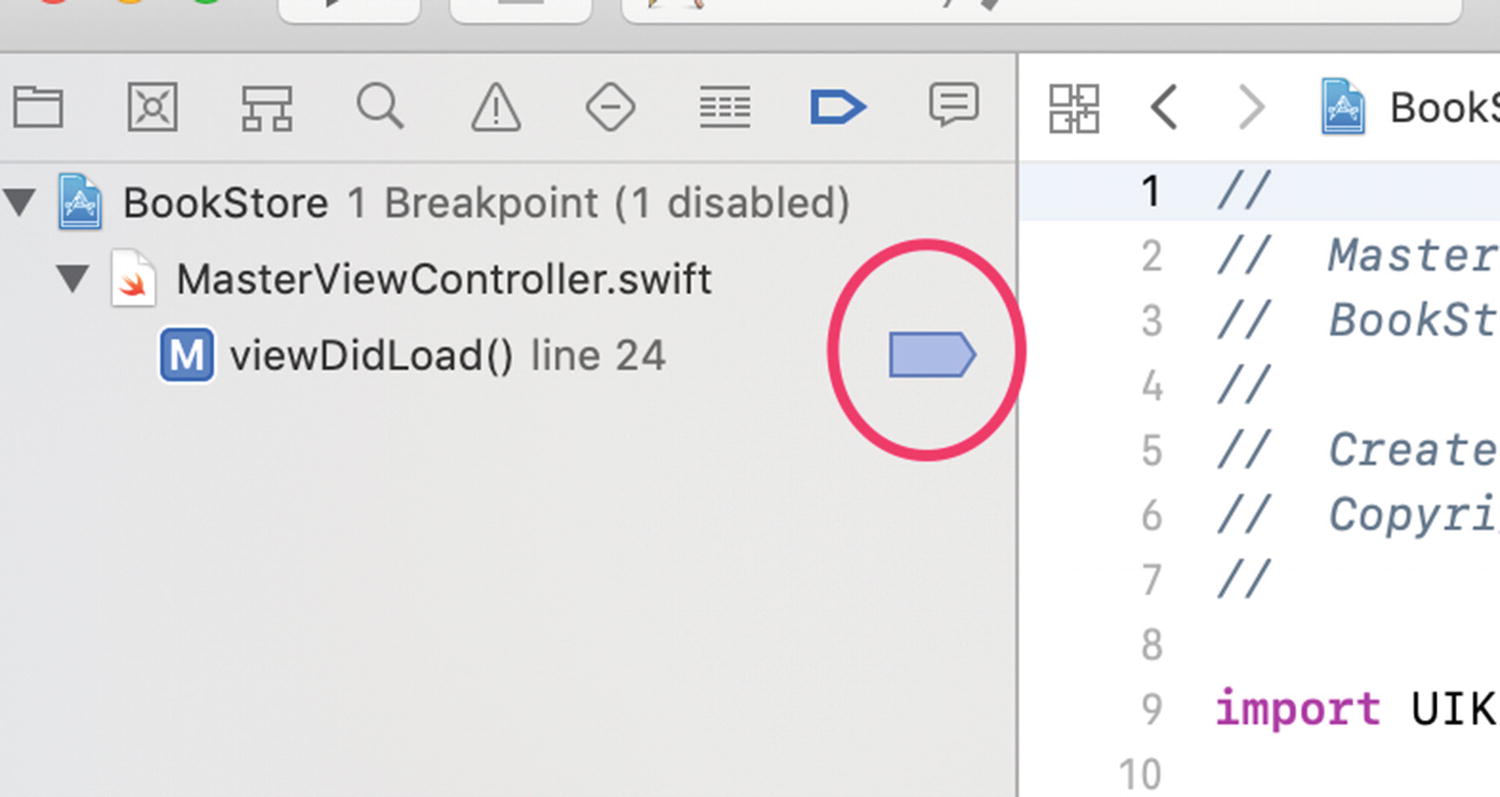
To see what’s going on in a program, you need to make the program pause at certain points that you as a programmer are interested in. A breakpoint allows you to do this. In Figure 13-2, there is a breakpoint on line 24 of the program. To set this, simply place the mouse cursor over the line number (not the program text, but the number 24 to the left of the program text) and click once. You will see a small blue arrow behind the line number. This lets you know that a breakpoint is set.
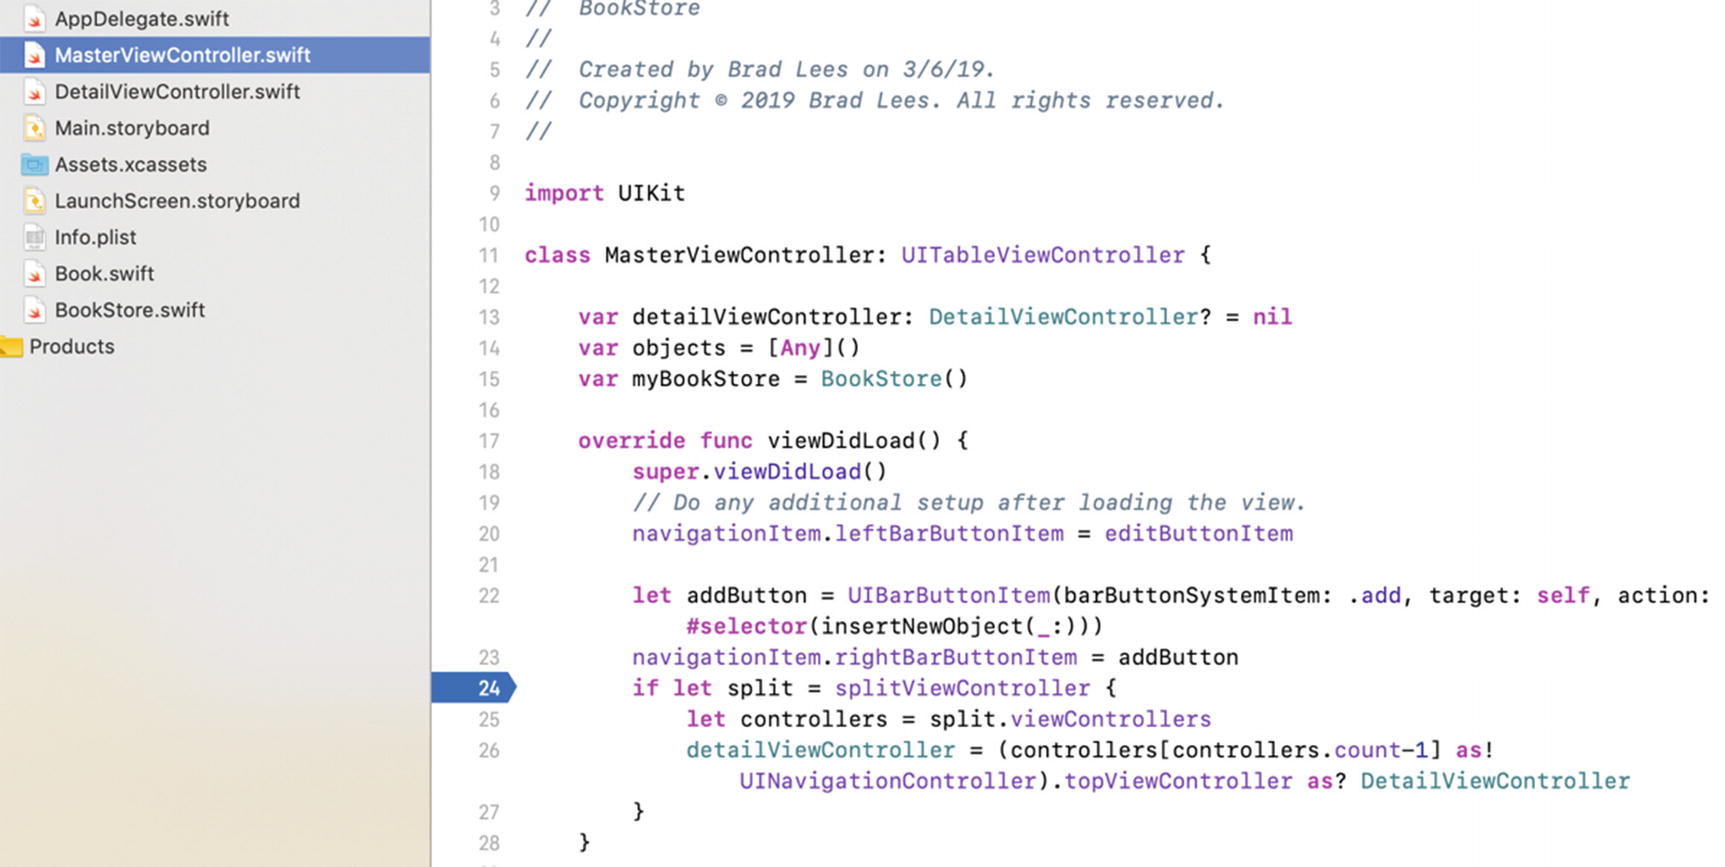
Your first breakpoint
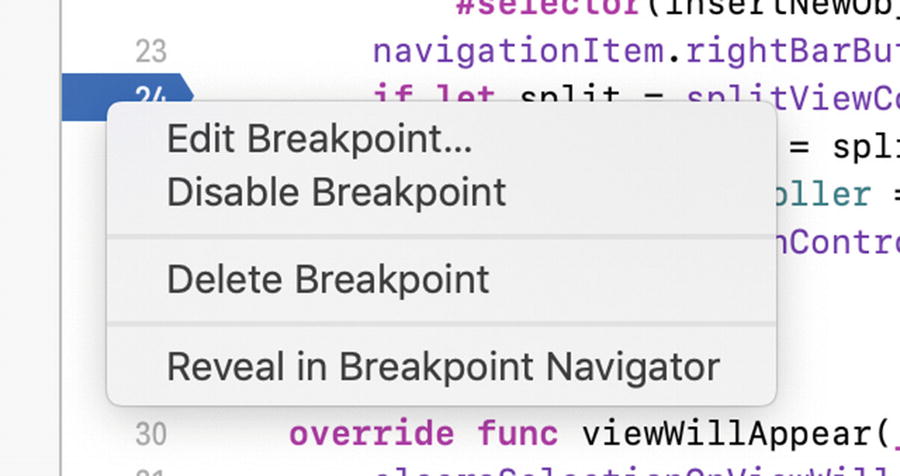
Right-clicking a breakpoint
Setting and deleting breakpoints are pretty straightforward tasks.
Using the Breakpoint Navigator
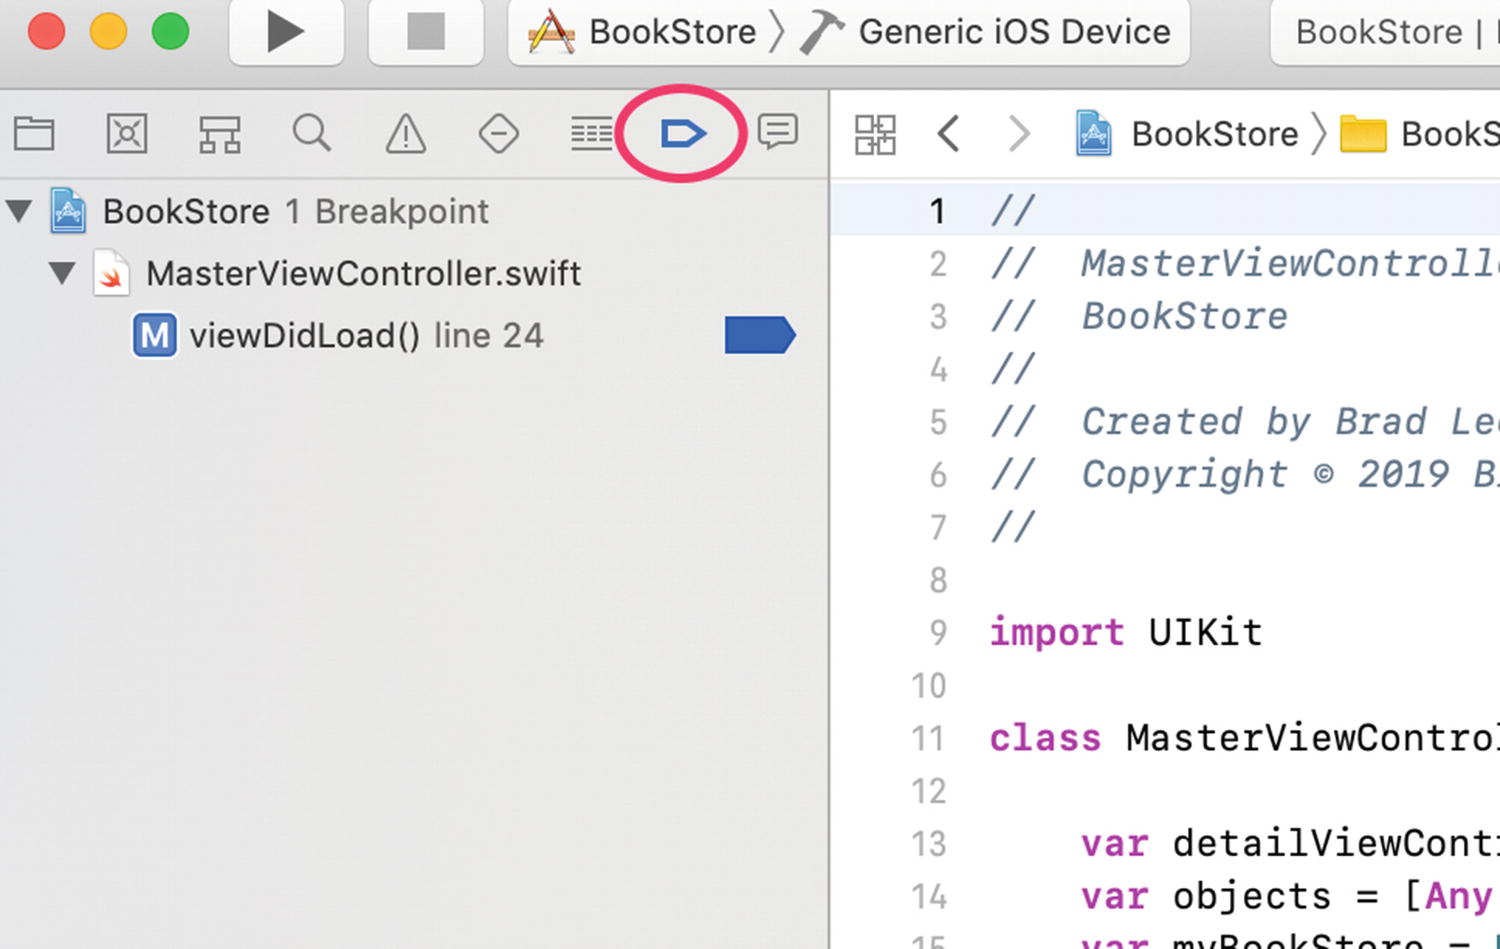
Accessing the Breakpoint Navigator in Xcode
Once you’ve clicked the icon, the navigator will list all the breakpoints currently defined in the application grouped by source file. You can use the disclosure arrows to show or hide breakpoints. From here, clicking a breakpoint will take you to the source file with the breakpoint. You can also easily delete and disable breakpoints from here.
Using the Breakpoint Navigator to enable/disable a breakpoint
It is sometimes handy to disable a breakpoint instead of deleting it, especially if you plan to put the breakpoint back in the same place again. The debugger will not stop on these faded breakpoints, but they remain in place so they can be conveniently enabled and act as a marker to an important area in the code.
It’s also possible to delete breakpoints from the Breakpoint Navigator. Simply select one or more breakpoints and press the Delete key. Make sure you select the correct breakpoints to delete since there is no undo feature.
It’s also possible to select the file associated with the breakpoints. In this case, if you delete the file listed in the Breakpoint Navigator and press Delete, all breakpoints in that file will be deleted.
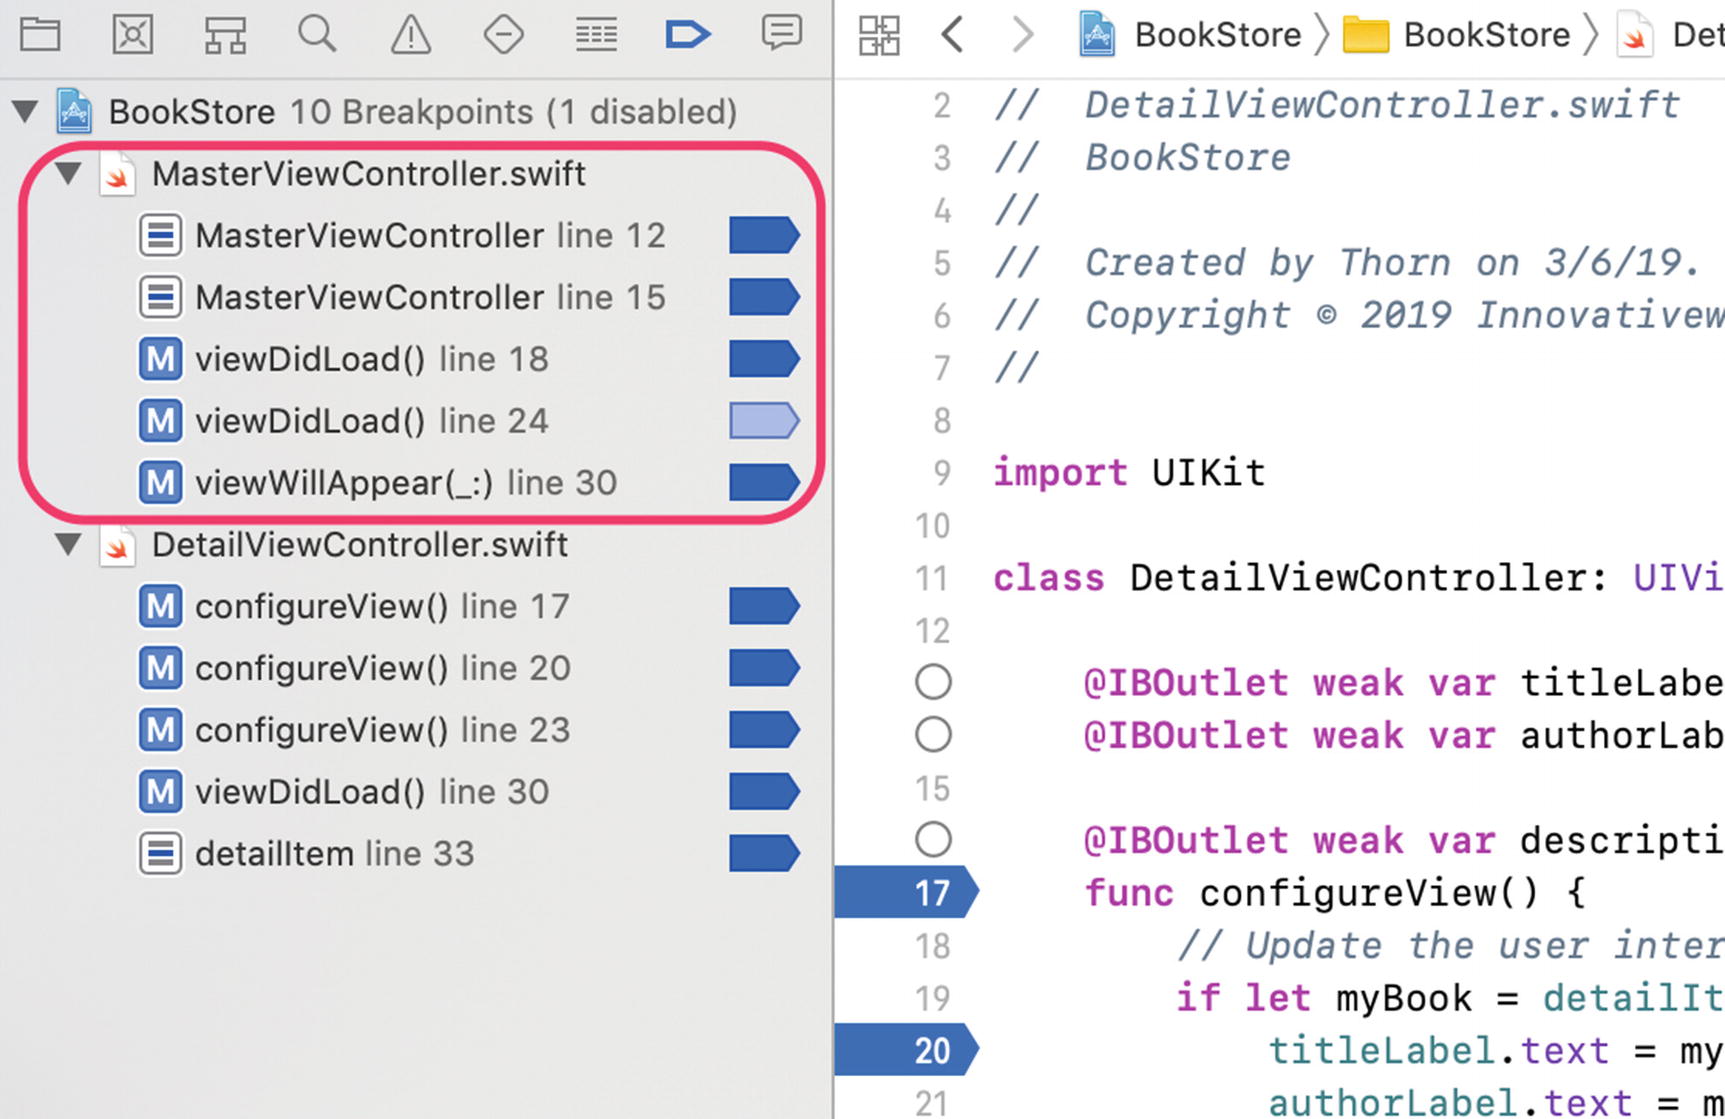
A file with several breakpoints
Debugging Basics

The Build and Run and Stop buttons in the Xcode toolbar
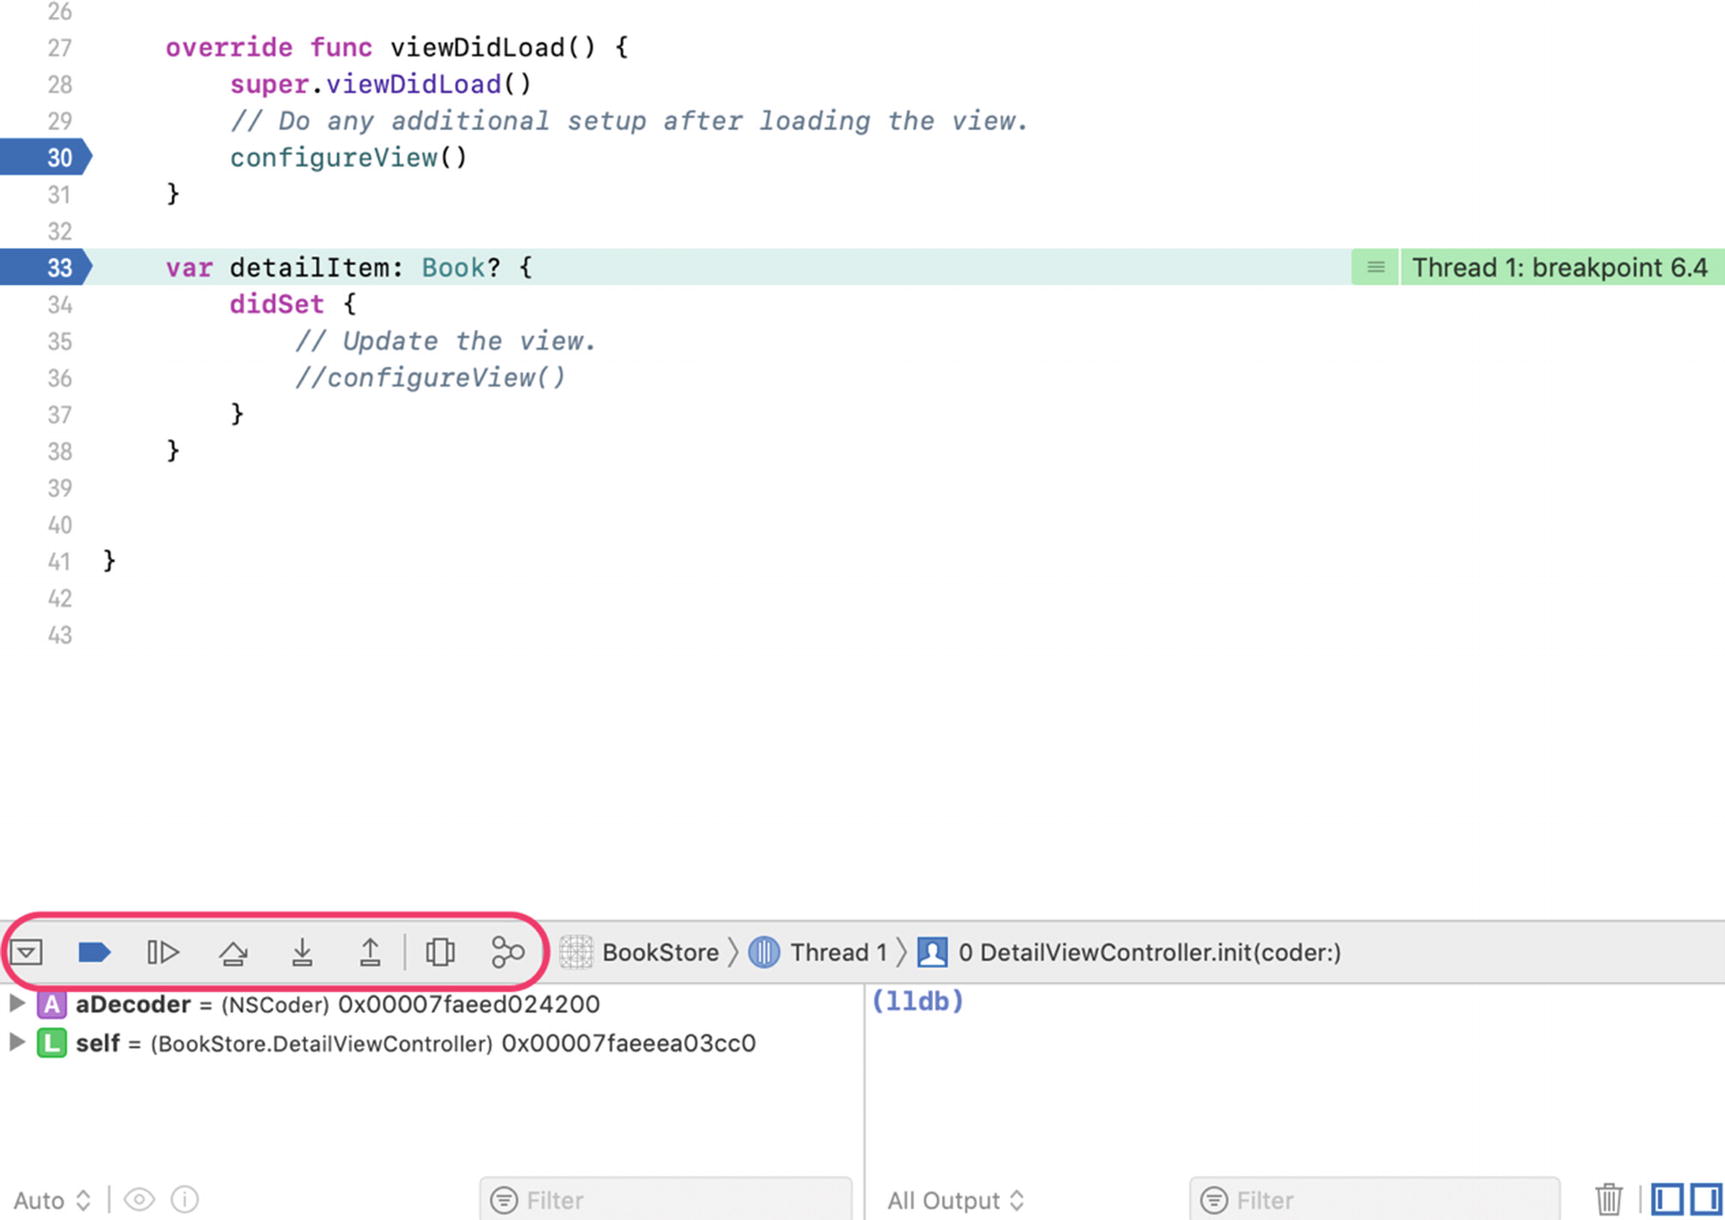
The Debugger view with execution stopped on line 33
- Debugger controls (circled in Figure 13-8): The debugging controls can pause, continue, step over, step into, and step out of statements in the program. The stepping controls are used most often. The first button on the left is used to show or hide the debugger view. In Figure 13-8, the debugger view is shown. Figure 13-9 labels the different pieces of the debugger view.
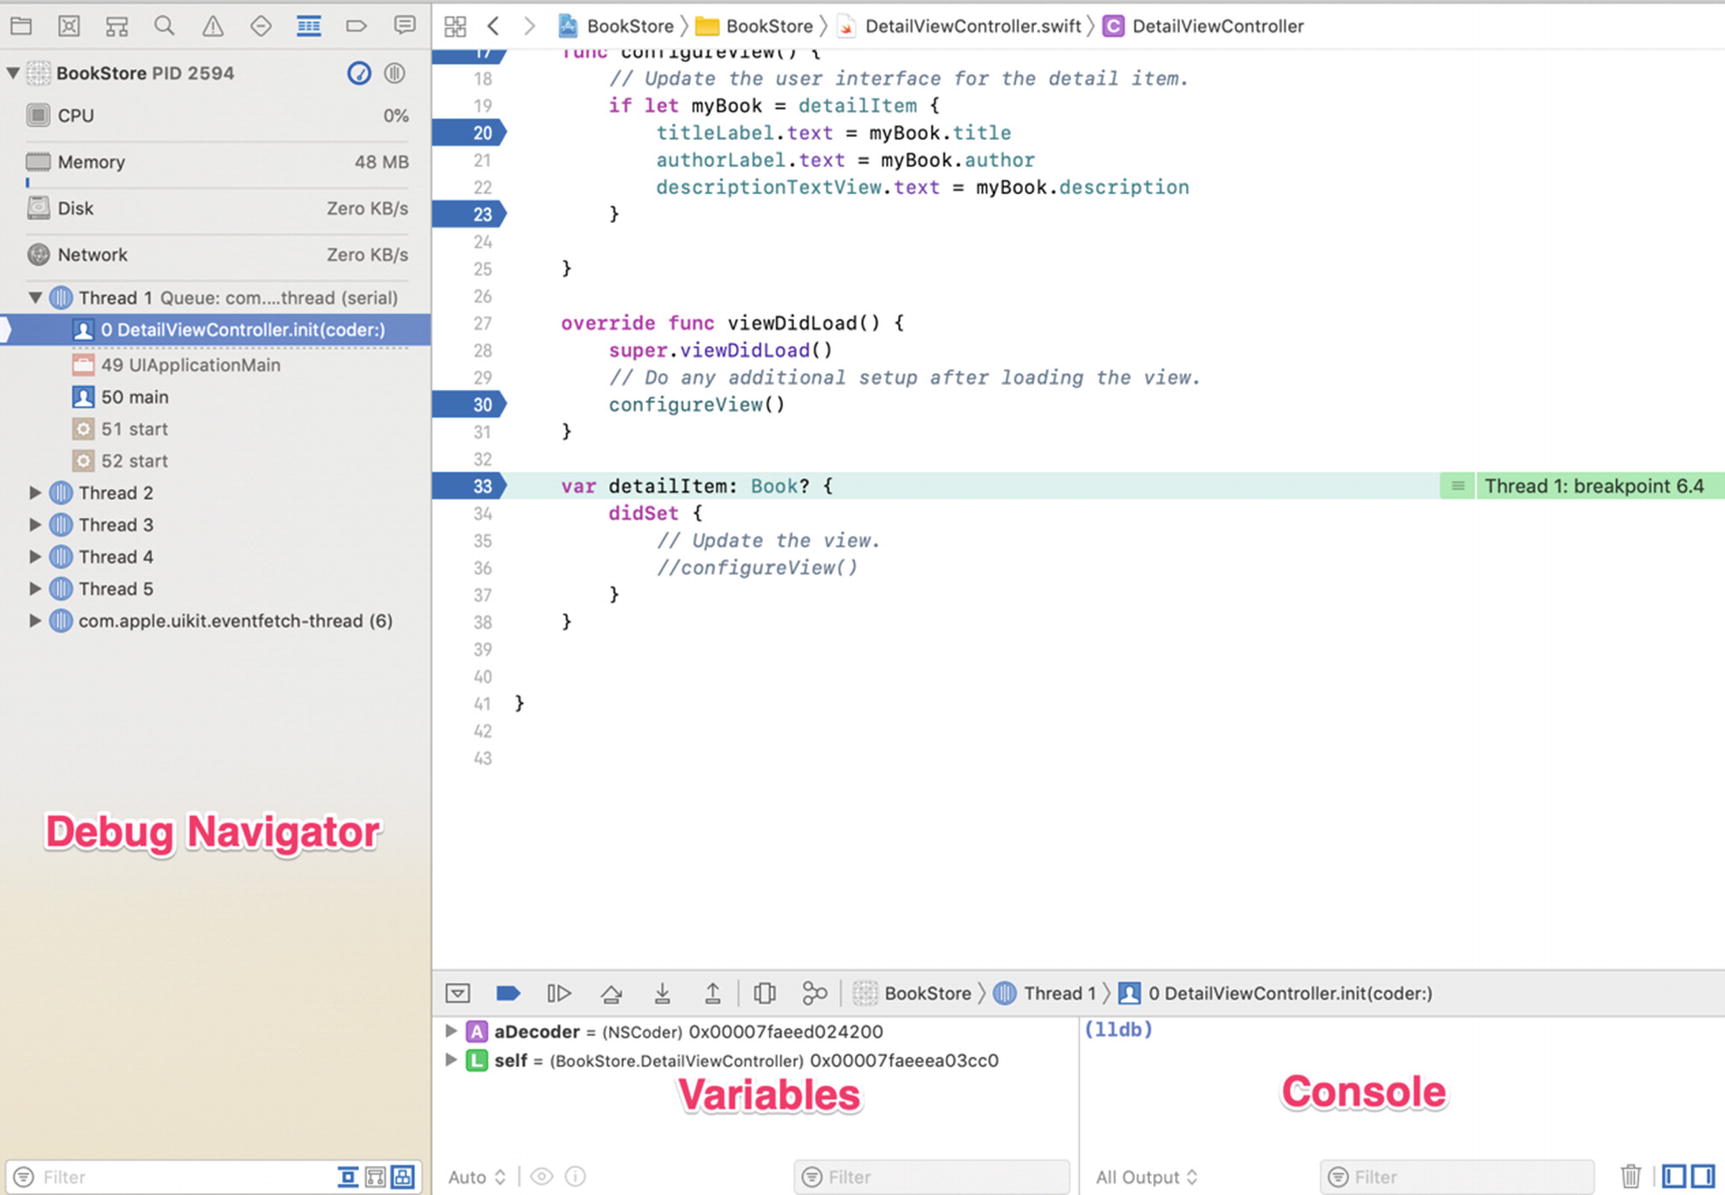 Figure 13-9.
The debugger locations
Variables: The Variables view displays the variables currently in scope. Clicking the little triangle just to the left of a variable name will expand it.
Console: The output window will show useful information in the event of a crash or exception. Also, any NSLog or print output goes here.
Debug navigator: The stack trace shows the call stack as well as all the threads currently active in the program. The stack is a hierarchical view of what methods are being called. For example, UIApplicationMain calls the UIViewController class. These method calls “stack” up until they finally return.
Working with the Debugger Controls
Xcode Debugging Controls
Control | Description |
|---|---|
| Clicking the Stop button will stop the execution of the program. If the iPhone or iPad emulator is running the application, it will also stop as if the user force quit the app. Clicking the Run button (looks like a Play button) starts debugging. If the application is currently in debug mode, clicking the Run button again will restart debugging the application from the beginning; it’s like stopping and then starting again. |
| Clicking this button causes the program to continue execution. The program will continue running until it ends, the Stop button is clicked, or the program runs into another breakpoint. |
| When the debugger stops on a breakpoint, clicking the Step Over button will cause the debugger to execute the current line of code and stop at the next line of code. |
| Clicking the Step In button will cause the debugger to go into the specified function or method. This is important if there is a need to follow code into specific methods or functions. Only methods for which the project has source code can be stepped into. |
| The Step Out button will cause the current method to finish executing, and the debugger will go back to the method that originally called it. |


Using the Step Controls
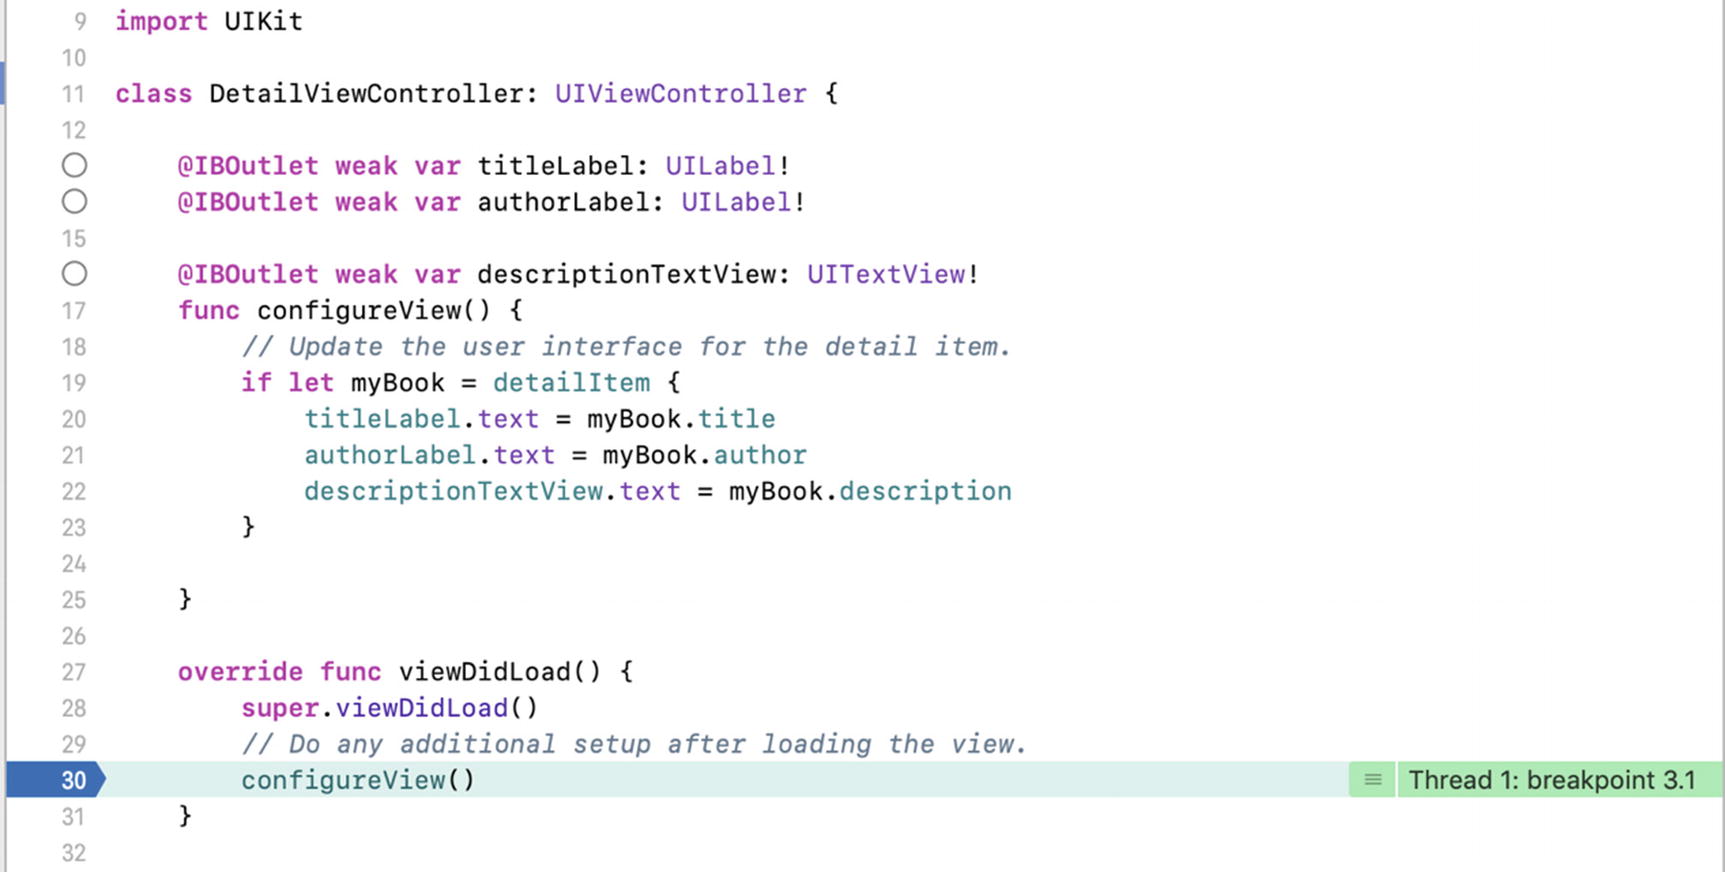
The debugger stopped on line 30
 , which will cause the debugger to go into the configureView() method of the DetailViewController object. The screen should look like Figure 13-11.
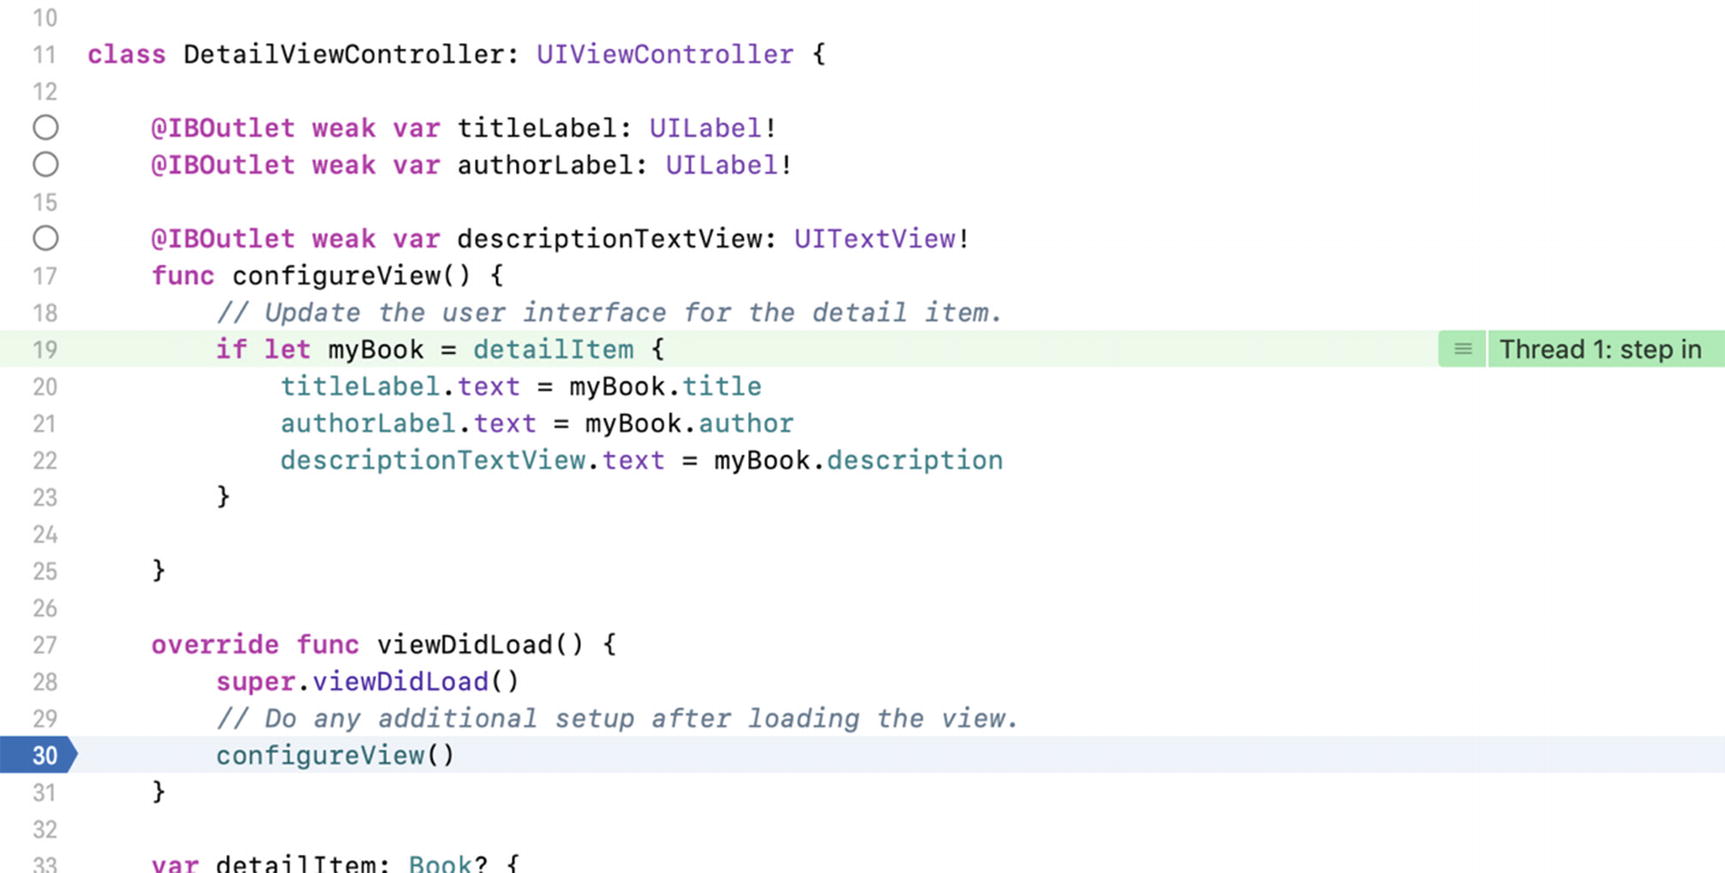
Stepping into the configureView method of the DetailViewController object
The control Step Over,  , continues execution of the program but doesn’t go into a method. It simply executes the method and continues to the next line. Step Out,
  , is a little like the opposite of Step In. If the Step Out button is clicked, the current method continues execution until it finishes. The debugger then returns to the line after Step In was clicked. For example, if the Step In button is clicked on the line shown in Figure 13-9 and then the Step Out button is clicked, the debugger will return to the viewDidLoad() method of the DetailViewController.swift file after the statement shown in Figure 13-9 (line 31 in the example), which was the line where Step In was clicked.
Looking at the Thread Window and Call Stack
As mentioned earlier, the Debug navigator displays the current thread. However, it also displays the call stack. If you look at the difference between Figures 13-9 and 13-10 as far as the thread window goes, you can see that Figure 13-10 has the configureView method listed because DetailViewController calls the configureView method .
Now, the call stack is not simply a list of functions that have been called; rather, it’s a list of functions that are currently being called. That’s an important distinction. Once the configureView method is finished and returns (line 26), configureView will no longer appear in the call stack. You can think of a call stack almost like a breadcrumb trail. The trail shows you how to get back to where you started.
Debugging Variables
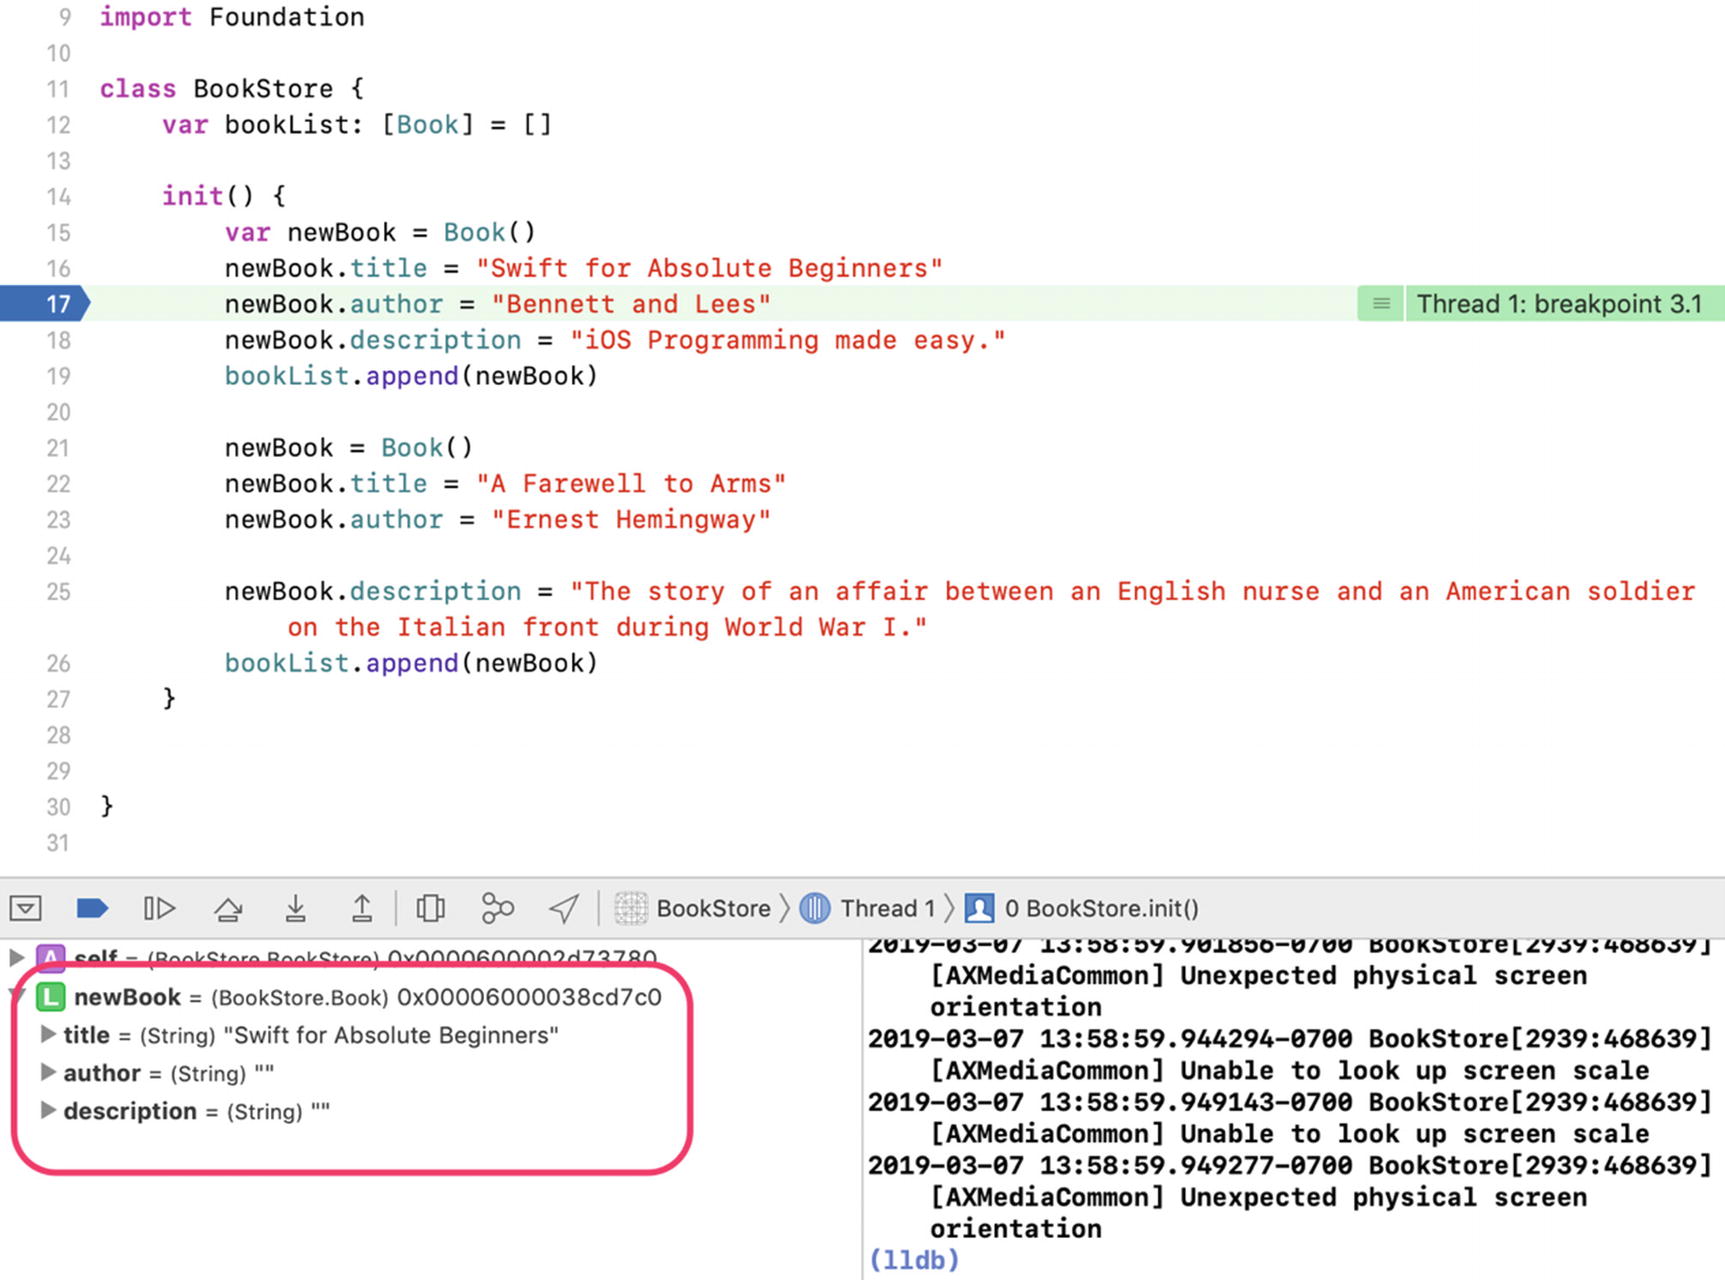
Viewing a variable value
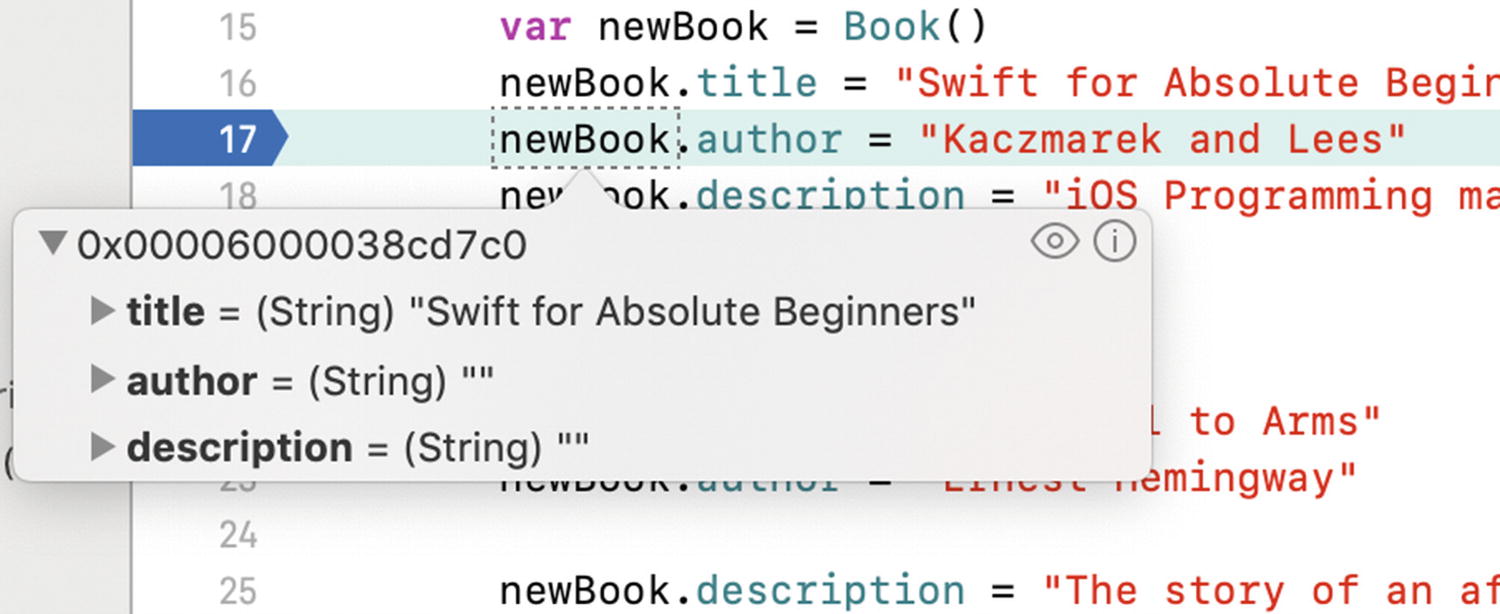
Hovering over the newBook variable reveals some information
Hovering over the newBook variable reveals its information. In Figure 13-13, you can see the newBook variable expanded.
Dealing with Code Errors and Warnings
While coding errors and warnings aren’t really part of the Xcode debugger, fixing them is part of the entire debugging process. Before a program can be run (with or without the debugger), all errors must be fixed. Warnings won’t stop a program from building, but they could cause issues during program execution. It’s best not to have warnings at all.
Errors
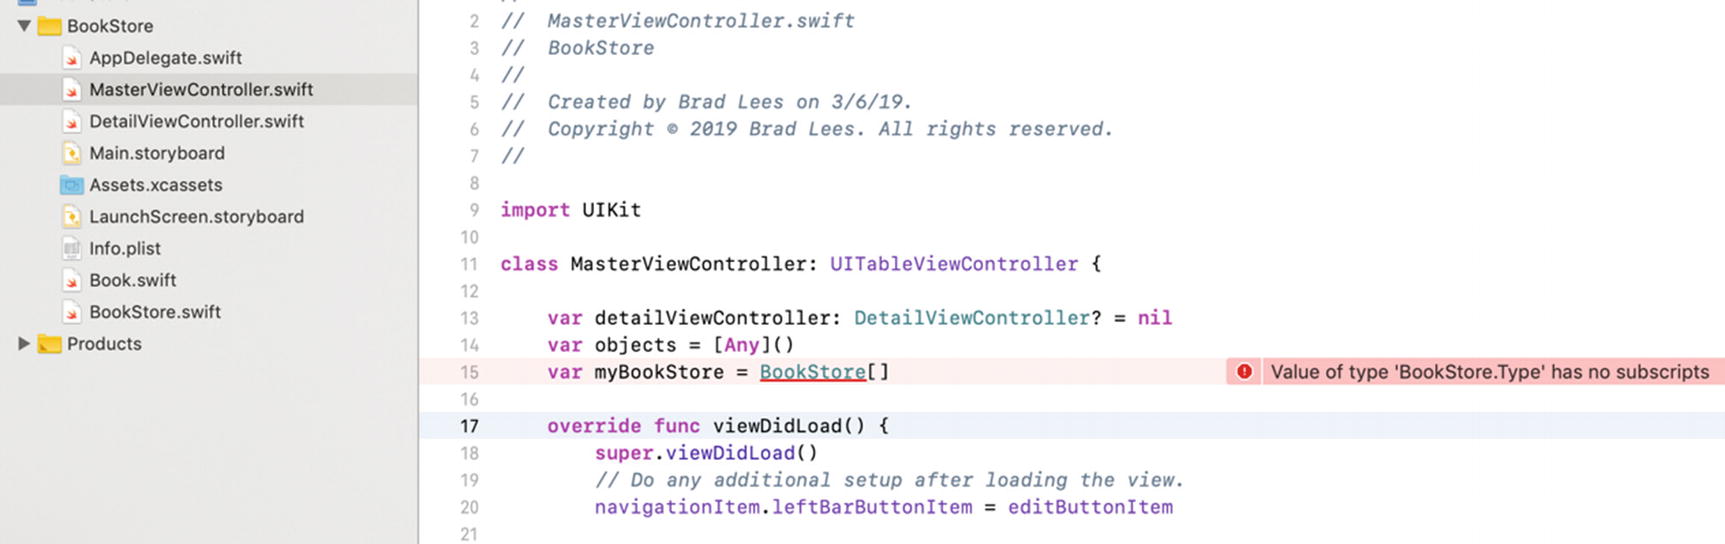
Viewing the error in Xcode
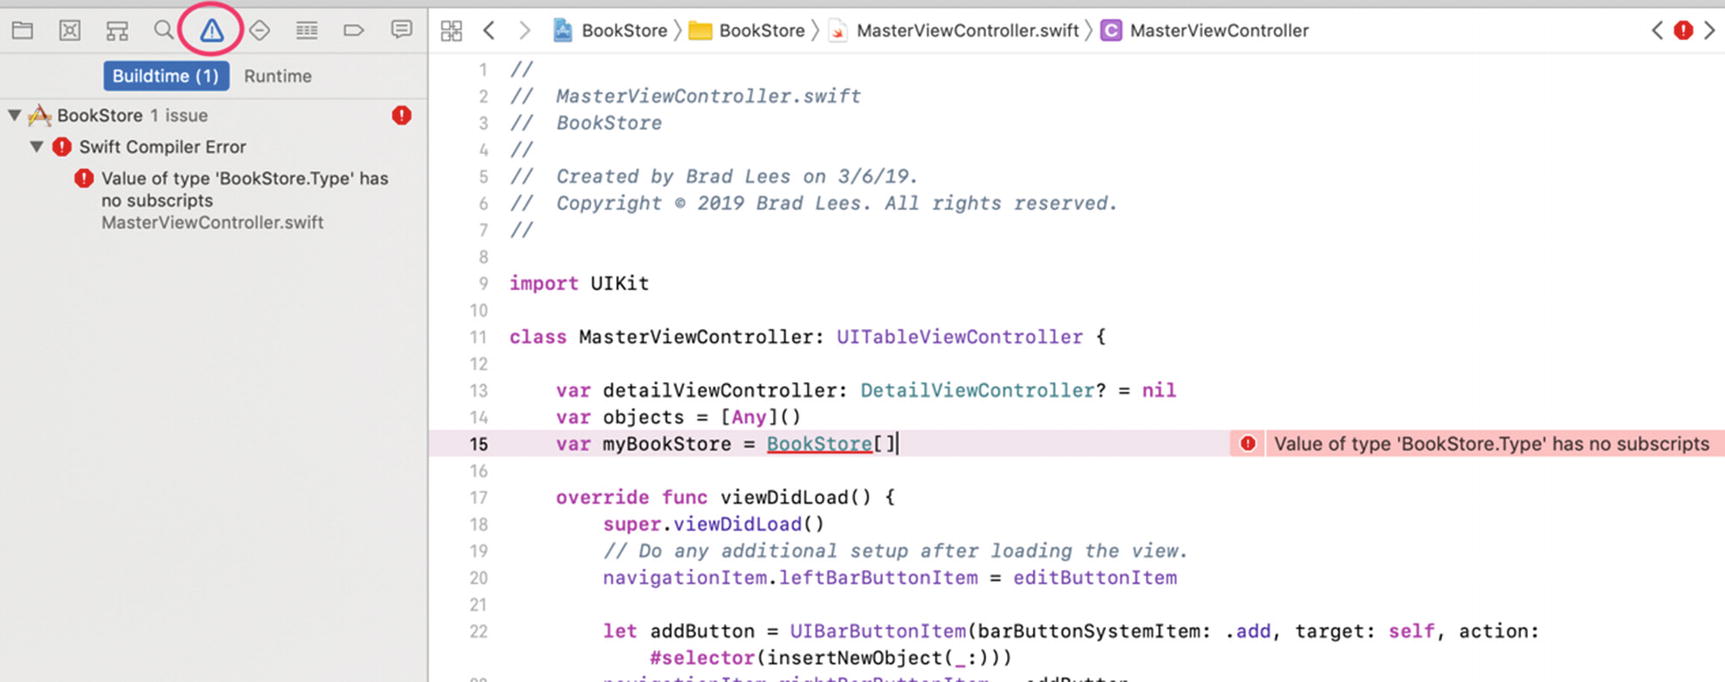
Viewing the Issue Navigator
Generally, the error points to the problem. In the previous case, the BookStore object was initialized as an array rather than as an object.
Go ahead and fix the error by changing [] to ().
Warnings
Warnings indicate potential problems with the program. As mentioned, warnings won’t stop a program from building but may cause issues during program execution. It’s outside the scope of this book to cover those warnings that may or may not cause problems during program execution; however, it’s good practice to eliminate all warnings from a program.
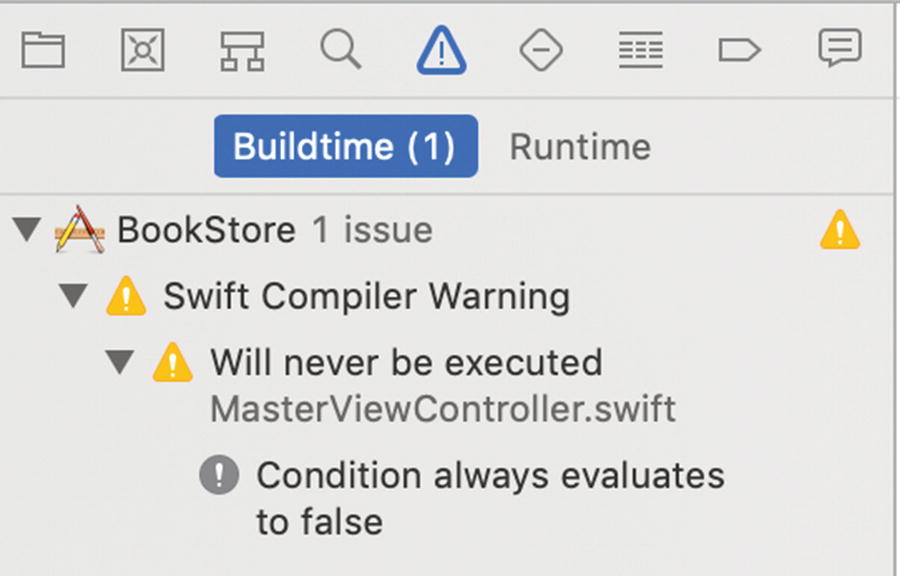
Viewing the warnings in the Issue Navigator
Viewing your first warning
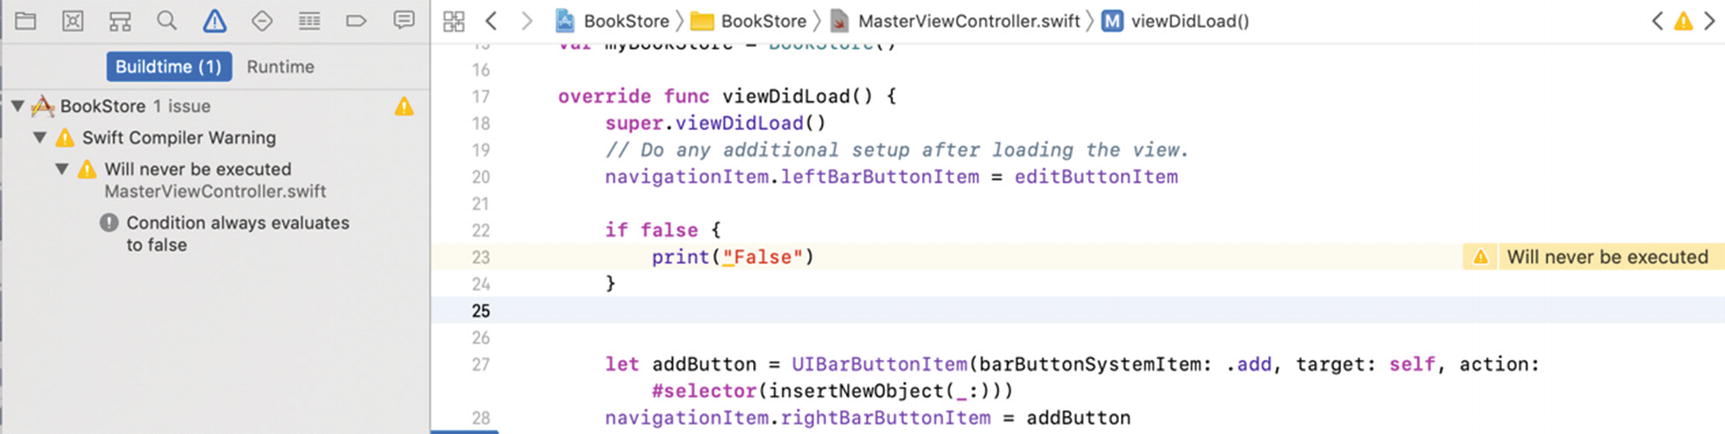
“Will never be executed”
This is a simple example of a warning. You can receive warnings for many things such as unused variables, incomplete delegate implementations, and unexecutable code. It is good practice to clean up the warnings in your code to avoid issues down the road.
Summary
The origins of the term bug and what a debugger is
The high-level features of the Xcode debugger, including breakpoints and stepping through a program
Using the debugging controls called Continue, Step Over, Step In, and Step Out
Working with the various debugger views, including threads (call stack), Variables view, Text editor, and Console Output
Looking at program variables
Dealing with errors and warnings