Chapter 11
Financial Modeling and Project Evaluation
Financial modeling plays an important role in project evaluation. Lenders are concerned about the timeliness of project debt service payments, and equity investors are concerned about the adequacy of their returns. Cash flow modeling is used to address both sets of concerns.
For a project financing to be viable, the project's cash flow must be adequate both to service project debt in a timely manner and to provide an acceptable rate of return to equity investors. The expected rate of return on investment must be commensurate with project risk. Equity investors require a higher expected rate of return than lenders, and active equity investors expect a higher rate of return than passive equity investors.
Preparing Cash Flow Projections
The economic viability of a project depends on the adequacy of the cash flows generated as compared to the cash flows that must be expended. The timing of the cash inflows and outflows is a contributing factor. Thus, discounted cash flow analysis is crucial in determining the economic viability of a proposed project and the adequacy of the rates of return that providers of capital to the project can expect to realize.
Projecting the cash outflows and inflows is a critical part of this analysis. The cash outflows are typically easier to predict. They occur primarily in the earlier years of the project. The more distant operating cash inflows are inherently more difficult to predict. The discount rate chosen to calculate the net present value of the cash flows—or to evaluate the adequacy of the internal rate of return—should take into account this riskiness.
Estimating the Project's Total Cost
First, the project's total cost must be determined. Total cost includes (1) all direct costs, such as engineering, labor, and materials; and (2) all indirect costs, such as financing-related charges (including interest and commitment fees) and the cost of financial guarantees or other credit support mechanisms.
In the case of the Cogeneration Project, Engineering Firm and Local Utility, the two owners of Cogeneration Corporation, have agreed to pay various preconstruction costs—mainly, the fees for securing the many permits the Cogeneration Project will need to have before lenders will advance any construction funds. Preconstruction costs amount to $3 million. Engineering Firm and Local Utility contributed these permits to the project in return for equity in Cogeneration Company.1
The principal engineering firm usually supplies a construction drawdown schedule. The construction period allows time for preliminary engineering and licensing in addition to the actual construction. For the Cogeneration Project, funds needed during the construction period will be supplied by a commercial bank. Bank debt will fund 100 percent of the cost during the construction period. Engineering Firm and Local Utility have arranged a $120 million construction loan facility. They have agreed to pay the bank a 1 percent loan facility fee on behalf of Cogeneration Company; the bank received $1.2 million at closing. In addition, Engineering Firm and Local Utility committed to the bank that they would arrange permanent financing for Cogeneration Company.2 They estimate that Cogeneration Company will incur approximately $2 million of fees in connection with arranging the permanent financing. Construction-period loans are generally made on a floating-rate basis.
Contingency for Cost Overruns
The construction loan should have sufficient capacity to provide funds for contingencies and for fluctuations in interest rates. Because the construction loan entails loan fees that depend on the size of the loan commitment, it is important not to oversize the construction loan.
Capital Cost
Table 11.1 indicates the total project cost of the Cogeneration Project, given a 24-month construction drawdown schedule and an interest rate of 10 percent. Interest is paid on funds that are drawn down, and a commitment fee is charged on the unused balance of the commitment. The loan commitment is designed to accommodate higher interest rates during the construction period and higher construction costs (for example, to cover design changes).
Table 11.1 Cogeneration Project: Total Project Cost and Construction Loan Drawdown Schedule (Millions of Dollars).
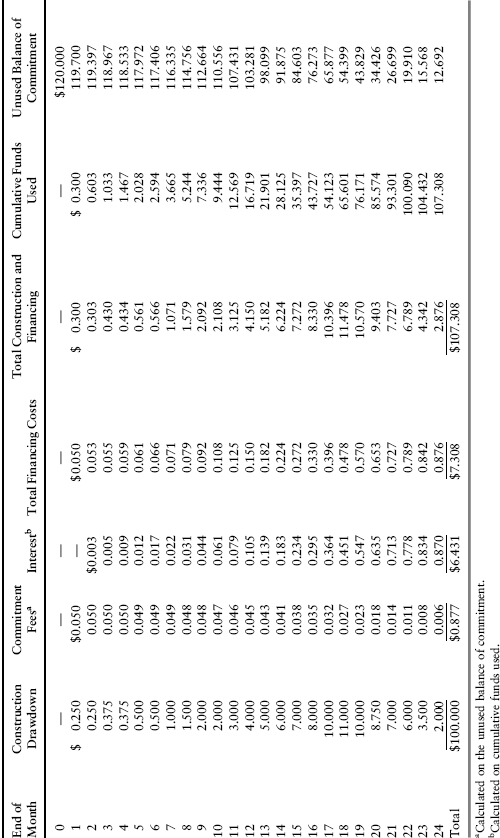
Construction is expected to cost $100 million. Commitment fees and interest will add $7.308 million, bringing the total construction cost to $107.308 million. The unused balance of $12.692 million shown in Table 11.1 is available to cover cost overruns or higher interest charges. Including the $3 million of preconstruction costs and $3.2 million cost of arranging financing, total expected project cost is $113.508 million.
The total project cost is sensitive to the interest rate applicable during the construction period. If the interest rate is higher than expected, project cost increases accordingly. The higher project cost requires a larger amount of permanent financing. As discussed in Chapter 14, the sponsors of a project can eliminate their interest rate risk exposure by arranging interest-rate swaps. The bank would receive a fee for arranging the swap transaction, which would have to be added to the project cost.
Ownership Arrangements
The Cogeneration Project's target capital structure is 25 percent equity and 75 percent debt. The proportions of equity and debt were determined by analyzing the profitability of the project. The greater the level of operating income that can be contractually assured, the greater the amount of debt a project can support. Cogeneration Company's debt will be nonrecourse to the equity investors. Long-term lenders must look solely to the project's cash flow for their repayment. The equity investors will receive their returns in the form of tax benefits, dividends paid out of excess cash flow from the project (i.e., after payment of debt service), and any residual value of the cogeneration plant.
Figure 11.1 indicates the initial capitalization of Cogeneration Company following completion of construction. Total capitalization equals $113.508 million, divided between long-term debt and equity:
| Amount | Percent | |
| Long-term debt | $85.131 million | 75.0% |
| Equity: | ||
| General partner | 2.838 | 2.5 |
| Limited partners | 25.539 | 22.5 |
| Total equity | 28.377 | 25.0 |
| Total capitalization | $113.508 million | 100.0% |
Figure 11.1 Sources of Long-Term Financing and the Allocation of Income, Losses, and Cash Distributions for the Cogeneration Projecta
aReversion occurs when the limited partners have received cumulative cash distributions equal to their original investment of $25.539 million. Thereafter, the general partner (Cogeneration Corporation) is entitled to receive 50 percent of all partnership income, losses, and cash distributions.
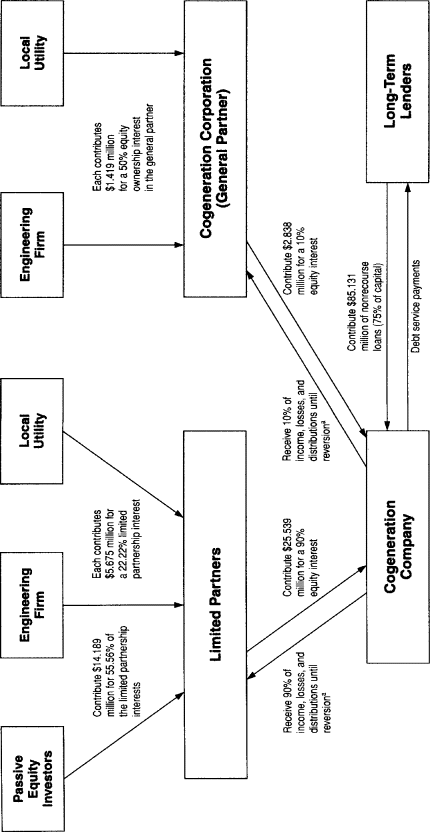
Engineering Firm and Local Utility each own half of the general partner, Cogeneration Corporation. Each will invest 25 percent of total project equity, and the passive equity investors will invest the other half of the equity. Engineering Firm and Local Utility invest just enough funds in Cogeneration Corporation to capitalize the general partner adequately for federal income tax purposes.
Initially, the general partner will receive 10 percent of the partnership's income, losses, and cash distributions, and the limited partners will receive the remaining 90 percent. Once the limited partners have received cumulative cash distributions equal to their original investment of $25.539 million, the 10/90 split will change to 50/50.3 The initial split is in proportion to the equity investors' respective investments in the Cogeneration Project. Following reversion, the general partner shares equally with the limited partners with respect to partnership income, losses, tax credits, and cash distributions. This shift in distribution arrangements is designed to reward the general partner if the partnership performs well. This arrangement reduces the limited partners' agency risk exposure because it gives the general partner a strong financial incentive to make the project successful.
Project Economics
The Cogeneration Project's principal sources of revenue are from the sale of electricity under the 15-year electric power purchase agreement with Local Utility and from the sale of steam under the 15-year steam purchase agreement with Chemical Company. Electricity revenues can be predicted with a high degree of certainty because (1) the electric power purchase agreement defines contractually the price for each megawatt-hour of electricity delivered to Local Utility each year for 15 years, and (2) the capacity of the cogeneration facility to generate electricity is known and the operating reliability of similar plants has been well documented. The steam purchase agreement establishes minimum purchase quantities, specifies the price per thousand pounds of steam, and provides that this price will increase during the 15-year term of the contract, based on annual changes in the U.S. producer price index (PPI).
The Cogeneration Project's operating costs are largely contractually determined. Local Utility will supply gas under a 15-year gas supply agreement. The contract specifies a gas price that will prevail during the initial year of the contract. The gas price will change in subsequent years, in line with changes in the price Cogeneration Company receives for the electricity it sells to Local Utility. Local Utility will operate Cogeneration Company. Its management fees will be a specified fixed amount for the initial year; they will escalate thereafter in line with changes in the PPI. Local Utility has agreed to maintain and repair the cogeneration facility in accordance with an agreed-on fee schedule. Engineering Firm has guaranteed that the cogeneration facility will operate at its design capacity for at least 15 years.
Cash Flow Projections
The cash flow projection assumptions for the Cogeneration Project are shown in Table 11.2. The contract volumes of electricity (as specified in the electric power purchase agreement) and steam (as specified in the steam purchase agreement) establish the base output levels for 15 years. The electric power purchase agreement specifies electricity prices. The steam purchase agreement provides a base steam sales price, which can be escalated using a forecast of future changes in the PPI. (Such forecasts are available from economic forecasting services.) The projected volumes and prices can be used to forecast annual revenue amounts.
Table 11.2 Cogeneration Project: Assumptions for the Cash Flow Projectionsa.
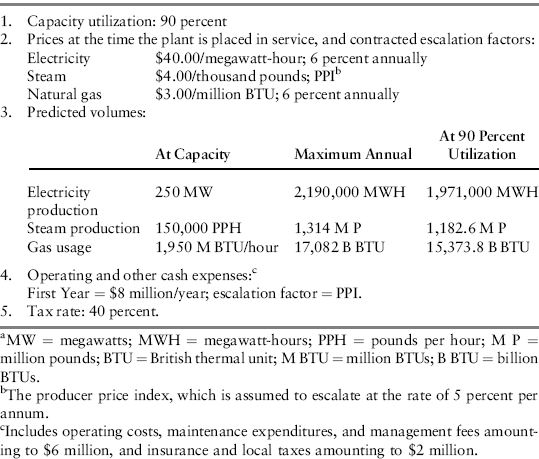
The design of the cogeneration facility will determine the annual levels of gas usage. The gas supply agreement escalates the gas price to match future increases in electricity prices, which were used to prepare the revenue projections. Management fees and other operating expenses will also increase with the PPI, as provided for in the 15-year operating contract entered into with Local Utility. Management fees are included in “Operating and other cash expenses” in Table 11.2.
Table 11.3 contains the projected operating cash flows. They are based on the assumptions provided in Table 11.2. When preparing a set of cash flow projections for a prospective project, it is important to give all the critical details. Prospective lenders and equity investors are particularly interested in the assumptions because the projections are meaningful only to the extent the assumptions have a sound basis.
Table 11.3 Cogeneration Project: Projected Operating Cash Flows (Millions of Dollars).

Constant Dollars versus Current Dollars
An error frequently committed when making cash flow projections involves escalating revenue items at one rate and cost items at another rate, without any real justification for doing so. When these escalation rates differ, it is important to furnish an explanation along with the projections. Escalating revenues at a higher rate than costs will introduce a basis in favor of proceeding with the project. An economically unprofitable project may then appear to be profitable.
Some financial economists recommend preparing the projections for a project on the basis of dollars of constant purchasing power (or, more simply, constant dollars). Constant dollars differ from so-called current dollars, which is the unit of measurement employed for the Cogeneration Project, in that constant dollars have the effect of general inflation removed. Many companies have found it useful to prepare cash flow projections in constant dollars when evaluating a project that would be developed in a high-inflation economy and would have certain critical revenue or cost items received or paid, respectively, in the local currency. When the cash flows are expressed in constant dollars, the discount rate must similarly be expressed in terms of inflation-adjusted required rates of return to preserve consistency.
When a project's revenues and costs are all denominated in a single freely tradable currency, and the inflation rate in the country that issued the currency is comparatively low (no more than a single-digit rate), the extra work required to prepare the projections on a constant-dollar basis is seldom justified. A better analytical approach is to specify the inflation assumptions, as in Table 11.2, and then show the effects of different inflation assumptions in a separate sensitivity analysis.
Preparing Projected Financial Statements
A project's initial capitalization table shows the financial condition of the project. The cash flow projections will indicate how profitable the project is expected to be, how much cash flow it is expected to generate, and how that cash flow will be allocated among the various providers of capital. These projections can also be used to predict how the project's financial condition is expected to change over the life of the project. Consequently, the initial capitalization table can be used in conjunction with the information underlying the cash flow projections to prepare a set of projected financial statements—income statement, balance sheet, and statement of cash flows—for each year in the project's life.
Evaluating a Project's Debt Capacity
The amount of debt a project can support depends on the amount of cash flow that is available to make debt service payments, the extent of supplemental credit support mechanisms, and the loan parameters—the interest rate, the maturity date, the loan amortization requirements, and the lenders' coverage requirements.
Borrowing Capacity
Chapter 9 presented various models for gauging a project's borrowing capacity. The cash flow information contained in Table 11.3 can be used together with equations (9.1) and (9.3) to determine the borrowing capacity of the Cogeneration Project. The present value of the projected cash flows for years 1 through 10, calculated at a 10 percent discount rate, is $165.22 million. Suppose that long-term lenders require a cash flow coverage ratio of α = 1.75. Then the maximum borrowing capacity is $94.41 million, which exceeds by a comfortable margin the $85.131 million initial debt level planned for the Cogeneration Project.
Annual Coverage Tests
Chapter 9 discussed three coverage tests that lenders apply to measure a project's capacity to pay debt service year by year. The interest coverage, fixed charge coverage, and debt service coverage ratios have been presented in equations (9.11), (9.12), and (9.13), respectively. Table 11.4 provides the annual interest coverage and debt service coverage ratios for the Cogeneration Project. Cogeneration Company does not plan to rent any equipment, so the fixed charge coverage ratio would be identical to the interest coverage ratio. If, however, Cogeneration Company did decide to rent significant amounts of equipment or real estate, then the fixed charge coverage ratio would have to be calculated for each year.
Table 11.4 Cogeneration Project: Annual Interest and Debt Service Coverage Ratios.
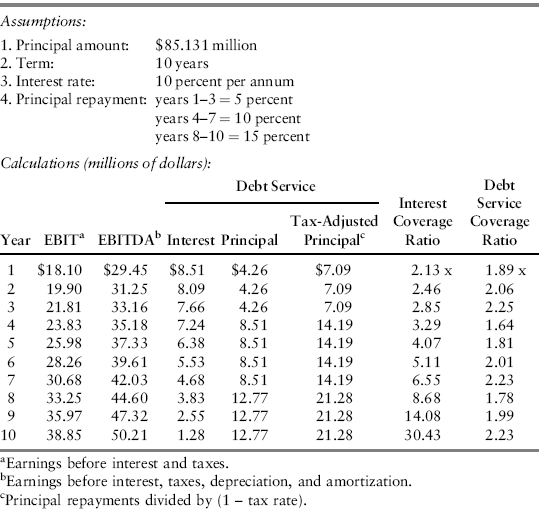
The interest coverage ratio increases steadily as the project loan is repaid. The debt service coverage ratio decreases in those years when the principal repayment increases. Lenders are most concerned with the values of these ratios during the early years of a project's life. For the Cogeneration Project, the interest coverage ratio is 2.13 in year 1 and exceeds 3.00 in year 4. The debt service coverage ratio is 1.89 in year 1 and never falls below 1.64. In view of the strength of the Cogeneration Project's contractual arrangements, coverages of the magnitudes just calculated would suggest that Cogeneration Company should be able to service its debt in a timely manner.
Interest-Rate Risk
If the debt incurred for a project bears a floating rate of interest, rising interest rates can impair the project's coverage ratios. A different form of interest rate risk also exists. At the time a project is initially financed, floating-rate bank debt is often arranged to cover construction costs; the expectation is that it will be refunded with fixed-rate debt following completion. But if interest rates rise during the construction period, the fixed-rate long-term debt will prove to be more expensive than anticipated.
A number of strategies are available for handling these risks. First, the construction loan can be arranged so that the portion that is not repaid with the proceeds from the equity financing turns into a term loan. The term loan can be refunded if interest rates decrease. But interest rates might not decrease for several years; hence, this strategy really does not reduce the project's interest rate risk exposure.
Alternatively, the interest rate risk can be hedged. Selling financial futures contracts short during the construction period is one hedging strategy. If interest rates rise during the construction period, and if the hedges have been structured properly, the profit realized on closing out the financial futures positions will offset the impact of the higher interest rates on the project's cost of debt. Chapter 14 describes various hedging strategies and how to implement them.
An alternative hedging strategy that is useful for locking in a future fixed rate of interest utilizes a deferred-interest-rate swap agreement. The project company could obtain protection against a possible increase in interest rates by entering into a deferred swap contract under which (1) the project company would agree to swap interest payment obligations with the counterparty to the contract beginning as of the completion of project construction, and (2) the project company's obligation would be calculated at a specified fixed interest rate and the counterparty's obligation would be calculated based on a specified floating interest rate. That is, a deferred swap contract establishes the terms of the interest rate swap as of the date the contract is entered into, but the start of the swap period is delayed for some agreed-on period. Deferred-interest-rate swap contracts are described in Chapter 14.4
Measuring Expected Rates of Return
The projected operating cash flows in Table 11.3 form the basis for measuring the expected rates of return to Engineering Firm, Local Utility, and the passive equity investors. Engineering Firm and Local Utility invest identical amounts. Each has the same expected rate of return; I refer to it as the “return to sponsor equity.” I refer to the expected rate of return to the passive equity investors as the “return to limited partnership equity.” The latter is the easier of the two to calculate, so I consider it first.
Return to Limited Partnership Equity
The passive equity investors, as limited partners, are junior to the lenders; they receive cash distributions out of what is left over after Cogeneration Company pays debt service for the year. The size of the cash distributions is not specified contractually; it depends on the profitability of the Cogeneration Project. The passive equity investors also receive their share of the tax benefits associated with project ownership plus a share of the Cogeneration Project's residual value. To realize these benefits, the passive equity investors had to commit to the construction lenders to invest a stated percentage of the project's equity capital (55.56 percent of limited partnership capital and 50 percent of total equity capital), once the Cogeneration Project passes its completion tests.
As illustrated in Figure 11.1, the limited partners (including Engineering Firm and Local Utility, to the extent of their limited partnership interests) are entitled to 90 percent of income, losses, and cash distributions from the Cogeneration Project prior to reversion, and 50 percent of these amounts thereafter. The passive equity investors are entitled to 55.56 percent of these amounts—both before and after reversion. Thus, prior to reversion, the passive equity investors will receive 50 percent of income, loss, and cash flow; after reversion, they will receive 27.78 percent (i.e., 55.56 percent of the limited partners' 50 percent share).
Table 11.5 shows the details of the calculation of annual after-tax returns to the passive equity investors. The expected rate of return is calculated as the internal rate of return of the after-tax cash flow stream. This calculation assumes that the passive equity investors' share of the Cogeneration Project's residual value, net of related taxes, is $35.75 million.5 In particular, it is assumed that Cogeneration Company can be sold at the end of the fifteenth year for a price equal to five times the year-15 after-tax cash flow.
Table 11.5 Annual After-Tax Cash Flow to Cogeneration Project's Passive Equity Investorsa (Millions of Dollars).
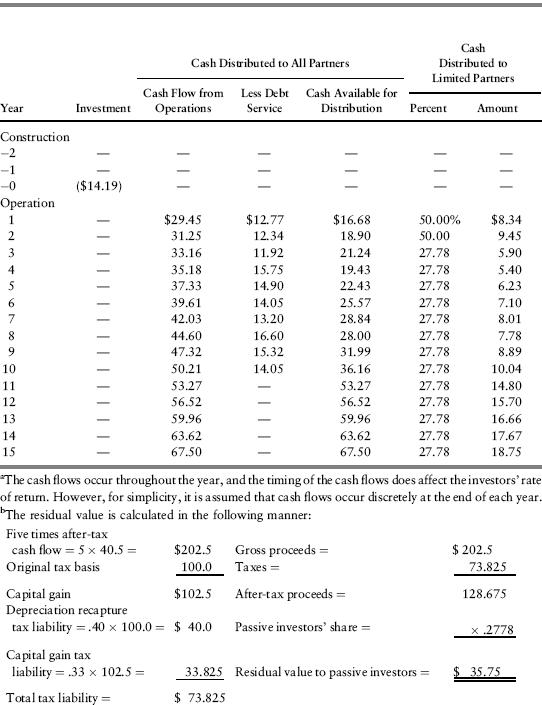
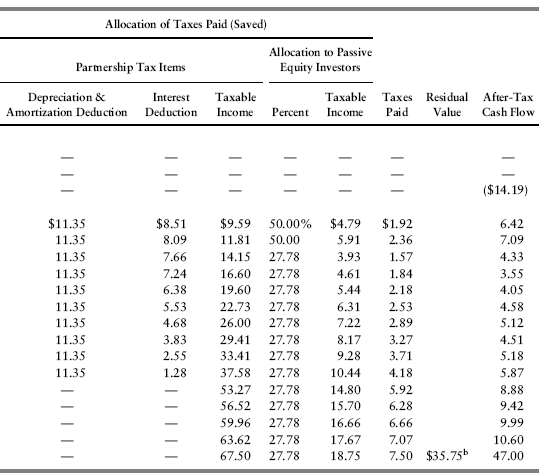
The expected rate of return for the passive equity investors in the Cogeneration Project, based on the after-tax cash flow stream in Table 11.5, is 40.09 percent. They will agree to invest in the Cogeneration Project only if this expected rate of return is no less than the rates of return they could expect to realize by investing in projects of comparable risk.
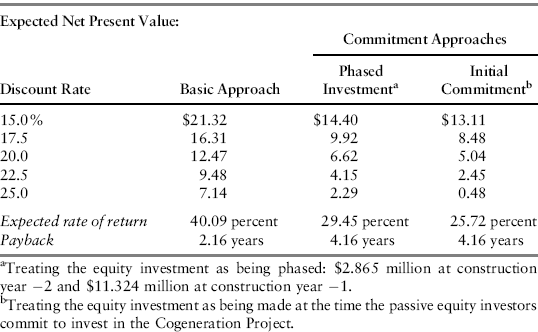
The timing of the equity investment affects the investors' expected rate of return. The passive equity investors in the Cogeneration Project will have to commit to invest their equity prior to the start of construction. Table 11.5 treats the equity investment as occurring at the time these equity commitments are funded, that is, just prior to the start of operations. It can be argued, however, that the equity investment really occurs at the time the commitment is made. The truly correct approach is not entirely clear because the passive equity investors will not have to fund their commitments unless and until the Cogeneration Project passes its completion tests. If the expected rate of return is calculated based on when the commitments are entered into, the passive equity investors' expected rate of return is 25.72 percent.6
Passive equity investors often perform a third expected rate of return calculation in which they assume that their equity investments are made as construction proceeds and represent the percentage of the total project cost that they have effectively agreed to fund. Equity will represent 25 percent of Cogeneration Company's capital structure. The passive equity investors will provide half of this amount. The passive equity investors, under this conservative approach to measuring their expected rate of return, would treat their equity investments as taking place as construction and related costs occur in an amount equal to 12.5 percent of these costs (i.e., 50 percent of the 25 percent project equity).
Under this approach, $2.865 million of the passive equity investment occurs at construction year −2 and $11.324 million occurs at construction year −1.7 This investment pattern leads to an expected rate of return of 29.45 percent.
Table 11.6 summarizes the expected rate of return analysis for the passive equity investors. Depending on how the passive equity investors view the timing of their equity investments, their expected rate of return falls between 25.72 percent and 40.09 percent. If their required rate of return is 15 percent, their expected net present value falls between $13.11 million and $21.32 million. The net present value remains positive even when the required rate of return is 25 percent and the equity investment is treated as occurring coincident with the initial commitment to invest ($0.48 million NPV).
Table 11.6 Cogeneration Project: Analysis of the Expected Rate of Return to the Passive Equity Investors (Millions of Dollars).
Return to Sponsor Equity
Engineering Firm and Local Utility have equal ownership interests in Cogeneration Corporation, the general partner of Cogeneration Company. Cogeneration Corporation owns 10 percent of the equity in Cogeneration Company. It receives 10 percent of the income, losses, and cash distributions of Cogeneration Company until reversion occurs, and 50 percent thereafter. In addition, Engineering Firm and Local Utility each own 22.22 percent of the limited partnership interests in Cogeneration Company. For managing the business of Cogeneration Company, Local Utility will receive a management fee equal to 3 percent of project revenue. Local Utility estimates that this management fee will approximate its cost of managing Cogeneration Company, so no profit will be generated.
Like the passive equity investors, Engineering Firm and Local Utility will commit to fund their equity investments prior to the start of the construction period. Table 11.7 shows the annual after-tax cash flow to the sponsors, Engineering Firm and Local Utility. Table 11.8 summarizes the expected rate of return analysis for the sponsors. Note in Table 11.7 that the sponsors will receive 50 percent of profits, losses, and cash distributions prior to reversion, but they will receive 72.22 percent after reversion (i.e., the 50 percent general partner's share plus 44.44 percent of the limited partner's 50 percent share).
Table 11.7 Annual After-Tax Cash Flow to Cogeneration Project's Sponsorsa (Millions of Dollars).
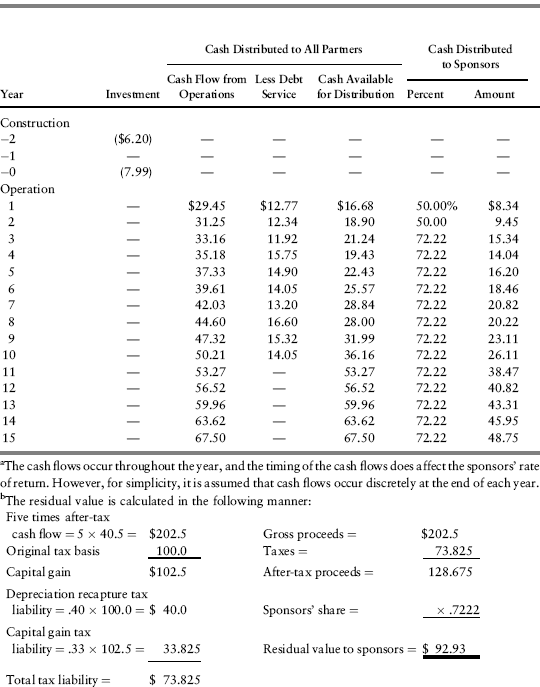
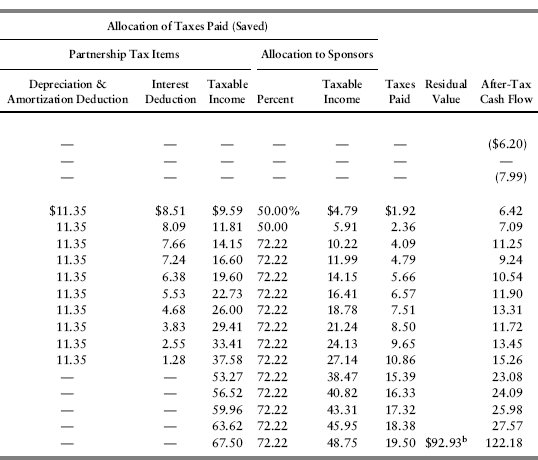
Table 11.8 Cogeneration Project: Analysis of the Expected Rate of Return to the Sponsors (Millions of Dollars).
| Expected Net Present Value | ||
| Discount Rate | Basic Approach | Conservative Approacha |
| 15.0% | $44.01 | $37.06 |
| 17.5 | 32.79 | 25.99 |
| 20.0 | 24.55 | 17.89 |
| 22.5 | 18.41 | 11.89 |
| 25.0 | 13.79 | 7.40 |
| Expected rate of return | 44.25 percent | 31.66 percent |
| Payback | 4.06 years | 4.06 years |
| a. Treating the equity investment as being made at the time the sponsors commit to invest in the Cogeneration Project. | ||
The sponsors' expected rate of return on equity exceeds the passive equity investors' expected rate of return. This is to be expected because of the sponsors' greater risk exposure as general partners.
Sensitivity Analysis
Tables 11.2 through 11.8 contain results for the expected case. But results rarely turn out exactly as expected. For the Cogeneration Project, the residual value is uncertain. Also, unless some form of interest rate protection is arranged, the interest rate on the 10-year debt issue is uncertain. On the other hand, the construction contract eliminates uncertainty with regard to the construction cost. Design changes could affect this cost, but the Cogeneration Project is unlikely to require significant design changes because it will utilize a plant design developed previously. The 15-year electric power purchase agreement and the 15-year steam purchase agreement mitigate output-pricing risk. There is still a risk that revenues might fall short of expectations because of unplanned outages; however, this risk is small because the operating reliability of similar plants has been well documented. The 15-year gas supply agreement eliminates gas price risk. If these contracts were not in place, then a sensitivity analysis would have to be performed for each of the factors mentioned—construction cost, electricity price, steam price, gas price, and the levels of electric power and steam output.
Figure 11.2 illustrates the sensitivity of the projected returns on equity to variation in the residual value. Residual value is shown both before and after taxes. Both calculations are based on the actual timing of the cash equity investments, as shown in Tables 11.5 and 11.7. Even if the residual value is zero, the projected rate of return to the passive equity investors is 39.41 percent, and the projected rate of return to the sponsors is 43.75 percent. The projected rates of return show very little sensitivity to the residual value.
Figure 11.2 Sensitivity of Returns on Equity to Variation in the Residual Value aBefore Allocation between the Passive Equity Investors and the Sponsors
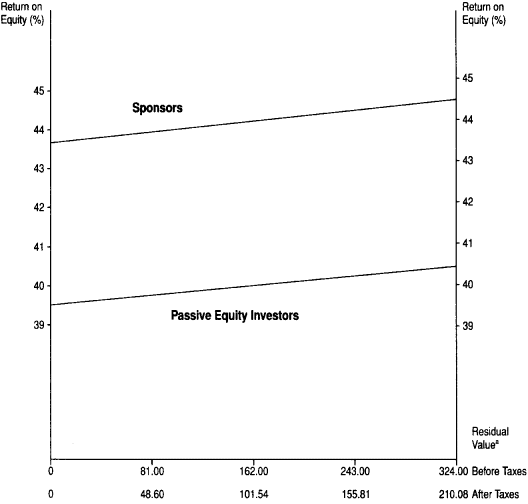
Table 11.9 illustrates the sensitivity of the interest coverage ratio and the debt service coverage ratio, in years 1 through 4, to changes in the interest rate on the 10-year debt issue. Even if the interest rate on this debt should increase to 14 percent, the interest coverage ratio during the first four years never falls below 1.52, and the debt service coverage ratio during the same period never falls below 1.45.
Table 11.9 Sensitivity of the Interest Coverage and Debt Service Coverage Ratios to the Rate of Interest on Long-Term Debt.
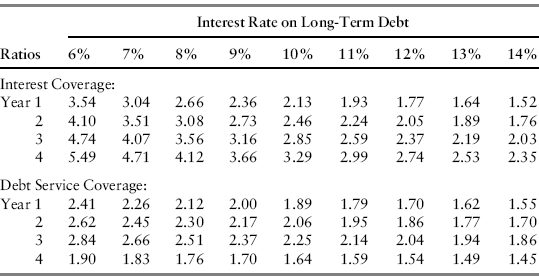
The Cogeneration Project appears financially feasible when financed on the basis contemplated, even if the interest cost of project debt should rise to 14 percent. Nevertheless, if interest rates were to rise above 14 percent, the coverage ratios would deteriorate further and would, at some point, jeopardize the sponsors' ability to raise the amount of debt financing contemplated. To eliminate this risk, the sponsors could prefinance or else purchase some form of interest rate protection.
If the electric power purchase, steam purchase, construction, and gas supply agreements were not in place, then additional sensitivity analyses like those presented in Figure 11.2 and Table 11.9 would indicate how sensitive the equity rates of return and loan coverage parameters are to variation in these prices and quantities.
Chapters 17 through 20 contain other examples of sensitivity analyses for four large project financings.
Conclusion
Discounted cash flow analysis plays an important role in project financing. A project cannot be financed on a project basis—or on any other basis—unless it is expected to be profitable. Discounted cash flow analysis plays a crucial role in determining a project's expected profitability.
A financial model of the project is also useful in demonstrating the project's ability to service its debt obligations and provide an acceptable rate of return to the project's equity investors. Prospective lenders to a project, and its equity investors, will carefully review these projections before committing any funds.