2.5 Shifts versus Movements Along Demand Curves
It can be tricky to figure out when to look for movements along the demand curve versus shifts in that curve. But it’s essential if you are going to correctly forecast the consequences of changing economic conditions. Here’s a simple rule of thumb: If the only thing that’s changing is the price, then you’re thinking about a movement along the demand curve. But when other market conditions change, you need to think about shifts in the demand curve.
Movements Along the Demand Curve
To see why changes in price are different from changes in other factors, let’s revisit Darren after the price of gas changes. This price change won’t lead Darren to change his answers to the survey in Figure 1. That survey already described his plans to change the quantity of gas he uses if the price changes. Likewise, his individual demand curve—which simply plotted his answers to that survey—will be unchanged. And if individual demand curves don’t shift following a price change, then neither will the market demand curve. The logic is simply this: A demand curve is a plan for how to respond to different prices, and if buyers’ plans haven’t shifted, then the market demand curve hasn’t shifted.
Indeed, managers find the demand curve to be useful precisely because they can use it to assess the consequences of a price change. For instance, Panel A in Figure 10 shows that when the price of gas is $4, the total quantity demanded will be 1.6 billion gallons per week, and when the price of gas falls to $2, the quantity demanded will rise to 2.4 billion gallons. As you can see, this price change leads to a movement along the demand curve. And this analysis shows that a lower price leads to an increase in the quantity demanded.
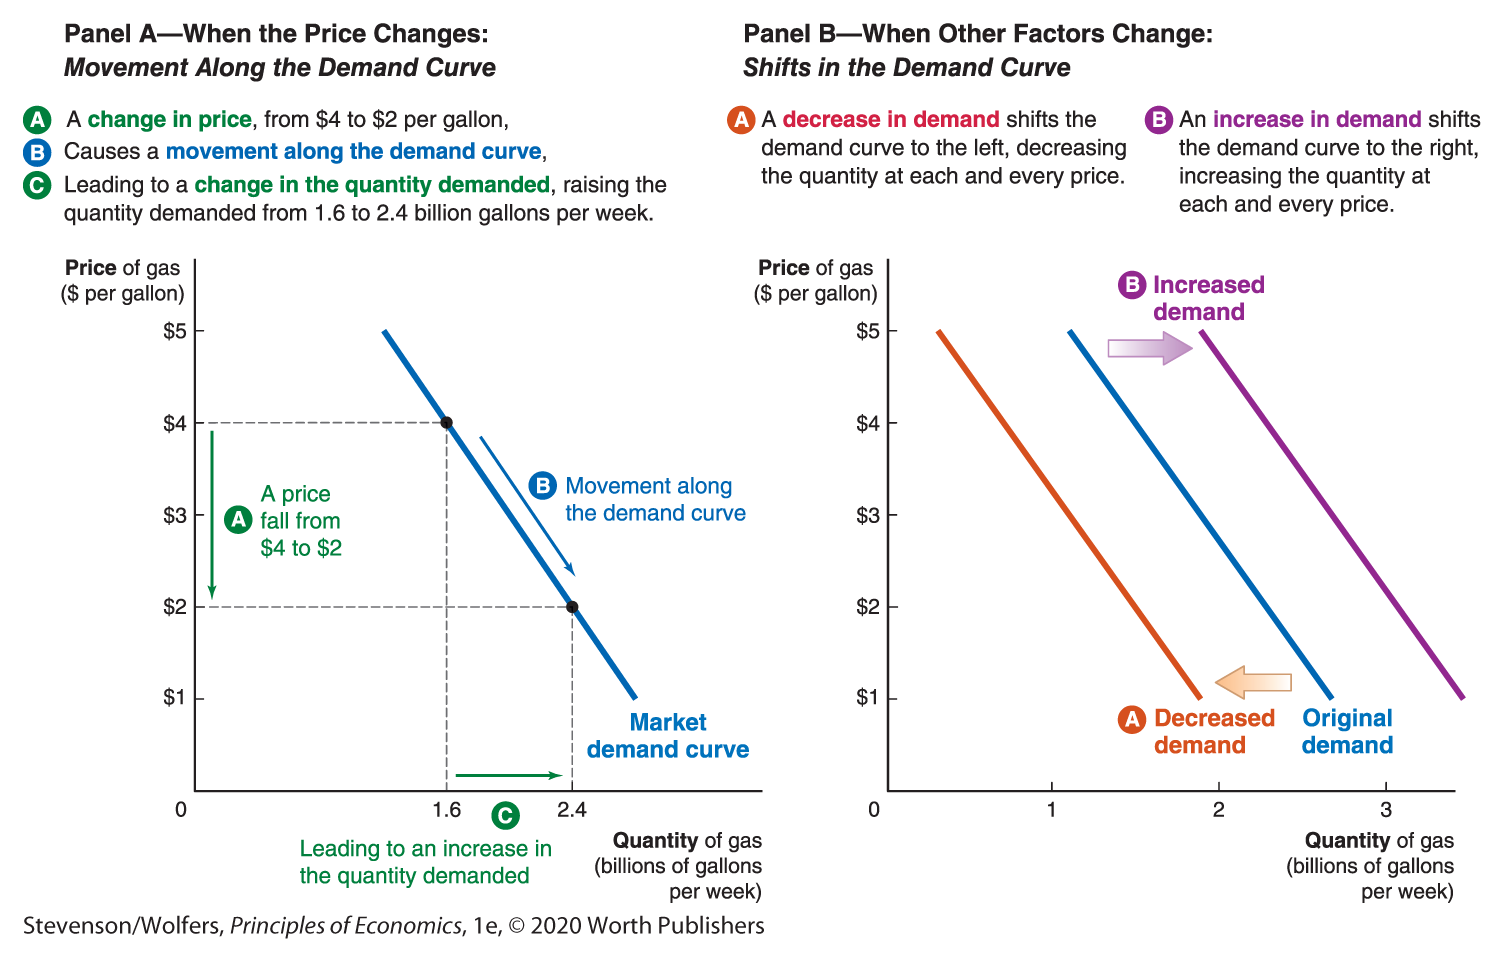
Figure 10 | Movement Along the Demand Curve versus Shifts in the Demand Curve
Shifts in Demand
But if other factors change—factors other than the price—then Darren might revise his buying plans. For instance, changes in things like Darren’s income, his preference for driving, the price of alternatives such as Uber, his expectations about future gas prices, or the number of other drivers creating traffic could all lead him to decide to change how much gas he’ll buy even if the price doesn’t change. When these factors change the quantity that Darren demands at a given price, they lead to a shift in his demand curve.
To figure out whether a change in market conditions will shift the demand curve, ask yourself: Has something changed that would cause you to give different answers to a survey about the quantity you’ll demand at each price? If so, then this will shift your demand curve. The right-hand panel of Figure 10 illustrates an increase in demand, which causes the demand curve to shift to the right, and also a decrease in demand, which causes it to shift to the left.
Of course, not every change in market conditions will cause the demand curve to shift. To figure out which ones will matter, apply the interdependence principle. If something is unconnected to your buying decisions, then it won’t change your buying plans—which is the quantity you demand at a given price—and so it won’t shift your individual demand curve. Put simply, if your answers to the survey about your demand plans haven’t changed, then your demand hasn’t shifted. But if they do change, then it is connected, and this dependence may change things. To make it easy to think about what could shift the demand curve, remember the six demand shifters: Income, Preferences, Prices of related goods, Expectations, Congestion and network effects, and the Type and number of buyers. Finally, let me give you a hint that’ll help you memorize these six factors: Rearrange the first letter of each of them, and it’ll spell out PEPTIC, which should make this lesson a bit easier to digest.