22.1 Economic Growth Facts
To understand economic growth today, it’s useful to start by understanding how much people struggled and how little progress there was for most of human history. So let’s step way back in time to more than a million years ago.
Economic Growth Since 1 Million B.C.

Life before civilization.
There aren’t a lot of records back to 1 million B.C., but we now have a few clues, and they all paint a bleak picture. People lived hand-to-mouth, first as hunters and gatherers. And then, sometime around 12,000 years ago, our ancestors began to farm. The invention of agriculture allowed people to settle down into communities and form societies. While they no longer had to roam to find food, most people toiled daily in agriculture. Even so, they did not produce enough food to feed everyone adequately. People were so poor that starvation and malnutrition were common. Skeletal remains show severe deficiencies in vitamins and minerals, and widespread disease. Men were six inches shorter, on average, compared to today, reflecting the malnutrition they faced as children. While there were some bright spots, such as ancient Greece, and there were rulers who amassed riches, most people from 1 million B.C. through 1200 A.D. lived in grinding poverty. And each successive generation was as poor as the previous.
Economists have tried to measure what was produced back in 1 million B.C. and the years that followed. They estimate that from around 1 million B.C. until around 1200 A.D., GDP per person was only around $200 per year in today’s dollars. While it’s hard to know the exact amount for sure, it was roughly the minimum of what was needed to sustain life. What is clear is that GDP per person didn’t change much until around 1200 A.D., when it started to rise, albeit very gradually. In fact, growth was so slow that it took roughly 600 years for GDP per person to double. At the start of the 1800s, world GDP per person was roughly $400. Remember that’s adjusted for inflation, so that means $400 worth of goods and services at prices similar to those you face today. Imagine trying to get by a whole year on only $400!
Agricultural advances meant more food and less hunger.
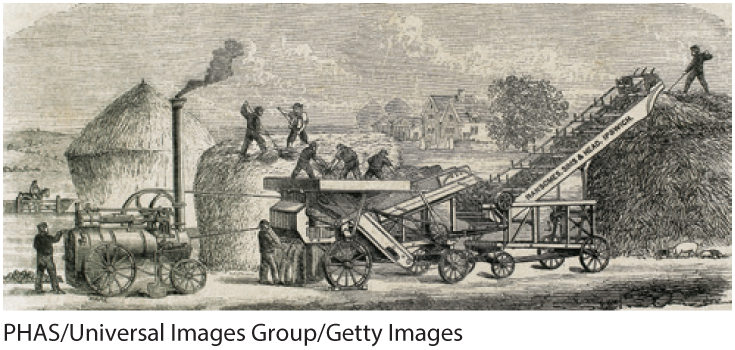
Technological advances transformed agriculture.
For much of human history, most people’s primary job was securing enough food to avoid starvation. But as agricultural techniques improved over the centuries, people could produce more food with less work. The benefits of these changes became most apparent in the 1800s, with advances in farming such as better crop rotation, the use of farm enclosures, switching to higher-yielding crops, and new farm equipment. Markets to distribute food became more sophisticated, thanks to better transportation infrastructure. The expansion of inland waterways and roads reduced the cost of selling what farmers produced. Taken together, these developments meant less hunger and fewer people needed to work on farms. By 1850, less than a quarter of the British workforce worked in agriculture; these benefits were also seen in much of Europe and North America.
The Industrial Revolution created an engine of economic growth.
Because fewer resources were needed to grow food, increased agricultural production also sowed the seeds for the Industrial Revolution—a revolution that brought machine power to our efforts to make and transport food and goods. Now that people had more time to pursue other activities, intellectual life thrived. Inventors pioneered revolutionary new products such as the steam engine, sewing machine, telephone, and light bulb. Prior to these inventions, most things were powered by humans or animals. It can be hard to comprehend the magnitude of this change, but take a minute to imagine what your life would be like if you had nothing but your own energy and that of animals to help you get through your day.

A century of growth transformed Austin, Texas.
The invention of machines that could substitute for human or animal labor, and the subsequent investment in making these machines available, brought enormous growth in what people could produce. Workers moved from farms to factories, and their ability to produce output increased at a rapid pace. This was the real beginning of an increase in income and living standards. After taking nearly 600 years for global GDP per person to double, it more than doubled between the early 1800s and the early 1900s. Economic growth then exploded: Worldwide GDP per person doubled again by the 1950s, and then again by 1975, and again by the early 2000s.
Economic growth means rising living standards and longer lives.
Economic growth means that people produce more, and when they produce more, they can consume more. That means fewer people go hungry, and more people have a comfortable place to live, sanitary conditions, and more resources to invest in their health and education. Growth doesn’t just mean you consume more stuff; it’s what enables you to live and thrive. That’s why economic growth led the world population to grow and life expectancy—the average number of years that a person may expect to live—to rise. In 1800, there were a billion people in the world; today, there are more than 7 billion. In 1800, average life expectancy in every country was below age 50. Today, the average person in many of the richest countries in the world can expect to live well into their 80s. (Sadly, while the United States is among the richest countries, it has a lower average life expectancy than many other rich countries.)
And yet even today, average life expectancy in many of the world’s poorest countries is not much above age 50. The problem is that the agricultural and industrial revolutions didn’t lead to economic growth everywhere. Some countries thrived, while others stagnated. And some countries started down the right path, but got lost along the way. Let’s zoom in on the past 200 years to see how these big differences between rich and poor countries emerged.
Economic Growth Over the Past Two Centuries
When economic growth was proceeding at a glacial pace, there wasn’t much of a difference in GDP per person between countries. Figure 1 shows GDP per person in various parts of the world, first in 1820 and then in 2010. In 1820, annual GDP per person averaged around $700 in Africa, $900 in Asia, and roughly $1,000 in Latin America and Eastern Europe. In the wealthiest parts of the world—Western Europe and the United States (and also Canada and Australia)—GDP per person was a bit more than $2,000. While that was double much of the rest of the world, hunger was still never too far from people’s minds.
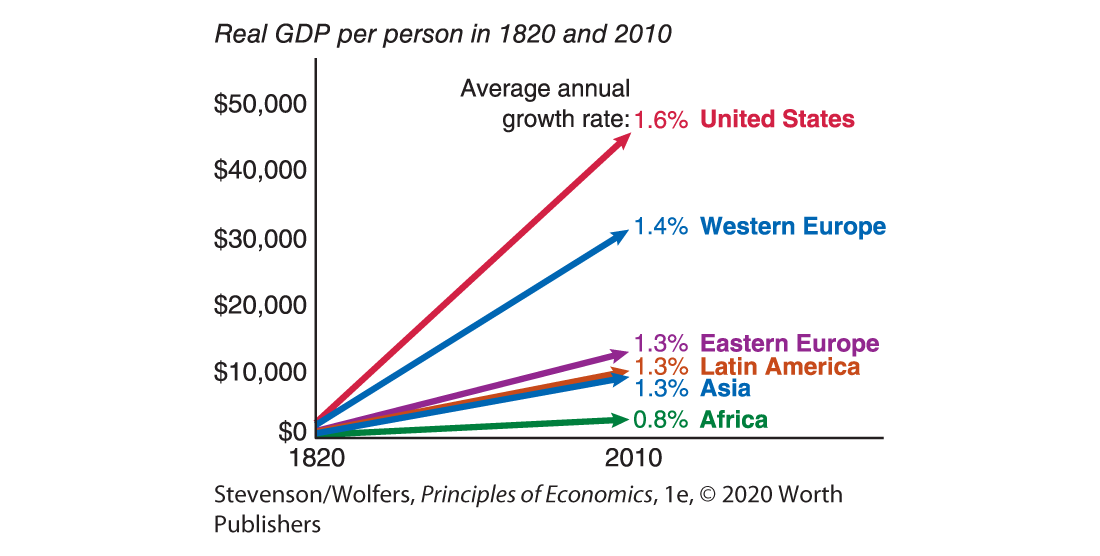
Figure 1 | Small Differences in Growth Rates Have Big Consequences
Small differences in growth rates can have big effects.
The Industrial Revolution led to a rapid rise in GDP, but it fueled more economic growth in some parts of the world than others. As Figure 1 illustrates, what may seem like small differences in growth rates lead to enormous differences over time. In fact, only a few tenths of a percentage point in annual growth rates differentiates today’s economically developed countries from less-developed countries—but those small differences in growth rates were compounded over hundreds of years. The countries with fast-growing GDP were disproportionately concentrated in Western Europe and North America. In the United States, GDP per person was nearly $50,000 in 2010—more than 20 times greater than it had been roughly 200 years earlier. In Western Europe, GDP per person was nearly $35,000 in 2010. The growth in Western Europe and North America left the rest of the world far behind. By 2010 there was a clear distinction between the “rich” West and the rest of the world, where GDP per person grew, but at much slower rates. In Africa output per person grew at roughly half the rate as in the West, which meant that by the time it doubled in Africa, it would have quadrupled in the West.
There have been growth successes and disasters.
Spain was once a great power, sending explorers around the world, fostering international trade, and establishing an enormous empire. But between 1600 and 1850, its economy barely grew, while income per person in Great Britain more than doubled. Spanish GDP per person grew so slowly that by 1900, it was only roughly double what it had been back in the 1600s! Even in 1950, when some of today’s older Spaniards were born, their incomes were only about two and half times what their ancestors would have had four hundred years earlier. The second half of the twentieth century was more successful for Spain; income per person in 2010 was roughly eight times what it was in 1950.
Argentina provides another example of what happens when growth stalls. Just before the turn of the twentieth century, Argentina was one of the richest countries in the world, and its economy was growing rapidly. Figure 2 shows that around 1900 its GDP per person was comparable to that in the United States and Britain. But growth sputtered in the early 1900s, and it made little progress for decades. A country that had once been richer than Spain, Japan, and South Korea fell behind those countries’ economies. In 2017, its average income was about one-third that in the United States.
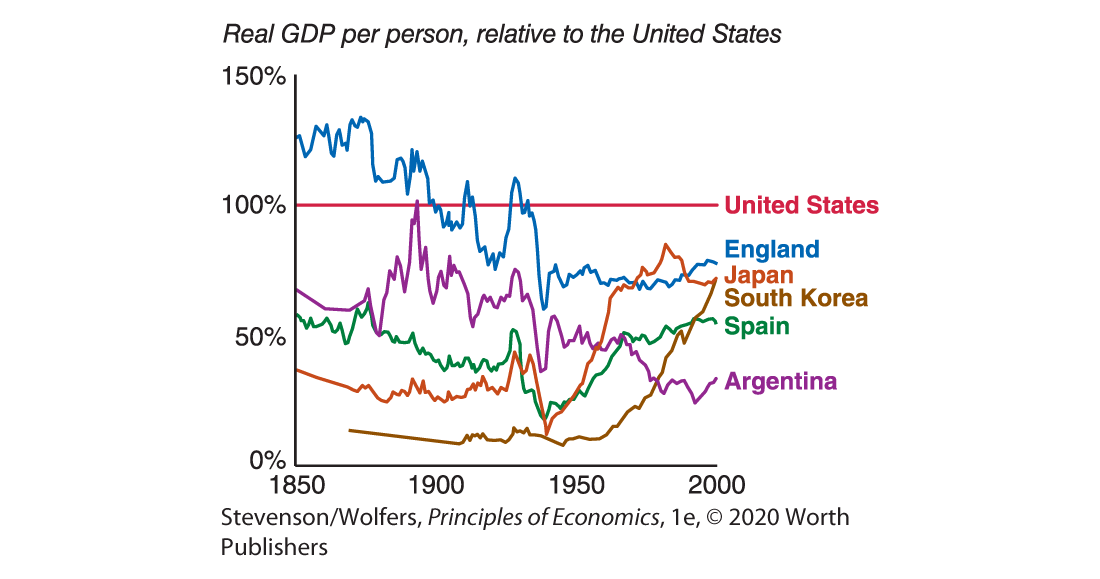
Figure 2 | Growth Disasters and Miracles
Figure 2 also shows the success stories of Japan and South Korea. Both countries had little growth through the mid-1900s. The second half of the twentieth century, however, was a time of robust GDP growth. Both countries now have GDP per person on par with many affluent Western nations.
Countries like India and China stagnated for centuries, before taking off during the past few decades. In 2017, India’s average income was nearly four times higher than in 1990, and China’s average income had grown tenfold. In comparison, the average income in the United States only rose by about half during that same time period. Recent rapid growth in poorer countries has helped decrease inequality between nations around the world.
The facts about economic growth are astonishing. Over the past 200 years the global economy has grown enormously, transforming our quality of life. But this development has been uneven, creating remarkable disparities with average income in some countries many times larger than in others. Now let’s turn to figuring out why.